Experimental Conditions for Determination of the Neutrino Mass Hierarchy With Reactor Antineutrinos
Abstract
This article reports the optimized experimental requirements to determine neutrino mass hierarchy using electron antineutrinos () generated in a nuclear reactor. The features of the neutrino mass hierarchy can be extracted from the and oscillations by applying the Fourier sine and cosine transform to the spectrum. To determine the neutrino mass hierarchy above 90% probability, the requirements on the energy resolution as a function of the baseline are studied at . If the energy resolution of the neutrino detector is less than and the determination probability obtained from Bayes’ theorem is above 90%, the detector needs to be located around 48–53 km from the reactor(s) to measure the energy spectrum of . These results will be helpful for setting up an experiment to determine the neutrino mass hierarchy, which is an important problem in neutrino physics.
- PACS numbers
-
13.15.+g, 14.60.Pq, 14.60.Lm, 29.85.+c
- Keywords
-
neutrino mass hierarchy, reactor experiment, Fourier transform
I Introduction
Since the measurement of the large at RENO, Daya Bay, and Double Chooz, the precise measurement of neutrino mass hierarchy, the sign of , has become the focus in neutrino physicsreno ; daya ; chooz . It had been believed that the neutrino mass hierarchy can be determined through long-baseline experiments, mainly using accelerator neutrino beams. Recently, the capability of a reactor neutrino experiment at an intermediate baseline to distinguish normal or inverted hierarchy was reported.
For an intermediate-baseline neutrino experiment, many approaches have been proposed; they can be categorized into the analysis methods, which are discussed in Refs.ghoshal ; qian ; ghoshal2 ; li ; takaesu , and the Fourier-transform methodsqian ; ciuffoli ; ciuffoli2 . The analysis methods based on the newly adopted Bayesian approach utilizes all the available information from experiments, and it is straightforward to incorporate the uncertainties in order to evaluate the sensitivity, providing robust and complementary results in the Fourier-transform methodsqian2 . Although the analysis methods are attractive and interesting, the Fourier-transform methods are more intuitive. The prominent merit of the Fourier-transform methods are that the mass hierarchy can be extracted without precise knowledge of the reactor antineutrino spectrum, the absolute value of the large , and the energy scale of a detector. The Fourier-transform methods were introduced to enhance and visualize the structures of mass hierarchy in the frequency spectrum, as first discussed in Ref. learned .
In principle, the mass hierarchy can be determined through precise measurements of and . As is very small and is only of , we have to measure and with a precision much better than . However, and have been measured in many experiments with only precisionpdg .
The intermediate baseline based on reactor neutrino experiments has been explored using the precise measurement of distortions of the energy spectrum with negligible matter effect. Learned et al. proposed a new method to distinguish normal and inverse hierarchy after a Fourier transform of the spectrum of reactor neutrinoslearned . They pointed out that the Fourier power spectrum has a small but not negligible shoulder next to the main peak, and its relative position could be used to extract the mass hierarchy while a non-zero is considered.
In this paper, we analyze the sensitivity of medium-baseline reactor antineutrino experiments to the neutrino mass hierarchy for a baseline range of 30–60 km and overall energy resolution, , in the range of 0 to with the Fourier-transform method. The optimal baseline length is estimated based on the expected probability of determination.
II Detection of reactor antineutrino
In a nuclear reactor, antineutrinos are mainly produced via the -decay of the fission products of the four types of radioactive isotopes, , and , in the fuel. The antineutrino flux having energy in MeV with thermal power in is given as
| (1) |
where and are the relative fission contribution and the energy released per fission of isotope , respectively. Further, is the number of antineutrinos produced per fission and is obtained as followsvogel ; huber :
| (2) | |||||
The antineutrino flux is modulated by neutrino oscillation. The antineutrino survival probability is expressed as
| (3) | |||||
The oscillation phase is defined as
| (4) |
with a baseline . As and appear simultaneously in Eq. (3), the effects of mass hierarchy on are hardly recognized. By using the relation between the squared mass differences,
| (5) |
we rearrange Eq. (3) to eliminate the term as follows:
| (6) | |||||
The plus (minus) sign in the fifth term on the right-hand side of Eq. (6) corresponds to the normal (inverted) mass hierarchy or NH (IH) in short.
In ongoing reactor experiments, we assume that protons will be used as targets to detect electron antineutrinos via the inverse-beta-decay (IBD), which produces a neutron and positron. The antineutrino distribution observed with a detector having free protons can be expressed for an exposure time as follows:
| (7) |
where is the cross section of the IBD process and is the baseline length.
We use the distribution of the expected antineutrino events from the above expression. For the IBD cross section, we use the following expression from Vogel and Beacom’s workvogel2 :
| (8) |
In order to study the sensitivity of the mass hierarchy, we use Fourier-transform method together with Monte–Carlo simulations to compare the simulated IBD energy spectrum with the expected spectrum in both the NH and IH cases.
Taking into account the detector response, the reactor electron antineutrino spectrum becomes
| (9) |
where is the actual energy, is the observed energy with the detector response, is the energy resolution, and describes the detector response function including effects such as the energy resolution and energy scale. In this study, we take the normalized Gaussian function as the response function:
| (10) |
As the neutrino energy is usually measured using scintillators, the energy is typically proportional to the number of photoelectrons, and the error is dominated by the photoelectron statistics. Therefore, the neutrino energy resolution is proportional to . In general, the detector energy resolution is parameterized into two parts:
| (11) |
The first term represents the uncertainty from statistical fluctuation, and the second term originates from the systematic uncertainty. In this study, is assumed for simplicity.
III Extraction of the mass hierarchy
Before the measurement of the surprisingly large , it had been known that at the oscillation maximum of , which corresponds to a baseline of approximately 58 km, the sensitivity to the mass hierarchy is maximized at . As is no longer small, the sensitivity to mass hierarchy needs to be explored as a function of the baseline, , and the detector energy resolution, .
In this study, each Monte–Carlo experiment generates a set of 500,000 events by sampling with input parameters, and . The default oscillation parameters are taken from Ref. reno ; daya ; pdg and listed in Table 1, together with the explored ranges of baseline and energy resolution.
| 0.857 | 0.1 |
| b | ||
|---|---|---|
| 0 |
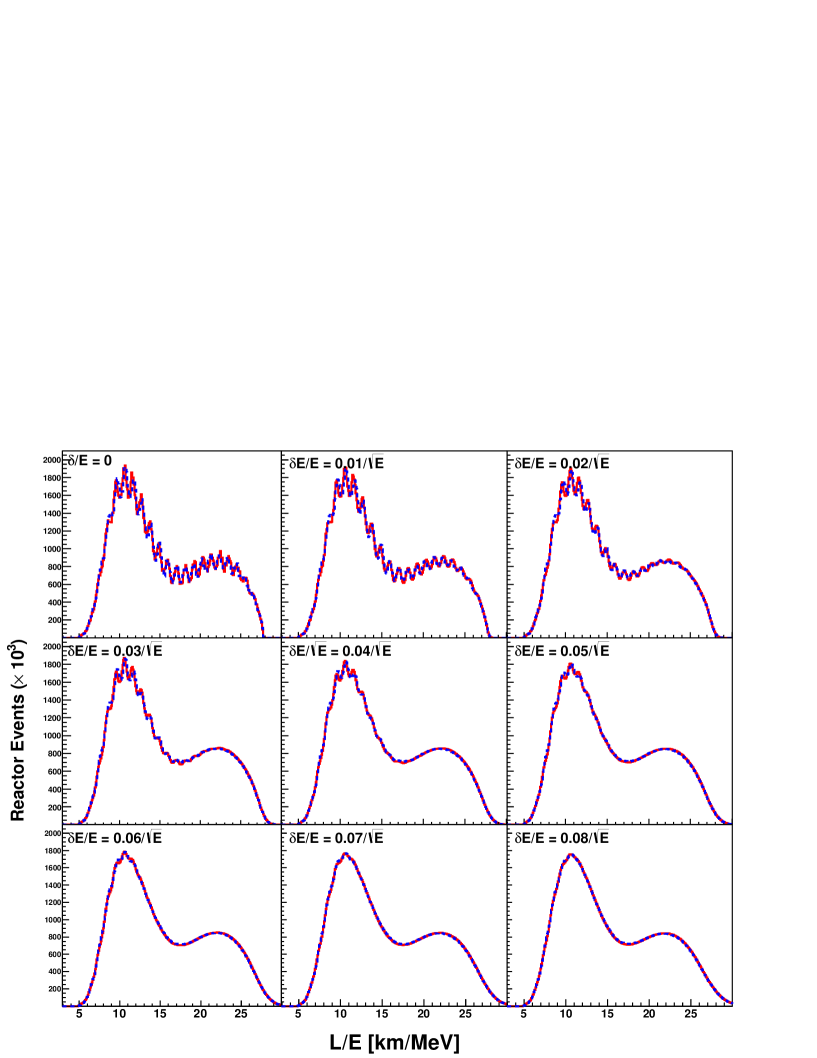
A total of 72,000 experiment samples are independently generated for every 2 km in the baseline and every 0.01 of the energy resolution, . Figure 1 shows the spectra at 50-km baseline with the energy resolution varying from 0, which corresponds to an ideal detector, to . As all neutrino masses appear in the frequency domain, as indicated by Eq. (6), a Fourier transform of would enhance the sensitivity to the mass hierarchy. The frequency spectrum can be obtained using the following Fourier sine transform (FST) and Fourier cosine transform (FCT):
| (12) | |||
where is the frequency and is the variable in space, varying from to . Once a finite energy resolution is introduced, the phase difference over is significantly smeared out.
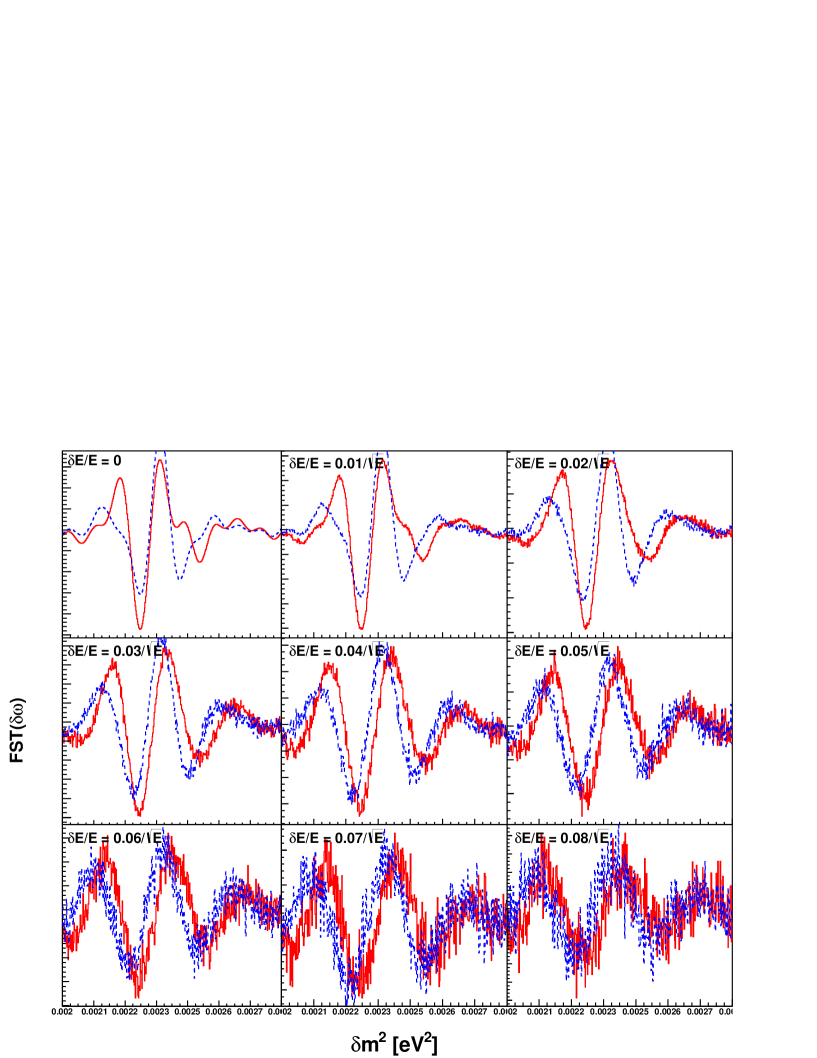
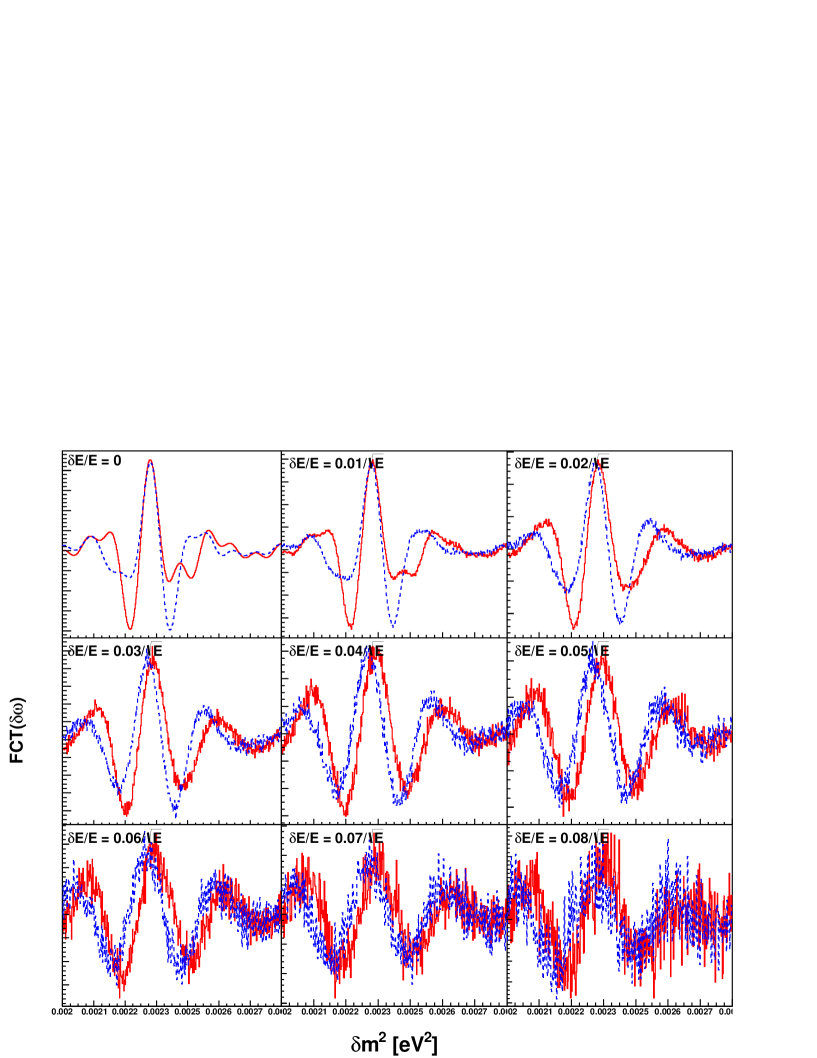
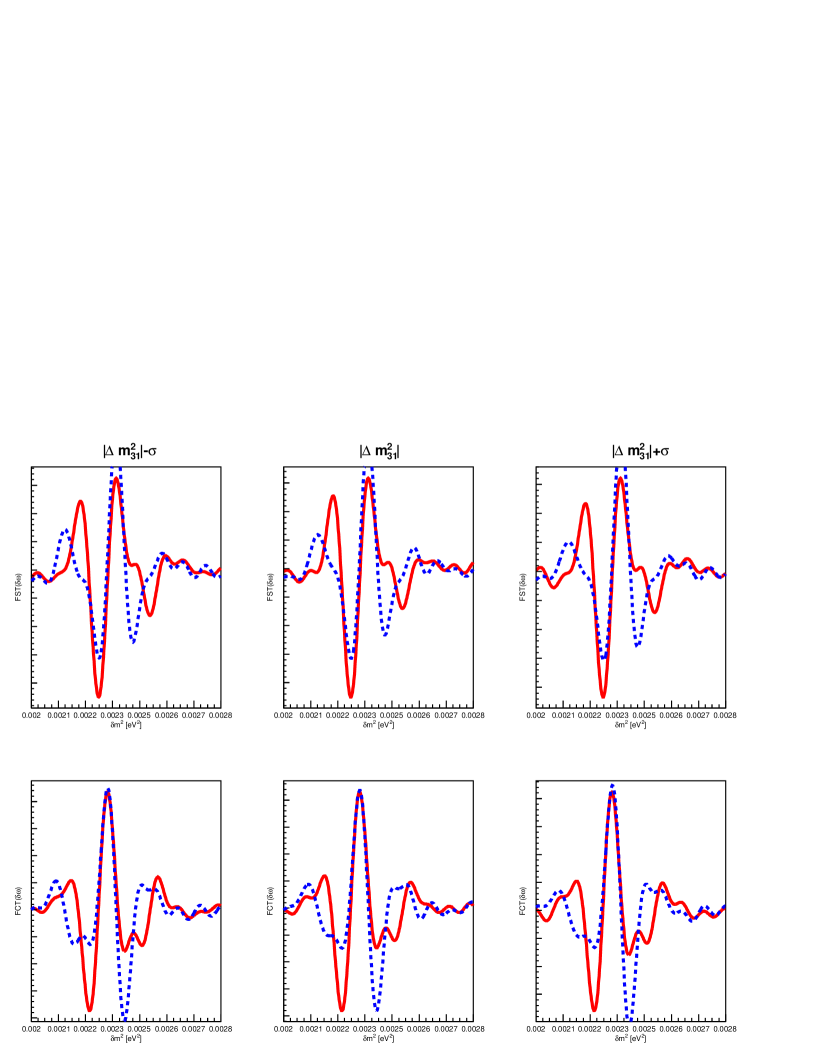
Figures 2 and 3 show FST and FCT spectra obtained through the Monte–Carlo simulation from to 0.028 with energy resolution varied in steps of . The impact of energy resolution is clear because noisy peaks and valleys fluctuate more with increasing magnitude of energy resolution. The main peak and valley are distinctive and can be used to determine the neutrino mass hierarchy while .
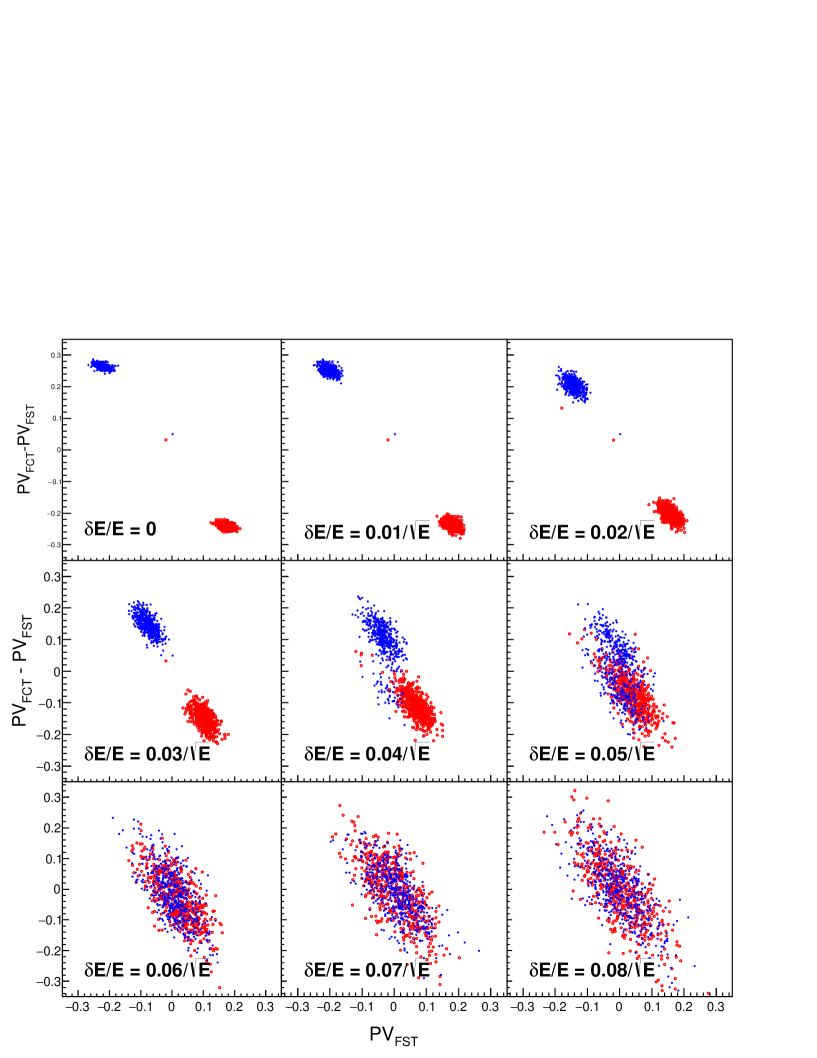
We introduce parameters and to quantify the features of FST and FCT spectra:
| (13) |
and
| (14) |
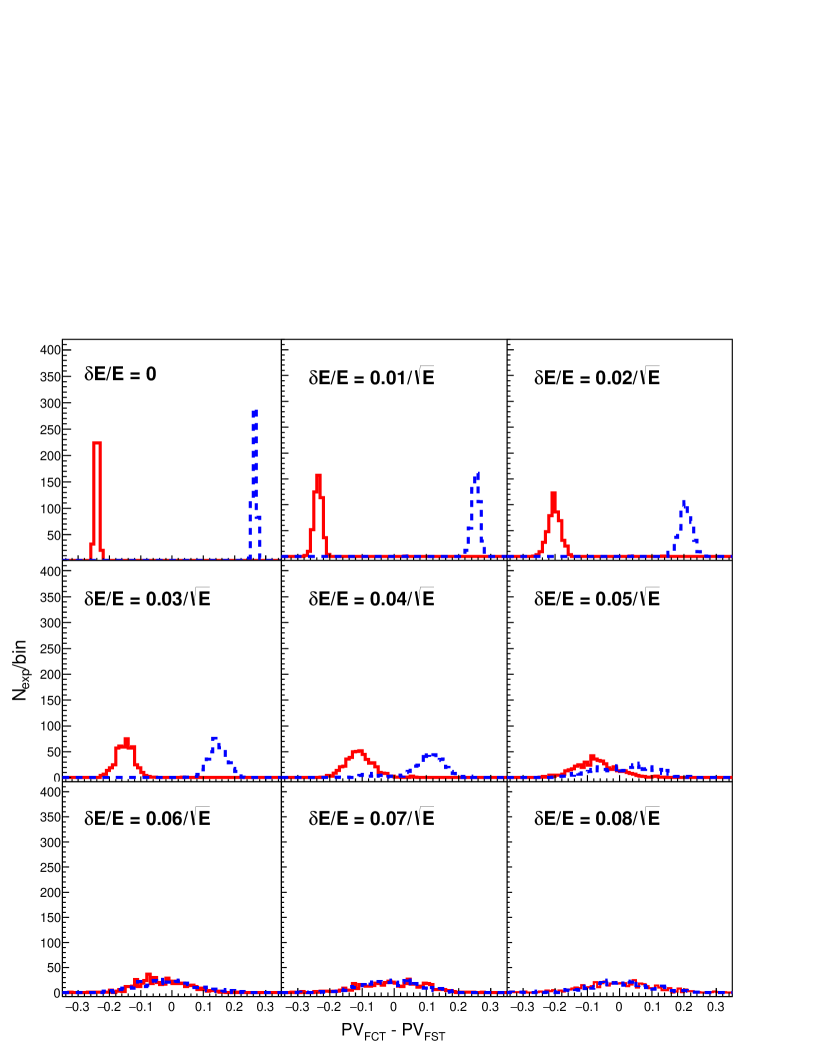
where and are the amplitudes of the peak and valley, respectively, and and are the values of at the peak and valley positions, respectively. Figure 4 shows the distributions of and for 500 experiments at different energy resolutions. Two clusters of points represented by the red open circle (bottom right) and blue solid circle (top left) in the plane of (, ) corresponding to NH and IH cases, respectively, show their own region exactly when . The upper and the lower parts of the scatter plot correspond to IH and NH, respectively. It is shown that the distinctive features of NH and IH cases become smeared out as the energy resolution worsens, as shown in Fig. 5.
At large value of , the uncertainty of has a little effect on the FST and FCT spectra. It comes from the fact that is more effective on narrow modulation in the spectrum than does in the last term of Eq. (6). The effect of the uncertainty of is shown in Fig. 6.
Now we consider a method to discriminate between normal and inverted hierarchy using the information we gathered from an experiment. We will find an experiment on the plane of versus as shown in Fig. 4, if we performed the analysis based on an approach suggested in this paper. The experiment will be placed on the region of NH or IH. Could we assess quantitatively whether the mass hierarchy of neutrino has normal or inverted hierarchy from the point? This is the probability of being NH (IH) given that an experiment happens to be placed on the NH (IH) region: we name it a success probability, . The probability is simply calculated using classical Bayes’ theorem. For example, NH concerned, Bayes’ theorem says,
| (15) |
where is the probability of being NH given that an experiment is found on the NH region, is the probability of being found on the NH reqion given that the hierarchy is NH, is the probability of being NH, and is the probability of being found on the NH region.
The probability that an experiment will remain in its own region could be calculated from many experiments, which is why we need many experiments. According to classical Bayes’ theorem, there are
| (16) |
where is the number of NH (IH) experiments found in the NH (IH) region and is the number of total experiments found in the NH (IH) region. In this approach, 50% probability implies a null result.
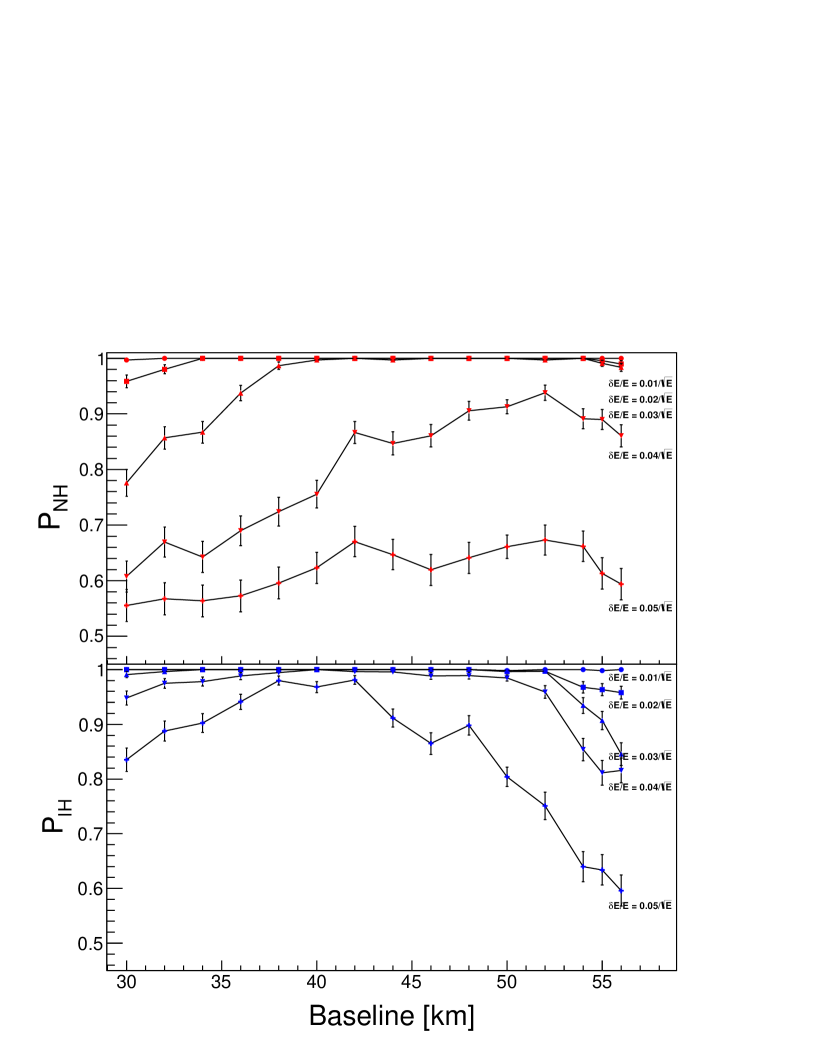
Figure 7 shows and values obtained from the simulated event samples over the baselines at different energy resolutions. We list numerical values of those probabilities acquired from MC samples in Table II. In the case of , is greater than 95% for a baseline of 38–56 . Similarly, is greater than 95% at a baseline of 32–52 when . As we have no preferred basis to determine which hierarchy is correct, we need to introduce a new probability, which shows that an experiment found in a region remains in its correct region as long as the energy resolution is sufficient.
The probability that an experiment will be found in its correct region, namely the determination probability, , is expressed as
| (17) |
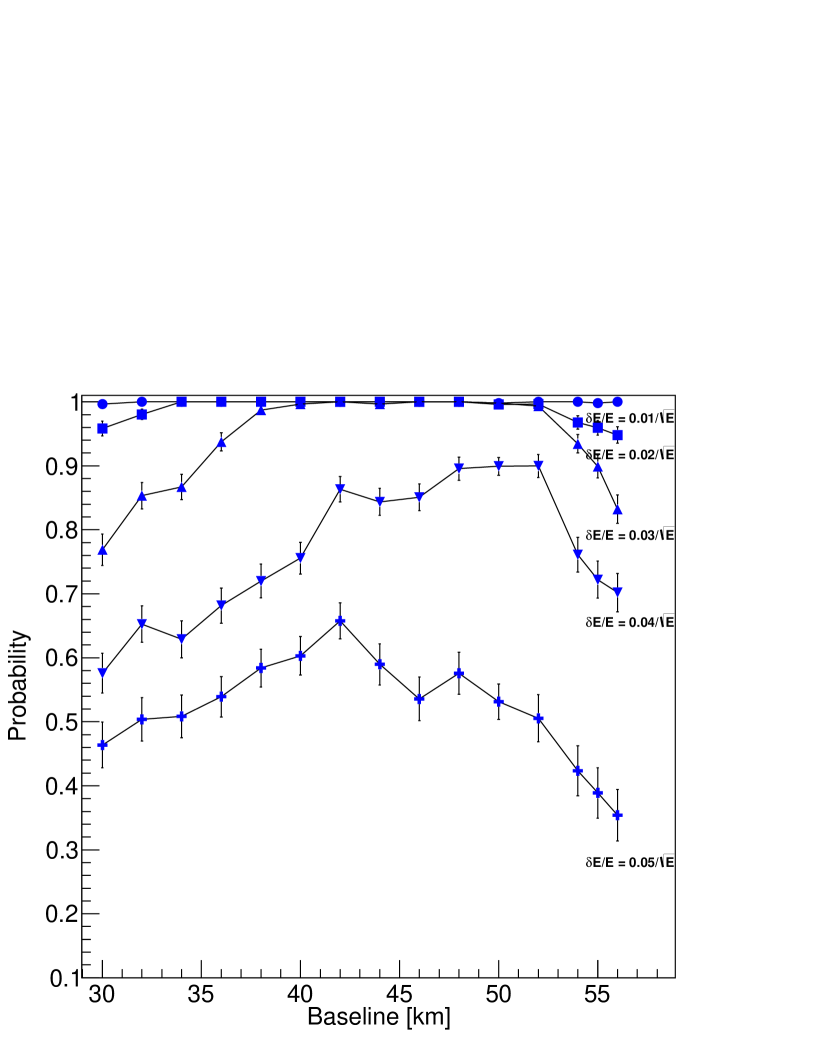
As shown in Fig. 8, has a value of when with a baseline of 40–52 . As the energy resolution worsens, rapidly decreases. When , the baseline is 48–53 at as shown in Table II.
| baseline [km] | a | ||||||
|---|---|---|---|---|---|---|---|
| 30 | 0.776 | 0.024 | 0.991 | 0.006 | 0.769 | 0.025 | |
| 32 | 0.857 | 0.020 | 0.996 | 0.004 | 0.853 | 0.021 | |
| 34 | 0.867 | 0.020 | 1 | 0 | 0.867 | 0.020 | |
| 36 | 0.938 | 0.014 | 1 | 0 | 0.938 | 0.014 | |
| 38 | 0.987 | 0.007 | 1 | 0 | 0.987 | 0.007 | |
| 40 | 0.997 | 0.003 | 1 | 0 | 0.997 | 0.003 | |
| 42 | 0.03 | 1 | 0 | 1 | 0 | 1 | 0 |
| 44 | 0.997 | 0.003 | 1 | 0 | 0.997 | 0.003 | |
| 46 | 1 | 0 | 1 | 0 | 1 | 0 | |
| 48 | 1 | 0 | 1 | 0 | 1 | 0 | |
| 50 | 1 | 0 | 0.998 | 0.002 | 0.998 | 0.002 | |
| 52 | 0.997 | 0.003 | 0.997 | 0.003 | 0.993 | 0.005 | |
| 54 | 1 | 0 | 0.935 | 0.014 | 0.935 | 0.014 | |
| 55 | 0.991 | 0.005 | 0.907 | 0.017 | 0.900 | 0.018 | |
| 56 | 0.984 | 0.007 | 0.846 | 0.021 | 0.832 | 0.022 | |
| 30 | 0.607 | 0.0282 | 0.948 | 0.013 | 0.576 | 0.031 | |
| 32 | 0.670 | 0.027 | 0.975 | 0.009 | 0.653 | 0.029 | |
| 34 | 0.642 | 0.028 | 0.978 | 0.008 | 0.629 | 0.029 | |
| 36 | 0.690 | 0.027 | 0.988 | 0.006 | 0.682 | 0.027 | |
| 38 | 0.724 | 0.026 | 0.995 | 0.004 | 0.720 | 0.026 | |
| 40 | 0.756 | 0.025 | 1.000 | 0.000 | 0.756 | 0.025 | |
| 42 | 0.04 | 0.867 | 0.020 | 0.996 | 0.004 | 0.863 | 0.020 |
| 44 | 0.847 | 0.021 | 0.996 | 0.004 | 0.844 | 0.021 | |
| 46 | 0.861 | 0.020 | 0.989 | 0.006 | 0.851 | 0.021 | |
| 48 | 0.905 | 0.017 | 0.989 | 0.006 | 0.896 | 0.018 | |
| 50 | 0.913 | 0.013 | 0.985 | 0.005 | 0.899 | 0.014 | |
| 52 | 0.938 | 0.014 | 0.959 | 0.011 | 0.900 | 0.018 | |
| 54 | 0.891 | 0.018 | 0.854 | 0.020 | 0.761 | 0.028 | |
| 55 | 0.900 | 0.018 | 0.811 | 0.023 | 0.722 | 0.029 | |
| 56 | 0.861 | 0.020 | 0.816 | 0.022 | 0.702 | 0.030 |
IV Discussion
We have studied the experimental requirements to determine neutrino mass hierarchy using Fourier sine and cosine transform of the reactor neutrino spectrum at . The parameters and were defined to extract features of the Fourier sine and cosine spectra, and the mass hierarchy could be obtained from the determination probability, based on Bayes’ theorem.
Since the effect of varying over its uncertainty has little effect on the FST and FCT spectra at , the is less dependent on the uncertainty of than the value of .
As defined in Eq. (16) and Eq. (17), the probability is closely related to the different features of each mass hierarchy. Each value of indicates the probability that an experiment will be found inside its correct or region on the and planes. These different features from different neutrino mass hierarchies suggest that the analysis method described in this paper, which is a simple and straightforward approach, can be used to determine the neutrino mass hierarchy by using the determination probability based on the Fourier sine and cosine transform of the spectrum.
V Acknowledgements
This work was supported by the National Research Foundation of Korea (NRF-2013R1A1A2011108) and also supported, in part, by the NRF grant No. 2009-0083526.
References
- (1) J. K. Ahn et al., (RENO Collaboration) Phys. Rev. Lett. 108, 191802 (2012).
- (2) F. P. An et al., (Daya Bay Collaboration) Phys. Rev. Lett. 108, 171803 (2012).
- (3) M. Apollonio et al., Phys. Rev. D61, 012001 (2000).
- (4) Ghoshal and S. T. Petcov, JHEP 1103 (2011) 058 [arXiv:1011.1646].
- (5) X. Qian, D. A. Dwyer, R. D. McKeown, P. Vogel, W. Wang and C. Zhang, arXiv:1208.1551 (2012).
- (6) P. Ghoshal and S. T. Petcov, arXiv:1208.6473 (2012).
- (7) Y.-F. Li, J. Cao, Y. Wang and L. Zhan, arXiv:1303.6733 (2013).
- (8) Yoshitaro Takaesu, arXiv:1304.5306 (2013).
- (9) E. Ciuffoli, J. Evslin and X. Zhang, arXiv:1208.1991 (2012).
- (10) E. Ciuffoli, J. Evslin and X. Zhang, arXiv:1209.2227 (2012).
- (11) X. Qian, A. Tan, W. Wang, J. J. Ling, R. D. McKeown and C. Zhang, arXiv:1210.3651 (2012).
- (12) J. Learned, S. T. Dye, S. Pakvasa and R. C. Svoboda, Phys. Rev. D78, 071302 (2008).
- (13) J. Beringer et al., Phys. Rev. D86, 010001 (2012).
- (14) P. Vogel and E. Engel, Phys. Rev. D39, 3378 (1989).
- (15) P. Vogel and J. F. Beacom, Phys. Rev. D60, 053003 (1999).
- (16) P. Huber and T. Schwetz, Phys. Rev. D40, 053011 (2004).