Photoproduction of Mesons off the Proton111CBELSA/TAPS Collaboration
Abstract
The differential cross sections and unpolarized spin-density matrix elements for the reaction were measured using the CBELSA/TAPS experiment for initial photon energies ranging from the reaction threshold to 2.5 GeV. These observables were measured from the radiative decay of the meson, . The cross sections cover the full angular range and show the full extent of the -channel forward rise. The overall shape of the angular distributions in the differential cross sections and unpolarized spin-density matrix elements are in fair agreement with previous data. In addition, for the first time, a beam of linearly-polarized tagged photons in the energy range from 1150 MeV to 1650 MeV was used to extract polarized spin-density matrix elements.
These data were included in the Bonn-Gatchina partial wave analysis (PWA). The dominant contribution to photoproduction near threshold was found to be the partial wave, which is primarily due to the sub-threshold resonance. At higher energies, pomeron-exchange was found to dominate whereas -exchange remained small. These -channel contributions as well as further contributions from nucleon resonances were necessary to describe the entire dataset: the , , and partial waves were also found to contribute significantly.
keywords:
Meson production , Light mesons , Baryon resonances, Photoproduction reactions1 Introduction
The spectrum of excited states has historically given essential information on the nature of any composite quantum system. The careful mapping of the excited states of baryons shines light on the nature of the nonperturbative regime of quantum chromodynamics (QCD). This spectrum specifically depends on the effective degrees of freedom and the forces confining the quarks. Symmetric quark models, which attempt to describe the baryon system, predict the pattern of low-mass baryons reasonably well. However, the predicted baryon states for masses above 1.8 GeV/ greatly outnumber those which have been found experimentally. Most known light-flavor baryon resonances lie below 2 GeV/ and were discovered in elastic scattering experiments. Quark model calculations have shown that many of these so-called “missing” baryons have weak couplings; and moreover, they could strongly couple to and without a small coupling to . In recent years, many laboratories around the world (ELSA, GRAAL, Jefferson Laboratory, MAMI, SPring-8, etc.) have published differential cross sections and polarization observables in photoproduced reactions. For a recent review on baryon resonances, see [1, 2].
According to the predictions of the Constituent Quark Model, e.g. [3], data on photoproduction have a good chance of revealing some of the “missing” baryon resonances. However, since the meson has the same quantum numbers as the incoming photon, meson exchange (-channel) processes are likely to contribute strongly. To disentangle the -channel from the resonant (-channel) amplitude, data with full angular coverage are needed. Of particular importance is the very forward direction where the -channel amplitude has its maximum.
Moreover, the meson acts as an isospin filter for baryon resonances. Since the isospin of the meson is zero, any baryon resonance decaying to must have isospin , and therefore contributions from states are excluded.
In this paper, the differential cross sections and spin-density matrix elements for the reaction
| (1) |
are presented by reconstructing the from the neutral decay,
| (2) |
2 Experimental Setup
The CBELSA/TAPS experiment was conducted at the electron stretcher accelerator (ELSA) facility [4] located at the University of Bonn in Germany. A 3.175 GeV electron beam from ELSA interacted with a radiator target and produced bremsstrahlung photons. The radiator target was situated in a goniometer which contained copper radiators of varying thickness along with a diamond radiator for linear polarization. The unpolarized data utilized a copper radiator of thickness 3/1000 (radiation length). The polarized data used a diamond radiator. The bremsstrahlung electrons were deflected by a dipole magnet into the tagging detector system (tagger). The tagger consisted of 480 scintillating fibers on top of 14 scintillating bar counters which partly overlapped. Using the knowledge of the magnetic field strength and the hit position in the tagger, the energy of each electron was determined and used to tag each bremstrahlung photon with energy and time information.
A fraction of the tagged bremsstrahlung photons continued down the beam line and interacted with the protons in the liquid hydrogen target to produce mesons which decayed to final-state photons. The energy and position of these photons were detected by the crystal modules in the two electromagnetic calorimeters, Crystal Barrel and TAPS. The Crystal Barrel detector, in its configuration during the CBELSA/TAPS experiment of 2002/2003, consisted of 1290 CsI(Tl) crystals, which were read out by photodiodes. The TAPS detector consisted of 528 BaF2 crystals, which were read out by photomultiplier tubes. They formed a hexagonal wall that covered the forward hole left open by the Crystal Barrel detector. Together the Crystal Barrel and TAPS detectors covered more than 98 % of the full solid angle. Protons or any other charged particles were identified by either 5 mm thick plastic scintillators placed in front of each TAPS crystal or by a three layer scintillating fiber detector which closely surrounded the target. For more information on this setup, see [5].
3 Data Analysis
The unpolarized data were recorded in October 2002 and November 2002. The linearly-polarized data were recorded in March and May 2003. The polarized data used a diamond radiator optimized to have a coherent polarization edge at 1350 MeV and 1600 MeV with a polarization maximum of 49% and 39%, respectively. More information on the goniometer and the linear beam polarization can be found in [6]. The ELSA beam energy for the unpolarized runs was 3.175 GeV, but for this analysis, only photons up to 2.55 GeV were used due to the lack of tagger scintillating fibers above this energy. The fibers provided a fine energy resolution and additional timing information. The trigger for these datasets relied on Leading-Edge Discriminator (LED) outputs which signaled if the energy deposit in a group of TAPS crystals was above either a low-energy threshold (LED-low) or a higher-energy threshold (LED-high). Each TAPS crystal belonged to one of eight LED-low sectors and one of eight LED-high sectors. The trigger required either 1) two LED-low sectors in the TAPS detector firing above a low energy threshold or 2) one LED-high sector in TAPS above a higher energy threshold and at least one hit (two hits for the polarized data) in the Crystal Barrel. For sector definitions and more information, see [5, 7]. The same data were used for several previously published analyses on a variety of final states [5, 6, 8, 9, 10, 11, 12, 7, 13, 14].
In order to study Reaction (1), the final state was reconstructed first using kinematic fitting. All events based on three distinct neutral hits and less than two charged hits were subjected to the hypothesis. The yields were then extracted from invariant masses by carefully subtracting the background contribution. The proton was chosen as a missing particle in the fit due to the relatively large uncertainty in reconstructing the proton energy and momentum from calorimeter output. The resulting confidence-level (CL) values from kinematically fitting the data events and Monte Carlo simulated events were used first to reduce background in the analysis. A cut of CL was applied. This very small CL cut simply guaranteed convergence of the kinematic fit, and therefore energy-momentum conservation, but had essentially no impact on the yield. The remaining background events were removed by applying a probabilistic method which is described below. More information on kinematic fitting used at the CBELSA/TAPS experiment can be found in [5].
To isolate the incoming photon, a coincident timing cut between the tagger and TAPS was used to reduce the number of initial photon candidates. The remaining photons were subjected to kinematic fitting, which required energy and momentum conservation. The beam photon with the largest CL value was chosen as the initial photon. An equivalent analysis of events with timing outside of this coincident timing cut was performed and used to eliminate the effect of accidental background.
The contribution of events which were poorly reconstructed as events could be effectively separated from good events by studying the momentum-dependence of the opening angle between the and the final-state bachelor-photon in the center-of-mass frame, . In this two-dimensional distribution, events which satisfied were kept for further analysis. Simulations showed that this cut removed events which caused structures in the background mass and facilitated the modeling of the background.
When a proton interacted with TAPS, the energy deposit was typically smaller than for a photon of the same energy. The TAPS crystal trigger thresholds, LED-low and LED-high, were calibrated for photon triggering and responded much differently for protons. Due to this issue, triggering on low-momentum proton energy deposits was difficult to model correctly and could have caused errors in the detector acceptance correction. Fortunately, the kinematics of the reaction allowed this class of events to be excluded from the analysis without losing angular coverage. All events which had an incident photon energy less than 1600 MeV, a proton reconstructed in TAPS, and no additional photons triggering in TAPS above the LED-high threshold were cut out of both the data and the Monte Carlo events. The initial photon energy requirement was chosen to ensure that only low-momentum protons were discarded. The detector response to high-energy protons was similar to that of photons. For more details on the event selection, please see [15].
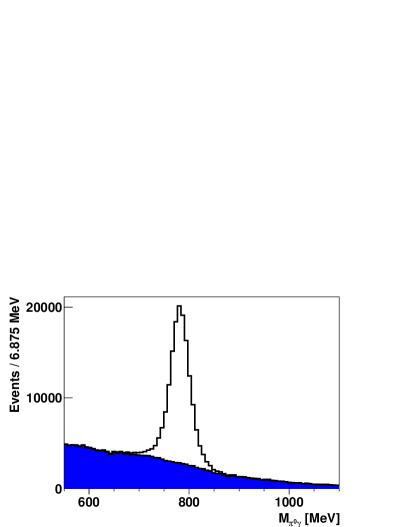
To further remove non- events (background) from the data, a method was applied which assigned a quality factor (Q-factor) to each event. This factor describes the probability for an event to be a event. The Q-factors were then used to weight each event in the analysis when an observable was formed. This method is described in more detail in [16] and its previous application to the CBELSA/TAPS experiment in [7]. Figure 1 shows the resulting separation of signal and background in the total invariant mass distribution. The number of experimentally observed data events was approximately 128,000 in the unpolarized dataset and 60,000 in the polarized combined datasets.
The response of the CBELSA/TAPS experiment was studied with a GEANT3-based Monte Carlo simulation. The response of the Crystal Barrel and TAPS detectors to photons was well reproduced by the Monte Carlo simulations. The acceptance for the events was determined by simulating events which were evenly distributed over the available kinematic phase space. The detector acceptance is defined as the ratio of reconstructed Monte Carlo events to generated Monte Carlo events for each kinematic bin. The tagging and timing of initial state photons were not simulated. The Monte Carlo events were subject to exactly the same reconstruction as the data events from the experiment. The Q-factor method of background subtraction was not applied to the Monte Carlo events which are background-free by construction.
The angular distributions of the decay products of the meson were analyzed to obtain more information about the production mechanisms leading to this final state. For example, the spin-density matrix elements (SDMEs) are a frame-dependent expression of the meson helicity.
The unpolarized SDMEs were extracted by combining the polarized and unpolarized datasets in a fit. They were extracted from the data for each kinematic bin by performing an Extended Maximum Likelihood fit to [17]
where is the unpolarized spin-density matrix, and and are the polar and the azimuthal angle of the bachelor-photon measured in the rest frame of the meson. Acceptance corrections were taken into account in the likelihood function during the fitting. The statistical uncertainties for these data were studied by using a large number of Monte Carlo datasets with varying numbers of events and with the same SDME values. The uncertainty in the fit parameters as a function of the number of events in the dataset was studied and used to define the overall statistical uncertainty for each reported SDME. All SDMEs in this analysis were extracted in the helicity, Gottfried-Jackson, and Adair frames [18].
Polarized SDMEs were extracted from data by combining the two polarized datasets in a fit where each kinematic bin was subjected to a Maximum Likelihood fit to [17, 18]
where is the degree of polarization of the photon beam and is the polarization angle. Statistical uncertainties were estimated in the same manner as for the unpolarized SDMEs. The values of the polarized SDMEs were limited in the fit by the restrictions listed in [18].
For the differential cross sections, the statistical errors were determined from the number of events in each bin. The systematic uncertainties are given as error bands at the bottom of each distribution in Figure 2; the statistical and systematic uncertainties for each data point in Figures 4 and 5 (SDMEs) were added in quadrature. Sources of the systematic uncertainties include kinematic fitting and a possible target shift away from the known position in the Monte Carlo simulation. The corresponding uncertainties were determined by applying different CL cuts as well as varying the target position in the Monte Carlo ( mm [5]) and evaluating changes in the re-extracted observables. The effects were observed to be 1.5 % and 4 % on average, respectively. The errors of the decay branching fractions were negligible. Further contributions include Q-factor fitting errors of 8 % (for details on determining the methodical errors, see [16]), photon flux uncertainties of 10 % for the differential cross sections, and a 5 % degree of polarization uncertainty for the polarized SDMEs. All these errors were then added quadratically to give the total systematic error.
4 Experimental Results
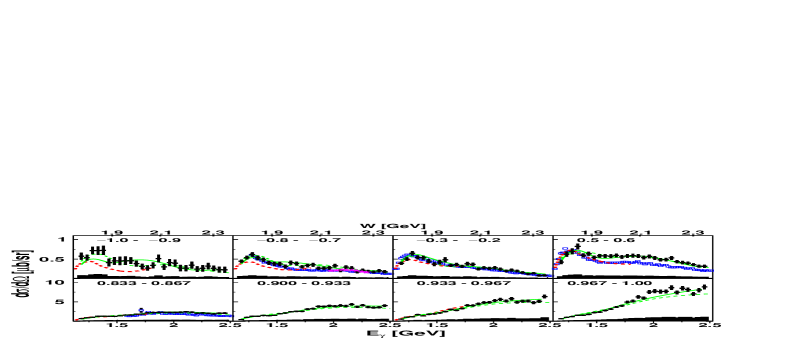
The differential cross sections, , for from this analysis are shown in Figure 2 (black dots) for a few selected angle bins. These serve as representative distributions of the entire dataset. The data are binned in 50 MeV-wide initial photon energy bins from 1.15 GeV to 2.5 GeV. For , the angular bin width is 0.1. To show the forward region’s () strong rise, the bins are 0.033 wide. The vertical error bars on each point are statistical only and the systematic uncertainties, on the order of 15 %, are shown as a black band at the bottom of each distribution. The CLAS [19] and LEPS cross sections [20] are also shown for comparison. The dashed red line represents a calculation within a coupled-channel effective Lagrangian approach in the energy region from the pion threshold up to 2 GeV (Gießen model) [21], which also includes data on -induced reactions. The Gießen group reported a reasonable description of the SAPHIR data [22] in their analysis ([21], Figure 9 therein). Since the SAPHIR data were available only as a function of the mandelstam variable , the Gießen model is shown as a representation of that dataset.
The differential cross sections are reported over the full kinematic phase space, and they can be integrated over to measure the total cross section without any extrapolation. The total cross section in Figure 3 is reported for initial photon energies ranging from 1.15 GeV to 2.5 GeV.
The overall shape of the various experimental distributions is in fair agreement. However, some systematic differences can be seen, in particular in the very backward direction and at higher energies. The earlier results from SAPHIR, as represented by the Gießen model, appear to be systematically lower for than all other results, whereas an almost linear energy-dependent normalization discrepancy is observed between CLAS and CBELSA/TAPS. It is worth noting that older SLAC results [23] at 2.8 GeV exhibit a similar normalization discrepancy with CLAS as do the new data presented here.
It is important to resolve the normalization discrepancy between the results from CBELSA/TAPS and CLAS for a reliable extraction of physics contributions to the cross section. A similar normalization discrepancy has been observed recently between the two experiments for the reaction [5]. The very similar behavior of the discrepancies in both reactions hints again at a normalization issue. Significant efforts have been invested in both collaborations to understand this normalization issue, but the nature of the discrepancy has remained unclear.
The shape of the differential cross sections suggests two dominant processes. The low-energy cross sections are nearly flat and suggest -channel resonance production. The effect of this resonance production can be seen at low energies in the total cross section as a resonant peak. In the higher-energy region, the increase in the cross sections toward indicates that a -channel or meson exchange process contributes strongly. For GeV, any -channel (baryon exchange) contribution must be small due to the lack of any visible peak in the backwards cross section.
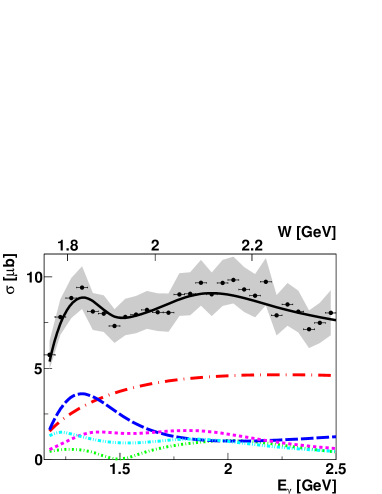
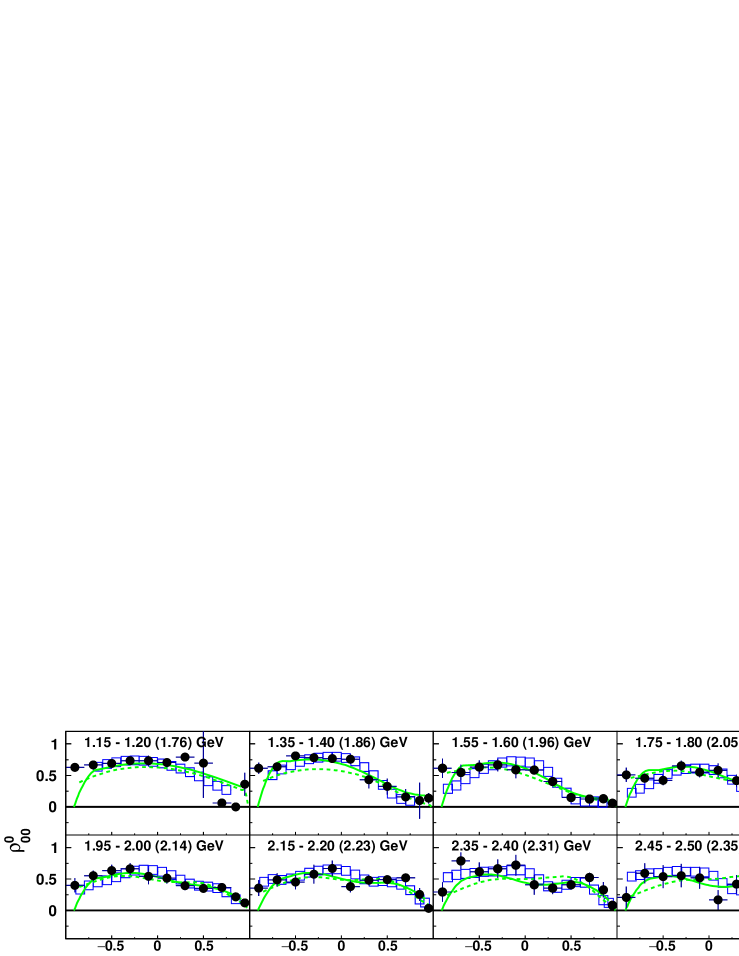

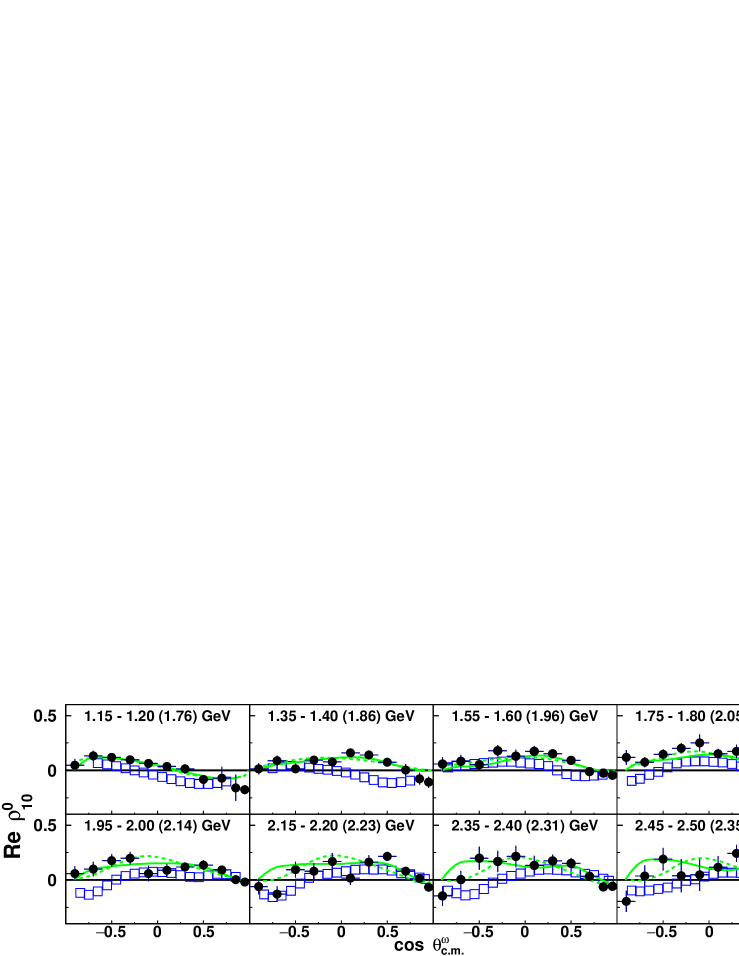
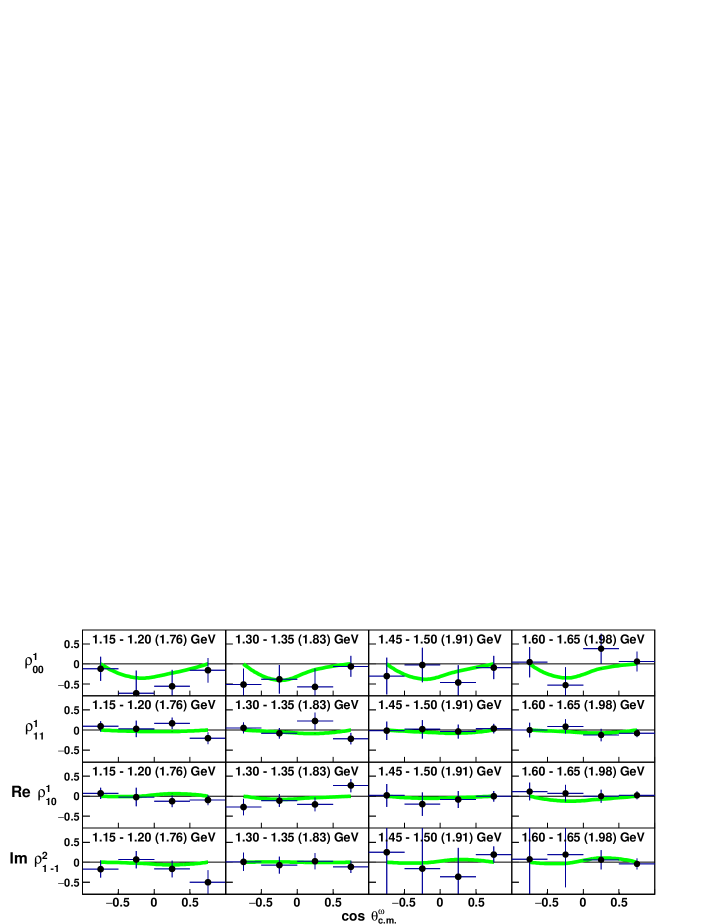
Figure 4 shows representative distributions in the Adair frame, unpolarized SDMEs from this analysis () extracted from the meson’s radiative decay along with the data published by the CLAS collaboration () in [19] extracted from the meson’s decay. These data have 11 angular bins with an energy binning identical to the differential cross sections already shown. The comparison of these datasets for the SDME shows very good agreement in contrast to the normalization discrepancy in the differential cross sections. The extraction of SDMEs does not depend on the absolute normalization. Some differences were found in the SDME and to a smaller extent, mostly at higher energies, in . Since the data agree in , these differences seem to be related to the kinematic variable in Equation 3. However, little impact on the results of the partial wave analysis (PWA) was observed since the and values are very small.
Four of the six polarized SDMEs measured in the Adair coordinate system are shown in Figure 5 for selected energy bins. These data have four bins and the same binning as the above unpolarized data. With the exception of , the values of the polarized SDMEs above 1.4 GeV in photon energy extracted in the Adair frame are very small and seem to be consistent with zero within our statistical uncertainties.
5 Partial Wave Analysis
Owing to the broad and overlapping nature of baryon resonances, amplitude analyses or PWAs need to be performed to extract parameters from the data. The situation is particularly complicated above the region. Many open channels need to be considered and any reliable extraction of resonance properties must be based on a coupled-channel approach. While several groups have significantly contributed to our understanding of baryon resonances, a comprehensive PWA based on a larger database of observables has been performed only at very few institutions. The photoproduction data in most channels still suffer from an insufficient number of observables with good precision. For this reason, different groups have made different claims about which resonances are important and in which regions and for which processes. However, an improved understanding of these different solutions has been clearly observed in recent years due to an increasing database of high-quality measurements from current facilities. This section describes the results of a PWA in the framework of the Bonn-Gatchina (BnGa) coupled-channel approach [24] that includes the data presented here.
The differential cross section has a strong peak in the forward direction; and therefore, a large contribution from -channel exchange amplitudes is expected at higher energies. An initial fit with only two -channel amplitudes defined by the reggezied pomeron- and -exchange described the forward peak fairly well but failed to reproduce the entire angular range. This fit returned very small and almost flat angular distributions for all three unpolarized SDMEs, and it also failed to reproduce the polarization observables. Contributions from nucleon resonances are a necessary additional ingredient to describe the data.
The new data were added to the BnGa database which already included a large set of data on pion- and photo-induced meson production reactions, with up to two pseudoscalar mesons in the final state [25]. In a first attempt at extracting resonance contributions from this analysis, additional CBELSA/TAPS polarization observables were included [13, 26] in the PWA and all photo-nucleon and pseudoscalar meson-nucleon couplings from the previous BnGa solution (BG2014-02) [27] were fixed. Only the couplings of the nucleon states and -channel exchange amplitudes were fitted. More than 100 fits were tested for different initial conditions.
The elements of the density matrix are connected to one another by the production amplitudes. The SDMEs, in particular , were therefore essential to describe the contributions from nucleon resonances. Moreover, the inclusion of the polarized SDMEs allowed the study of the production process in more detail and helped separate the natural and unnatural parity-exchange contributions. In this analysis, it was possible to distinguish between pomeron- (natural) and -exchange (unnatural), which is a clear advantage over previous approaches.
Figure 2 shows the description of the differential cross sections; the solid line represents the best solution. The description of the total cross section and the contribution of the five largest amplitudes for the best solution are shown in Figure 3. The pomeron-exchange amplitude provides the largest contribution; it dominates the total cross section in the high-mass region. The -exchange contributes much less than the pomeron-exchange. Moreover, its contribution was found to be unstable; it varied in different solutions from 5 % to 30 % depending on the behavior of the form factors. The description of the unpolarized SDMEs and polarized SDMEs is shown in Figure 4 and Figure 5, respectively. A discussion of the CBELSA/TAPS double-polarization observables included in this analysis and their description can be found in [26].
At low energies, the is the leading resonant partial wave and shows a strong peak with a maximum around GeV. Such a behavior is identified with a strong coupling of the state which is situated just below the reaction threshold. This state decays into the channel with orbital angular momentum , therefore a large contribution near threshold came as a surprise. The contributions from the and partial waves are notably smaller, in spite of the fact that the channel can couple to these partial waves with . The wave has a more complex structure and hints for at least one more resonance around GeV were found. Fitting without the wave significantly deteriorated the description of the data, particularly of the beam asymmetry (not shown here) and of the SDME . The dashed (green) line in Figures 2 and 4 shows the PWA solution without the partial wave included.
The contribution from the partial wave has two maxima: one at GeV and a second around GeV. This structure is identified with the contributions from the two states, and . The partial wave has a maximum close to the threshold region which is identified with the tail from the two lowest states and a minimum due to the destructive interference with the state. The PWA also found a notable contribution from the partial wave. This wave has some structure close to the threshold and also around GeV; the latter is identified with the state. The contributions from the , and partial waves appeared to be smaller. In all fits, they were found to be less than 5 %. However, the partial waves play an important role in the description of the density matrices at masses above 2.1 GeV. They produced particular structures in the and angular distributions.
A recent CLAS PWA [28] also observed a partial wave around 2 GeV and a resonance contribution above 2.1 GeV, which was identified as . The dominant -channel exchange amplitude was found to be -exchange; and were reported as the dominant waves at threshold. The authors also observed a significant amplitude but did not claim resonance contributions. This partial wave appeared to be inconsistent with a single resonance. This is compatible with the BnGa solution. It must be noted that the CLAS PWA was a single-channel analysis and did not include polarization observables. In the BnGa PWA, the multichannel approach provided signifcant constraints. The -channel amplitude was identified by the polarized SDMEs and the additional polarization data [13, 26] were important to identify clear fit minima.
In utilizing linearly-polarized photons, vector-meson photoproduction is defined by six density matrix elements , , , , , , defined in Equations (3)-(3). For example, the photoproduction beam asymmetry is expressed through density matrices as [18]
| (7) |
Therefore, the observable alone only provides one angular distribution in contrast to the full dataset of six observables mentioned above.
The final fit of the full datasets with free photo- and meson-nucleon couplings did not significantly change the description of the reaction. Therefore, the present photoproduction data are compatible with previous fits to pseudoscalar meson photoproduction data. However, a good description of the new high-energy data required a contribution from at least one new state. The available datasets do not allow to unambiguously determine the quantum numbers; the hypothesis of a , , , or partial wave with a mass around 2.2 GeV leads to comparable data dscriptions. More polarization data are needed at these higher energies to define this state.
In the bin in Figure 2, a small discrepancy between the data and the best solution can be seen. It is assumed that the deviation is caused by the -channel exchange of a higher-mass meson. It should not greatly affect the identification of contributing resonances.
6 Summary
The differential cross sections and spin-density matrix elements detected in the meson’s radiative decay measured at the CBELSA/TAPS experiment have been presented. The experimentally measured events were obtained by irradiating a liquid hydrogen target with tagged photons ranging in energy from threshold up to 2.5 GeV. The measured cross sections presented here seem to be systematically higher than some previous measurements. This indicates a normalization discrepancy in particular between CBELSA/TAPS and CLAS. The spin-density matrix element, , agrees well with the CLAS measurement and further suggests that the cross section discrepancy is related to an unknown issue with the absolute normalization, either at CLAS or CBELSA/TAPS.
The BnGa PWA solution indicated that the dominant contributions to the cross section near threshold were the sub-threshold resonance as well as the and partial waves. Toward higher energies, the -channel contributions increased in strength. They were defined by a dominant pomeron-exchange and a smaller -exchange. In addition to the -channel amplitude, further contributions from nucleon resonances were required to describe the data. The , , and partial waves showed significant contributions to the PWA solution. The wave was defined by two sub-threshold resonances interfering destructively with the resonance. The and resonances created the two-peak structure seen in the partial wave in Figure 3. The partial wave had sub-threshold contributions along with the resonance. In addition, at least one previously unseen higher-mass resonance above 2 GeV was needed to describe the data.
Acknowledgements
We thank the technical staff at ELSA and at all the participating institutions for their contributions to the success of this experiment and this analysis. Financial support is acknowledged from the Deutsche Forschungsgemeinschaft (DFG) within the SFB/TR16 and from the Schweizerischer Nationalfonds. The presented results are partly based upon work supported by the U.S. National Science Foundation under contract 0456463 and 0754674.
References
- [1] E. Klempt and J.-M. Richard, Rev. Mod. Phys. 82, 1095 (2010).
- [2] V. Crede and W. Roberts, Rept. Prog. Phys. 76, 076301 (2013).
- [3] S. Capstick and W. Roberts, Phys. Rev. D 49, 4570 (1994).
- [4] W. Hillert, Eur. Phys. J. A 28S1, 139 (2006).
- [5] V. Crede et al. [CBELSA/TAPS Collaboration], Phys. Rev. C 80, 055202 (2009).
- [6] D. Elsner et al. [CBELSA/TAPS Collaboration], Eur. Phys. J. A 39, 373 (2009).
- [7] N. Sparks et al. [CBELSA/TAPS Collaboration], Phys. Rev. C 81, 065210 (2010).
- [8] V. Crede et al. [CBELSA/TAPS Collaboration], Phys. Rev. C 84, 055203 (2011).
- [9] M. Nanova et al. [CBELSA/TAPS Collaboration], Eur. Phys. J. A 35, 333 (2008).
- [10] R. Ewald et al. [CBELSA/TAPS Collaboration], Phys. Lett. B 713, 180 (2012).
- [11] R. Castelijns et al. [CBELSA/TAPS Collaboration], Eur. Phys. J. A 35, 39 (2008).
- [12] E. Gutz et al. [CBELSA/TAPS Collaboration], Phys. Lett. B 687, 11 (2010); Eur. Phys. J. A 50, 74 (2014).
- [13] F. Klein et al. [CBELSA/TAPS Collaboration], Phys. Rev. D 78, 117101 (2008).
- [14] D. Elsner et al. [CBELSA/TAPS Collaboration], Eur. Phys. J. A 33, 147 (2007).
- [15] A. Wilson, Ph.D. Dissertation, Florida State University (2013).
- [16] M. Williams et al., JINST 4, P10003 (2009).
- [17] Q. Zhao et al., Phys. Rev. C 71, 054004 (2005).
- [18] K. Schilling, P. Seyboth and G. E. Wolf, Nucl. Phys. B 15, 397 (1970) [Erratum-ibid. B 18, 332 (1970)].
- [19] M. Williams et al. [CLAS Collaboration], Phys. Rev. C 80, 045213 (2009).
- [20] M. Sumihama et al. [LEPS Collaboration], Phys. Rev. C 80, 052201 (2009).
- [21] V. Shklyar, H. Lenske, U. Mosel and G. Penner, Phys. Rev. C 71, 055206 (2005) [Erratum-ibid. C 72, 019903 (2005)].
- [22] J. Barth et al. [SAPHIR Collaboration], Eur. Phys. J. A 18, 117 (2003).
- [23] J. Ballam et al., Phys. Rev. D 7, 3150 (1973).
- [24] A. Anisovich et al., Eur. Phys. J. A 24, 111 (2005).
- [25] A. V. Anisovich et al. Eur. Phys. J. A 48, 15 (2012).
- [26] H. Eberhardt et al. [CBELSA/TAPS Collaboration], arXiv:1504.02221 [nucl-ex].
- [27] V. Sokhoyan et al. [CBELSA/TAPS Collaboration], arXiv:1507.02488 [nucl-ex].
- [28] M. Williams et al. [CLAS Collaboration], Phys. Rev. C 80, 065209 (2009).