Identification of drug resistance mutations in HIV from constraints on natural evolution
Abstract
Human immunodeficiency virus (HIV) evolves with extraordinary rapidity. However, its evolution is constrained by interactions between mutations in its fitness landscape. Here we show that an Ising model describing these interactions, inferred from sequence data obtained prior to the use of antiretroviral drugs, can be used to identify clinically significant sites of resistance mutations. Successful predictions of the resistance sites indicate progress in the development of successful models of real viral evolution at the single residue level, and suggest that our approach may be applied to help design new therapies that are less prone to failure even where resistance data is not yet available.
Under selective pressure from sub-optimal anti-retroviral treatment regimens, HIV has been observed to evolve drug resistance within weeks of treatment initiation (Molla et al., 1996). While modern combination therapies have greatly reduced the rate of evolution of drug resistance, resistant strains are found in greater than 14% of newly infected patients in the United States (Volberding and Deeks, 2010; Wheeler et al., 2010). The rapid evolution of resistance is congruent with the overall observation that HIV evolution is remarkably fast, with studies indicating that in the absence of treatment a single patient’s HIV infection will explore every possible point mutation many times daily (Rambaut et al., 2004; Coffin, 1995; Perelson et al., 1996). However, empirical studies of viral sequence data indicate that HIV evolution is structured and exhibits reproducible patterns (Molla et al., 1996; Dahirel et al., 2011).
The existence of significant correlations in the evolution of HIV suggests that sequence data can be used to parameterize statistical mechanical models of HIV evolution that predict important features of its evolution, including the evolution of drug resistance. Previous researchers have used a variety of approaches to predict HIV fitness and aspects of its evolution using viral sequence data on its own (Dahirel et al., 2011; Ferguson et al., 2013), and with additional phenotypic properties such as drug resistance and replicative capacity (Hinkley et al., 2011). Others have addressed the problem of predicting the sites of drug resistance mutations by detecting sites under positive selection during treatment (Chen et al., 2004), supervised learning (Cao et al., 2005), and structural modeling of protein-drug interactions (Cao et al., 2005; Beerenwinkel et al., 2002).
Here we use HIV sequence data, obtained prior to the widespread clinical use of protease inhibitors, to parameterize a spin representation of the standard Eigen model of quasi-species evolution (Eigen, 1971; Leuthäusser, 1986; Shekhar et al., 2013). We then use this model to predict sets of sites in HIV protease where joint mutations are unlikely to significantly impair viral fitness. We hypothesize that such sites are more likely to be sites of clinically relevant drug resistance mutations because resistance mutations that severely impair viral replication are unlikely to be selected. Our successful identification of major drug resistance sites (defined in (Rhee et al., 2003)) using natural evolution data suggests that our techniques could be applied to predict HIV evolution in response to new treatment regimens or vaccine candidates when resistance information is unknown.
We begin by inferring an estimate of the probability distribution of mutations in the viral protease from sequence data. Protease amino acid sequences are first translated into a binary form, with the amino acid at each site encoded by , where 0 (1) denotes a wild type (mutant) amino acid at that site. Full sequences are thus represented as vectors . We assume that the joint distribution of mutations is adequately captured by the moments and find the maximum entropy distribution consistent with the observed moments (note that because , all first moments are included) (Jaynes, 1957; Ferguson et al., 2013). The resulting probability distribution takes the form
| (1) |
where is the partition function. The parameters , must be chosen such that the distribution reproduces the observed moments . Here the can be thought of as capturing direct interactions between sites, disentangled from the network of correlations that include indirect effects mediated through intermediate sites (Cocco and Monasson, 2011; Morcos et al., 2011; Schneidman et al., 2006). Similar maximum entropy approaches have been fruitfully applied to analyze patterns of neural activity and to predict contact residues in protein families (Schneidman et al., 2006; Weigt et al., 2009; Morcos et al., 2011; Marks et al., 2012). The description of the selective cluster expansion algorithm used to infer is given in (Cocco and Monasson, 2011; Barton and Cocco, 2013). Although only the pair correlations are constrained in Eq. 1, the inferred Ising model accurately predicts higher order correlations as well.
The form of the probability distribution gives rise to the notion of a “prevalence landscape” that expresses the relative frequencies of protease sequences. Previous work has shown that the inferred prevalences of sequences from HIV Gag proteins correlate with their replicative capacities, another proxy for fitness (Ferguson et al., 2013; Mann et al., 2014), in line with the intuition that fitter strains should be more prevalent. However, prevalence is affected by many factors other than fitness, including epidemiological dynamics, recombination, and demographic noise, which complicate this association (Grenfell et al., 2004; Lemey et al., 2006; Neher and Leitner, 2010).
Insight into the relation between fitness and prevalence can be obtained through Eigen’s model of evolution (Eigen, 1971). This model assumes an infinite population of viruses, and accounts for mutation and selection, but neglects many of the important effects described above. However, these simplifications allow for the relationship between fitness and prevalence to be studied using methods adopted from statistical physics (Leuthäusser, 1986; Shekhar et al., 2013). Following Eigen’s model, the prevalence can also be written as the outcome of evolutionary dynamics over a large number of generations , represented as a series of coupled Ising spin systems (Leuthäusser, 1986)
| (2) |
where is related to the per site per generation mutation rate by . Here is minus the log fitness of sequence and will be referred to as the fitness landscape. The superscripts on the sequence vectors refer to discrete generations. The superscript on the parameters and indicates that these parameters are taken from the fitness landscape in Eq. 2 (assumed to have the same functional form as Eq. 1), rather than the prevalence landscape of Eq. 1. The evolutionary dynamics described here applies to evolution within a population of hosts. Equations describing within host evolution would require accounting for differing immune pressure between individuals (Shekhar et al., 2013), though protease is not comparatively immunogenic (Bartha et al., 2013).
Ideally, one would like to invert Eq. 2 to solve for in terms of , because is inferred directly from data. In principle, this could be achieved by matching the distribution of sequences at the final generation in the Ising representation of Eigen’s model with the prevalence landscape, given by Eq. 1. This is a challenging problem in general, however, approximate results can be obtained by studying a two site system, which can be solved by straightforward transfer matrix methods. While network effects influence the inferred couplings between sites, this simple approximation provides useful intuition. Furthermore, network effects exert a weaker influence on the , as most of their variance is explained by the single site in Eq. 1.
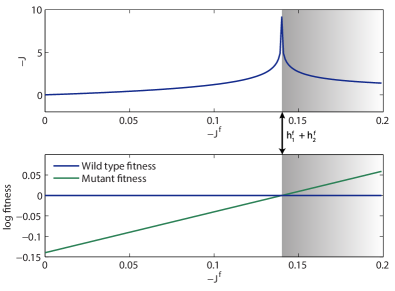
Solving the two site version of Eq. 2 shows that the are difficult to reliably infer, because the mutation coupling is large enough ( and ) that very small lead to large in the prevalence landscape. However, large values of in the prevalence landscape have a simple interpretation in the fitness landscape as couplings between pairs of sites where mutating both sites leads to only a small change in fitness compared to wild type (Fig. 1). In this case the double mutant could become advantageous with only a small increase in the fitness of one of the mutations, as might occur when drugs are added to the environment, for example. Mathematically, this occurs as approaches . We refer to the point in parameter space where the coupling between sites allows the double mutant strain to have equal fitness to the wild type as a level crossing.
To go from the interpretation of large values of in the prevalence landscape as indicators of nearby level crossings to predictions of resistance mutations requires elucidating a relationship between level crossings and resistance mutations. A rigorous argument relating resistance mutations to the fitness landscape would require detailed knowledge of the drug, its binding sites, the structure of the target protein, and other details. However, generically we expect that when the environment in which HIV replicates changes due to the initiation of drug therapy, HIV must mutate in ways that abrogate drug binding, while at the same time preserving protein function. Large couplings connect sites that are likely to be able to co-mutate with limited costs to fitness, even if the associated individual mutations are costly. Such sets of sites are therefore more likely to be associated with resistance. Here our assumption is that resistance cannot be achieved through selectively neutral mutations at single sites, in which case drug treatment would likely be ineffective.
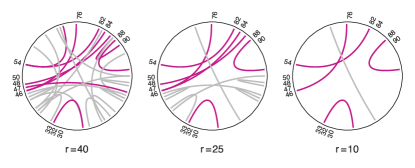
To predict the sites of resistance mutations based on the above considerations, we consider the strongest couplings associated with each site . Using the largest coupling values we then assign each site a rank from strongest to weakest. We predict that the sites with the strongest interactions (i.e. the highest ranked sites) are most likely to be associated with drug resistance. Focusing on the highest ranked sites, and the strong couplings between them, can be seen as a process of pruning weaker interactions from the network. Three pruned versions of the network of mutational interactions in HIV protease are shown in Fig. 2.
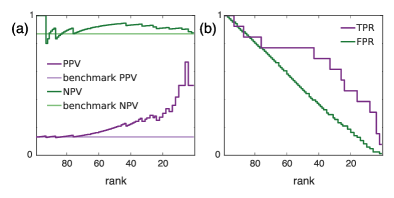
This model can be cast in the form of a classification rule by predicting sites ranked at or above some threshold rank to be sites of drug resistance mutations, and sites of lower rank to be unassociated with resistance. To test the model’s performance, we take the set of resistance sites to be those classified as sites of major resistance mutations by the Stanford HIV drug resistance database (sites 30, 32, 33, 46, 47, 48, 50, 54, 76, 82, 84, 88, and 90) (Rhee et al., 2003). As higher ranked sites are selected, the proportion of sites that are associated with resistance should increase. This can be measured using positive prediction value (PPV) and negative prediction value (NPV), defined as
These are shown in Fig. 3 compared to benchmarks for a random classifier, and demonstrate that the performance of the classification rule is substantially better than chance for higher ranked sites. Examination of the true positive rate (TPR) and false positive rate (FPR),
shown in Fig. 3, confirm that TPRFPR, indicating performance better than chance. We also note that the fraction of the strongest interactions which link at least one major drug resistance site is extremely high, as can be seen in Fig. 2 (further details in Supplemental Material).
To examine these results using classical statistical significance testing, we used the hyper-geometric distribution to compute p-values for the null model of randomly selecting the number of sites at or above each rank threshold and obtaining at least as many resistance mutations as found using the ranking classifier. The predictions have p-values for essentially all rank thresholds from , which comports with the argument that strongly coupled sites are more likely to be sites of resistance mutations and supports the significance of the predictions of resistance among higher ranked sites. The lack of significance for the highest ranked pair is a consequence of the very small number of sites. We also tested related classification rules constructed using direct information (Morcos et al., 2011) and correlation matrices, with no improvement in performance (Supplemental Material).
As virological failure occurs in patients undergoing treatment with protease inhibitors, new protease inhibitor drugs are administered (Volberding and Deeks, 2010). To further assess the validity of our predictions, we used the model to infer pairs of protease inhibitors that are optimized to protect patients from evolving multi-drug resistance. To protect against resistance, a pair of drugs should have as many non-overlapping resistance mutations as possible. Additionally, the drugs’ associated resistance mutations should be difficult to make simultaneously due to fitness constraints. In the same way that large positive values of indicate sites that can readily mutate together, negative values of indicate sites where double mutations are suppressed. Thus, the interactions between the resistance mutations that are not common to both drugs should be as negative as possible. We found three combinations (atazanivir-indinavir, atazanavir-fosamprenavir, and darunavir-nelfanavir) that are optimal for both of these criteria in the Pareto sense: improvement in one criterion necessitates a reduction in the other criterion. Two of these, along with both near-optimal pairs (atazanavir-darunavir and atazanavir-lopinavir), incorporate atazanavir, consistent with clinical knowledge that the resistance profile of atazanavir appears distinct from other protease inhibitors (Colonno et al., 2004).
The network of large interactions also captures important biophysical information. As a first example, the third strongest coupling is between sites 82 and 54. Site 82 is frequently the first resistance mutation site observed after the initiation of protease inhibitor treatment, and is usually followed by mutation at site 54 (Molla et al., 1996). Some couplings may also be associated with stabilizing mutations, which compensate for loss of fitness due to a destabilizing mutation. A recent biophysical study examined the melting temperatures of HIV protease with a major resistance mutation at site 84 (Chang and Torbett, 2011). The study showed that on its own, the major resistance mutation reduced the stability of HIV protease considerably. When the mutation at site 84 is accompanied by one of a set of three known accessory mutations at sites 10, 63, and 71, stability is restored, or even enhanced. Couplings between sites 10 and 84, and sites 63 and 84, are strong, in the top 7% of all couplings (though weaker than the couplings shown in Fig. 2, which are within the top 1%). The coupling between sites 71 and 84 is slightly weaker, but still in the top 13% of all couplings. This suggests that links between destabilizing mutations and those that improve protein stability may be captured by the network of interactions inferred from sequence data.
Our results show that from sequence information alone, much of the evolutionary response of HIV protease to inhibitors can be reproduced. While in the case of protease inhibitors, the answer was known, the successful retrodictions indicate that our understanding of HIV evolution is becoming predictive at the level of individual residue sites. We anticipate that the methods developed above will contribute to the development of predictive theories of viral evolution and to the development of new treatments, such as integrase inhibitors (Pommier et al., 2005), where resistance is not nearly as well characterized as in protease.
We thank Daniel Kuritzkes, Martin Hirsch, Andrew Ferguson, Dariusz Murakowski, and Hanrong Chen for helpful discussions. This research was funded by the Ragon Institute of MGH, MIT, & Harvard, and NSF under Grants No. PHY11-25915 and DMR-12-06323.
References
- Molla et al. (1996) A. Molla, M. Korneyeva, Q. Gao, S. Vasavanonda, P. J. Schipper, H.-M. Mo, M. Markowitz, T. Chernyavskiy, P. Niu, N. Lyons, et al., Nature Medicine 2, 760 (1996).
- Volberding and Deeks (2010) P. A. Volberding and S. G. Deeks, The Lancet 376, 49 (2010).
- Wheeler et al. (2010) W. H. Wheeler, R. A. Ziebell, H. Zabina, D. Pieniazek, J. Prejean, U. R. Bodnar, K. C. Mahle, W. Heneine, J. A. Johnson, H. I. Hall, et al., AIDS 24, 1203 (2010).
- Rambaut et al. (2004) A. Rambaut, D. Posada, K. A. Crandall, and E. C. Holmes, Nature Reviews Genetics 5, 52 (2004).
- Coffin (1995) J. M. Coffin, Science 267, 483 (1995).
- Perelson et al. (1996) A. S. Perelson, A. U. Neumann, M. Markowitz, J. M. Leonard, and D. D. Ho, Science 271, 1582 (1996).
- Dahirel et al. (2011) V. Dahirel, K. Shekhar, F. Pereyra, T. Miura, M. Artyomov, S. Talsania, T. M. Allen, M. Altfeld, M. Carrington, D. J. Irvine, et al., Proceedings of the National Academy of Sciences 108, 11530 (2011).
- Ferguson et al. (2013) A. L. Ferguson, J. K. Mann, S. Omarjee, T. Ndungu, B. D. Walker, and A. K. Chakraborty, Immunity 38, 606 (2013).
- Hinkley et al. (2011) T. Hinkley, J. Martins, C. Chappey, M. Haddad, E. Stawiski, J. M. Whitcomb, C. J. Petropoulos, and S. Bonhoeffer, Nature Genetics 43, 487 (2011).
- Chen et al. (2004) L. Chen, A. Perlina, and C. J. Lee, Journal of Virology 78, 3722 (2004).
- Cao et al. (2005) Z. W. Cao, L. Y. Han, C. J. Zheng, Z. L. Ji, X. Chen, H. H. Lin, and Y. Z. Chen, Drug Discovery Today 10, 521 (2005).
- Beerenwinkel et al. (2002) N. Beerenwinkel, B. Schmidt, H. Walter, R. Kaiser, T. Lengauer, D. Hoffmann, K. Korn, and J. Selbig, Proceedings of the National Academy of Sciences 99, 8271 (2002).
- Eigen (1971) M. Eigen, Naturwissenschaften 58, 465 (1971).
- Leuthäusser (1986) I. Leuthäusser, The Journal of Chemical Physics 84, 1884 (1986).
- Shekhar et al. (2013) K. Shekhar, C. F. Ruberman, A. L. Ferguson, J. P. Barton, M. Kardar, and A. K. Chakraborty, Physical review E 88, 062705 (2013).
- Rhee et al. (2003) S.-Y. Rhee, M. J. Gonzales, R. Kantor, B. J. Betts, J. Ravela, and R. W. Shafer, Nucleic Acids Research 31, 298 (2003).
- Jaynes (1957) E. T. Jaynes, Physical Review 106, 620 (1957).
- Cocco and Monasson (2011) S. Cocco and R. Monasson, Physical Review Letters 106, 090601 (2011).
- Morcos et al. (2011) F. Morcos, A. Pagnani, B. Lunt, A. Bertolino, D. S. Marks, C. Sander, R. Zecchina, J. N. Onuchic, T. Hwa, and M. Weigt, Proceedings of the National Academy of Sciences 108, E1293 (2011).
- Schneidman et al. (2006) E. Schneidman, M. J. Berry, R. Segev, and W. Bialek, Nature 440, 1007 (2006).
- Weigt et al. (2009) M. Weigt, R. A. White, H. Szurmant, J. A. Hoch, and T. Hwa, Proceedings of the National Academy of Sciences 106, 67 (2009).
- Marks et al. (2012) D. S. Marks, T. A. Hopf, and C. Sander, Nature Biotechnology 30, 1072 (2012).
- Barton and Cocco (2013) J. Barton and S. Cocco, Journal of Statistical Mechanics: Theory and Experiment 2013, P03002 (2013).
- Mann et al. (2014) J. K. Mann, J. P. Barton, A. L. Ferguson, S. Omarjee, B. D. Walker, A. K. Chakraborty, and T. Ndung’u, PLoS Computational Biology 10, e1003776 (2014).
- Grenfell et al. (2004) B. T. Grenfell, O. G. Pybus, J. R. Gog, J. L. Wood, J. M. Daly, J. A. Mumford, and E. C. Holmes, Science 303, 327 (2004).
- Lemey et al. (2006) P. Lemey, A. Rambaut, and O. G. Pybus, AIDS Reviews 8, 125 (2006).
- Neher and Leitner (2010) R. A. Neher and T. Leitner, PLoS Computational Biology 6, e1000660 (2010).
- Bartha et al. (2013) I. Bartha, J. M. Carlson, C. J. Brumme, P. J. McLaren, Z. L. Brumme, M. John, D. W. Haas, J. Martinez-Picado, J. Dalmau, C. López-Galíndez, et al., eLife 2, e01123 (2013).
- Colonno et al. (2004) R. Colonno, R. Rose, C. McLaren, A. Thiry, N. Parkin, and J. Friborg, Journal of Infectious Diseases 189, 1802 (2004).
- Chang and Torbett (2011) M. W. Chang and B. E. Torbett, Journal of Molecular Biology 410, 756 (2011).
- Pommier et al. (2005) Y. Pommier, A. A. Johnson, and C. Marchand, Nature Reviews Drug Discovery 4, 236 (2005).