Toward Understanding The B[e] Phenomenon: V. Nature and Spectral Variations of the MWC 728 Binary System.
Abstract
We report the results of a long-term spectroscopic monitoring of the FS CMa type object MWC 728. We found that it is a binary system with a B5 Ve (Teff = 140001000 K) primary and a G8 III type (T 5000 K) secondary. Absorption line positions of the secondary vary with a semi-amplitude of 20 km s-1 and a period of 27.5 days. The system’s mass function is 2.3 M⊙, and its orbital plane is 13–15 tilted from the plane of the sky. The primary’s 110 km s-1 combined with this tilt implies that it rotates at a nearly breakup velocity. We detected strong variations of the Balmer and He i emission-line profiles on timescales from days to years. This points to a variable stellar wind of the primary in addition to the presence of a circum-primary gaseous disk. The strength of the absorption-line spectrum along with the optical and near-IR continuum suggest that the primary contributes 60% of the –band flux, the disk contributes 30%, and the secondary 10%. The system parameters, along with the interstellar extinction, suggest a distance of 1 kpc, that the secondary does not fill its Roche lobe, and that the companions’ mass ratio is 0.5. Overall, the observed spectral variability and the presence of a strong IR-excess are in agreement with a model of a close binary system that has undergone a non-conservative mass-transfer.
Subject headings:
stars: emission-line, Be; (stars:) binaries: spectroscopic; stars: individual: MWC 7281. Introduction
This paper continues a series devoted to studying objects from the Galactic FS CMa type group consisting of 70 members and candidates characterized by the B[e] phenomenon. The phenomenon was discovered by Allen & Swings (1976) and refers to the presence of forbidden emission lines of [Fe ii] and/or [O i] in the spectra of B–type stars. In the vast majority of cases one also detects a strong excess of IR radiation that is attributed to circumstellar dust. Lamers et al. (1998) recognized four subgroups of B[e] objects with known evolutionary status: pre-main-sequence Herbig Ae/Be stars (“HAeB[e]”), symbiotic binaries (“SymB[e]”), compact Planetary Nebulae (“cPNB[e]”), and supergiants (“sgB[e]”). They concluded that the B[e] phenomenon is found in objects at very different evolutionary stages but with similar conditions in their circumstellar envelopes. However, they were unable to classify 50% of the objects selected by Allen & Swings (1976) and called them unclassified objects with the B[e] phenomenon (“unclB[e]”).
| Observatory | Dates | Range | Resolution | No. |
|---|---|---|---|---|
| CFHT | 2004–2010 | 3600–10500 | 65000 | 3 |
| OAN–SPM | 2005–2014 | 3600–8000 | 18000 | 36 |
| McDonald | 2005–2013 | 3600–10500 | 60000 | 11 |
| TCO | 2013–2014 | 4250–7850 | 10000 | 56 |
| Ondřejov | 2012–2014 | 6250–6750 | 12500 | 10 |
-
Column information: (1) – Observatory name, (2) – range of observing dates, (3) – spectral range in Å, (4) - spectral resolving power, and (5) – numbers of spectra obtained.
-
Spectrographs used: ESPaDOnS (Donati et al., 1997) at CFHT, REOSC at Observatorio Astronomico Nacional San Pedro Martir (OAN-SPM), cs23 (Tull et al., 1995) at the McDonald Observatory, Eshel from Shelyak Instruments at the Three College Observatory (TCO), and a Coudé spectrograph (Šlechta & Škoda, 2002) at Ondřejov.
The unclB[e] objects were critically reconsidered by Miroshnichenko (2007). Several possible evolutionary states (e.g., pre-main-sequence stars or supergiants) were rejected, and the group was renamed FS CMa objects. The main observational properties of this group include the following: 1) early–B to early–A type optical continuum with strong emission lines of hydrogen, Fe ii, [O i], and sometimes of [Fe ii] and [O iii] (some absorption lines from the hot star atmosphere may be present as well, but they are frequently veiled by the circumstellar continuum); 2) a large IR excess that peaks at 10–30 m and sharply decreases longward; 3) location outside of star-forming regions; and 4) a secondary companion (so far discovered in about one third of the group members) which can be a fainter and cooler normal star or a degenerate object.
Miroshnichenko et al. (2007) expanded the group with 10 newly discovered objects found in the IRAS database by cross-identification with catalogs of optical positions. Later Miroshnichenko et al. (2011) reported 20 more candidates found in the NOMAD catalog (Zacharias et al., 2005) using optical and near-IR color criteria. Although the origin of the B[e] phenomenon is understood at least qualitatively in all the groups with known evolutionary status, it still remains controversial whether FS CMa objects are close binaries recently evolved off main-sequence or a distinct group of proto-planetary nebulae (cf. Miroshnichenko, 2007).
The subject of the present paper is a relatively bright ( mag) emission-line star MWC 728 that was first reported by Merrill & Burwell (1949). Some other common identifications of the object are IRAS 03421+2935, HD 281192, and BD+29∘611. A brief survey of observations of MWC 728 found in the literature is given by Miroshnichenko et al. (2007), who described its optical and near-IR spectrum and included it in the FS CMa objects group. They reported the following spectral features: double-peaked Balmer and [O i] lines in emission, He i 4471 Å and Mg ii 4481 Å absorption line from a mid–B spectral type star, and absorption lines of Fe i 5328 Å, Li i 6708 Å, and Ca i 6717 Å lines which indicated the presence of a cool star. We have been monitoring MWC 728 for about 10 years using high-resolution optical spectroscopy and multicolor photometry to study its nature and evolutionary state.
2. Observations
Optical spectroscopic observations of MWC 728 were obtained between December 2004 and February 2015. A summary of the facilities and instruments used in this project is given in Table 1. We have obtained 116 spectra with a range of spectral resolving powers of and signal-to-noise ratios from 30 to 200. The spectra obtained at the McDonald Observatory (Texas, USA), Observatorio Astronomico Nacional San Pedro Martir (OAN SPM, Baja California, Mexico), Ondřejov Observatory (Czech Republic), and Three College Observatory (TCO, North Carolina, USA) were reduced in a standard way with the echelle/slit package in IRAF111IRAF is distributed by the National Optical Astronomy Observatory, which is operated by the Association of Universities for Research in Astronomy (AURA) under a cooperative agreement with the National Science Foundation.. Observations obtained at the CFHT were reduced with the Upena and Libre-ESpRIT (Donati et al., 1997) software packages. Typical uncertainties of the wavelength calibration are 1 km s-1 for the CFHT and McDonald data and 1–2 km s-1 for the other observatories data. Individual radial velocity measurements may have larger errors depending on the line strength and the profile shape.
| JD | |||||||
|---|---|---|---|---|---|---|---|
| 2450000+ | |||||||
| 4748.3885 | 9.79 | 0.16 | 0.32 | 0.31 | |||
| 4750.4548 | 9.75 | 0.04 | 0.23 | 0.31 | |||
| 4753.5535 | 8.28 | 7.46 | 6.90 | ||||
| 4755.5736 | 8.49 | 7.62 | 6.74 | ||||
| 5140.9304 | 8.32 | 7.45 | 6.76 | ||||
| 5145.5718 | 9.80 | 0.17 | 0.25 | 0.40 | |||
| 5487.9896 | 8.32 | 7.45 | 6.66 | ||||
| 5488.9299 | 8.38 | 7.51 | 6.73 |
-
The observations were obtained at CrAO and the observations were obtained at OAN SPM.
| JD 2450000+ | |||
|---|---|---|---|
| 6917.265 | 9.80 | 0.31 | 0.22 |
| 6918.269 | 9.85 | 0.29 | 0.24 |
| 6945.429 | 9.76 | 0.27 | 0.23 |
| 6948.458 | 9.78 | 0.28 | 0.24 |
| 6960.396 | 9.85 | 0.31 | 0.26 |
| 6963.485 | 9.78 | 0.31 | 0.27 |
| 6972.184 | 9.78 | 0.27 | 0.23 |
| 6984.312 | 9.79 | 0.27 | 0.24 |
| 6988.188 | 9.79 | 0.26 | 0.24 |
| 6993.251 | 9.77 | 0.28 | 0.23 |
| 7000.182 | 9.75 | 0.28 | 0.22 |
| 7001.170 | 9.77 | 0.28 | 0.22 |
| 7002.262 | 9.75 | 0.27 | 0.22 |
| 7003.297 | 9.77 | 0.27 | 0.21 |
| 7005.326 | 9.80 | 0.25 | 0.24 |
| 7006.295 | 9.75 | 0.27 | 0.22 |
| 7019.167 | 9.78 | 0.27 | 0.22 |
| 7020.149 | 9.77 | 0.29 | 0.23 |
| 7022.133 | 9.81 | 0.28 | 0.24 |
| 7023.242 | 9.79 | 0.28 | 0.24 |
| 7050.266 | 9.75 | 0.28 | 0.22 |
| 7058.242 | 9.89 | 0.33 | 0.24 |
| 7059.054 | 10.01 | 0.37 | 0.28 |
-
The observations obtained at TShAO in the Johnson-Cousins photometric system.
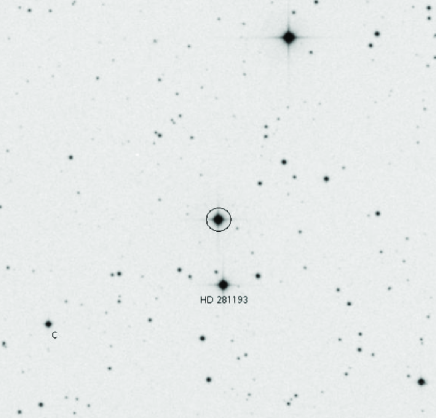
Photometric data for MWC 728 were obtained at the following sites. Three observations were obtained at a 0.6 m telescope of the Crimean Astrophysical Observatory (CrAO) with a single-element photometer in 2008 and 2009 (for the data reduction technique see Grankin et al., 2008). observations of a 10 field around the object were obtained on 23 nights at a 1 m telescope of the Tien-Shan Observatory (TSAO) of the Fesenkov Astrophysical Institute of the National Academy of Sciences of Kazakhstan between September 2014 and February 2015. A 30563056 Apogee F9000 D9 CCD camera with 12m pixels and a 3–step cooling was used with a set of filters. The TSAO data were reduced using Maxim-DL, while brightness of the object and field stars were measured using the IRAF task imexamine. The TSAO instrumental magnitudes were converted into the standard Johnson-Cousins system using data for several open clusters. The TSAO photometry was calibrated by comparing the brightness of MWC 728 to HD 281193 as a comparison star and NOMAD 119746760 as a check star (see Figure 1). The brightness difference between the comparison and check star was found to be 0.01 mag in all our images. Photometry of HD 281193 was obtained at CrAO and resulted in the following magnitudes: = 10.00 mag, = 0.28 mag, = 0.18 mag.
Near-IR observations were obtained at the 0.84 m telescope of the OAN SPM on 5 nights in 2008–2010 with a 256256 pixels IR camera Camila (Cruz-González et al., 1994). The images were calibrated by observing standard stars from Hunt et al. (1998). The near-IR brightness of MWC 728 in our data is 20% higher than that in the 2MASS catalog recorded in December 1999 (cf. Miroshnichenko et al., 2007). The results for all the described photometric observations are presented in Table 2. The accuracy of all the data is 0.02–0.03 mag.
3. Data Analysis
The spectral energy distribution of MWC 728 is shown in Figure 2. It is characterized by a slightly reddened optical continuum of a hot star and a strong IR excess produced by circumstellar gas and dust. A detailed analysis of the optical absorption and emission lines is presented in the following subsections, while the components of the total flux are discussed in Sect. 4. The dust component of the system will be analyzed in a follow-up paper.
3.1. Absorption lines
Absorption lines in the spectrum of MWC 728 can be divided into three groups.
The first group contains relatively broad (FWHM 220 km s-1) and weak (I/I 0.9) lines that manifest a moderate projected rotation of a hot star (see Figure 3, left panel). It includes He i lines (4009, 4026, 4471, 5876, 6678 Å), the Mg ii 4482 Å, Si ii 6347 and 6371 Å, and the O i 7772–7775 Å triplet.
The Mg ii 4482 Å line has an average equivalent width (EW) of 0.220.03 Å which is typically 1.70.3 times weaker than the EW of the He i 4471 Å line. The EW ratio of these lines serves as an effective temperature (Teff) criterion. We used spectra of 60 B–type dwarfs and giants as well as Be stars obtained at the Observatoire de Haute-Provence (OHP, 48000, Moultaka et al., 2004) and TCO to calibrate the ratio (Figure 3, right panel). Since the EW of both lines can be affected by a contribution from the cool star and the circumstellar material, we need to explore this effect.
As shown below in this Section, the cool star makes a negligible contribution in this spectral region. Any additional circumstellar continuum would lower EWs of both lines. Therefore, removal of such a continuum would lead to a lower temperature estimate based on the Mg ii EW but to a higher one based on the He i EW. Although the lines may also be affected by radiation transfer in the disk, the net effect is probably small judging from the positions of Be stars in the right panel of Figure 3. The He i lines in the blue part of the spectrum of MWC 728 (Figure 4) look weaker than those of BS 896 (T 14000 K) and comparable to those of Vega (T 9500 K). However, the circumstellar contribution to the observed optical continuum estimated in Sect. 4 partially accounts for the He i lines weakening. With this analysis, we estimate the hot companion T1000 K which corresponds to a spectral type B5 (Gray & Corbally, 1994). Additionally, comparison with spectra of B–type stars, which show no evidence for a noticeable amount of circumstellar gas, suggests a projected rotational velocity of 110 km s-1 (see Figure 3, left panel).
Atmospheric absorption wings are only occasionally seen in H, while higher members of the Balmer series do not fill their atmospheric profiles with emission. The latter exhibit deep and narrow line cores during periods of the enhanced emission (starting from H, see Figure 4). The Si ii lines are weak that is typical of dwarfs and giants, thus excluding a supergiant luminosity. The Paschen series lines and Fe ii lines are seen neither in absorption nor in emission. They are most likely filled with emission components as well as veiled by the continuum of the cool companion and circum-primary disk.
Most absorption lines of the hot star are variable, especially He i lines which sometimes show emission components (see Figure 5). These components are seen in the line wings and probably due to the fast rotating material in the inner parts of the circum-primary disk. The detection of only weak emission supports our determination of the primary’s Teff, because He i lines transition into full emission typically occurs at T K.
| JD | Phase | RV | Err. | JD | Phase | RV | Err. | JD | Phase | RV | Err. | JD | Phase | RV | Err. |
|---|---|---|---|---|---|---|---|---|---|---|---|---|---|---|---|
| 3363.730 | 0.000 | 21.9 | 1.1 | 4419.892 | 0.407 | 15.4 | 2.1 | 6244.761 | 0.769 | 27.1 | 1.1 | 6962.795 | 0.880 | 42.3 | 8.1 |
| 3656.801 | 0.658 | 2.9 | 3.5 | 4421.886 | 0.480 | 10.0 | 3.4 | 6250.694 | 0.984 | 29.7 | 2.2 | 6963.764 | 0.915 | 41.0 | 3.7 |
| 3721.654 | 0.016 | 20.7 | 1.9 | 4423.866 | 0.552 | 9.2 | 7.8 | 6295.634 | 0.619 | 4.0 | 2.1 | 6964.758 | 0.951 | 37.2 | 2.6 |
| 3726.711 | 0.200 | 22.6 | 1.9 | 4744.841 | 0.224 | 26.0 | 2.3 | 6320.678 | 0.529 | 19.2 | 1.7 | 6993.739 | 0.005 | 32.8 | 3.7 |
| 4081.875 | 0.115 | 24.4 | 3.1 | 4746.855 | 0.297 | 18.6 | 4.3 | 6322.655 | 0.601 | 15.7 | 2.7 | 6996.699 | 0.113 | 37.2 | 2.9 |
| 4082.658 | 0.144 | 38.1 | 3.2 | 4815.747 | 0.803 | 17.4 | 1.8 | 6580.981 | 0.995 | 40.4 | 2.2 | 7035.618 | 0.528 | 22.1 | 3.6 |
| 4083.884 | 0.188 | 33.3 | 3.7 | 5079.925 | 0.409 | 5.8 | 2.6 | 6584.811 | 0.135 | 38.5 | 2.8 | 7036.733 | 0.569 | 18.7 | 3.8 |
| 4092.612 | 0.506 | 16.0 | 3.5 | 5081.934 | 0.482 | 12.8 | 2.7 | 6585.786 | 0.170 | 39.7 | 2.3 | 7037.609 | 0.601 | 15.2 | 5.8 |
| 4094.576 | 0.577 | 2.5 | 3.1 | 5145.750 | 0.803 | 32.2 | 6.3 | 6587.831 | 0.244 | 32.8 | 2.3 | 7038.613 | 0.637 | 9.7 | 6.3 |
| 4096.750 | 0.656 | 21.3 | 4.7 | 5410.634 | 0.436 | 20.4 | 1.6 | 6628.678 | 0.730 | 14.0 | 3.5 | 7040.720 | 0.714 | 11.9 | 4.3 |
| 4412.847 | 0.151 | 34.6 | 5.0 | 5414.580 | 0.579 | 21.4 | 0.8 | 6961.798 | 0.844 | 37.9 | 1.9 | 7041.717 | 0.750 | 21.4 | 3.8 |
-
The list of Julian dates (2450000+) when spectra with signal-to-noise ratios suitable for the absorption line measurements, column ”Phase” contains phases calculated for the 27.5-day orbital period, column ”RV” lists heliocentric radial velocities in km s-1, and column ”Err” shows 1– uncertainties of the radial velocities in km s-1.
The second group contains narrow lines of neutral metals, such as Fe i, Ca i, O i, Ti i, and Li i (see Figure 6). They become clearly detectable at 5300 Å and can be traced all the way to the red end of our optical spectra (10000 Å). The weakness of these lines is caused by a stronger contribution of the continuum from the hot star as shown below. It is not easy to constrain the temperature of the cool companion in this situation. The obvious absence of molecular features and the presence of the Li i 6708 Å line, which is typically observed in G5–K2 giants (e.g., Kumar et al., 2011), allows us to assume a T K.
To put more constraints on the fundamental parameters of the cool companion, we compared our spectra of MWC 728 with those of Li-rich giants obtained at the McDonald Observatory with the same instrumental setup. The spectra were normalized to the continuum and smoothed with the same box-car filter to get rid of a high-frequency noise. A very good match was found with the spectrum of the magnetic and Li-rich giant HD 232862 (G8 ii, Teff=5000K, Lèbre et al., 2009). In the top panels of Figure 6 we compared the spectra of MWC 728 and HD 232862 in selected intervals. To fit the absorption line profiles of MWC 728, we added a featureless continuum to the spectrum of HD 232862 in each interval. The best agreement was achieved with the cool star contributions of 5%, 7%, 12%, and 15% in the 5410–5470 Å, 6100–6170 Å, 6705–6750 Å, and 8320–8390 Å intervals, respectively.
| MJD | IV | IR | EW | Phase | Obs. | MJD | IV | IR | EW | Phase | Obs. |
|---|---|---|---|---|---|---|---|---|---|---|---|
| 3363.730 | 6.30 | 12.47 | 60.2 | 0.250 | CFHT | 6661.585 | 3.97 | 5.33 | 26.7 | 0.177 | TCO |
| 3656.801 | 3.70 | 6.61 | 39.5 | 0.908 | SPM | 6670.291 | 5.49 | 5.88 | 31.0 | 0.493 | Ondrj |
| 3721.654 | 5.85 | 6.22 | 37.2 | 0.266 | McDon | 6670.577 | 5.61 | 5.97 | 31.2 | 0.504 | TCO |
| 3726.711 | 5.63 | 8.38 | 44.9 | 0.450 | McDon | 6672.564 | 6.22 | 7.01 | 36.7 | 0.576 | TCO |
| 4081.875 | 6.20 | 8.06 | 50.2 | 0.365 | SPM | 6674.564 | 5.84 | 7.13 | 37.7 | 0.649 | TCO |
| 4082.658 | 5.21 | 8.22 | 46.7 | 0.394 | SPM | 6676.562 | 4.75 | 8.08 | 36.8 | 0.721 | TCO |
| 4083.884 | 5.62 | 8.18 | 42.8 | 0.438 | SPM | 6677.588 | 4.52 | 8.72 | 37.9 | 0.759 | TCO |
| 4092.612 | 3.48 | 6.82 | 39.7 | 0.756 | McDon | 6678.553 | 3.92 | 7.58 | 32.1 | 0.794 | TCO |
| 4094.576 | 3.86 | 7.41 | 41.7 | 0.827 | McDon | 6680.543 | 4.23 | 7.58 | 33.7 | 0.866 | TCO |
| 4096.750 | 4.90 | 7.81 | 44.4 | 0.906 | McDon | 6682.525 | 4.86 | 7.73 | 34.3 | 0.938 | TCO |
| 4412.847 | 4.61 | 6.65 | 40.8 | 0.401 | SPM | 6711.328 | 5.50 | 7.37 | 36.7 | 0.986 | Ondrj |
| 4419.892 | 3.55 | 5.36 | 34.2 | 0.657 | SPM | 6712.438 | 5.60 | 7.45 | 36.8 | 0.026 | Ondrj |
| 4421.886 | 3.80 | 5.88 | 37.6 | 0.730 | SPM | 6712.540 | 5.30 | 7.86 | 37.0 | 0.030 | TCO |
| 4423.866 | 4.45 | 7.77 | 47.9 | 0.802 | SPM | 6717.273 | 6.06 | 6.15 | 35.9 | 0.202 | Ondrj |
| 4744.841 | 4.71 | 6.67 | 34.3 | 0.474 | SPM | 6861.564 | 4.24 | 9.22 | 43.0 | 0.449 | Ondrj |
| 4746.855 | 6.00 | 6.49 | 33.0 | 0.547 | SPM | 6948.702 | 4.75 | 8.64 | 38.7 | 0.618 | TCO |
| 4813.774 | 4.75 | 8.05 | 37.5 | 0.981 | McDon | 6949.725 | 4.76 | 8.41 | 37.8 | 0.655 | TCO |
| 4815.747 | 5.61 | 9.57 | 47.5 | 0.053 | McDon | 6955.744 | 5.09 | 7.49 | 32.6 | 0.874 | TCO |
| 5079.925 | 2.75 | 10.37 | 44.1 | 0.660 | McDon | 6956.777 | 5.26 | 7.42 | 35.5 | 0.911 | TCO |
| 5081.934 | 2.62 | 8.62 | 33.6 | 0.733 | McDon | 6957.727 | 4.89 | 6.69 | 33.7 | 0.946 | TCO |
| 5143.723 | 6.25 | 7.63 | 52.4 | 0.980 | SPM | 6961.720 | 4.98 | 11.14 | 56.6 | 0.091 | TCO |
| 5145.750 | 4.71 | 8.82 | 50.2 | 0.053 | SPM | 6961.798 | 5.28 | 12.05 | 61.9 | 0.094 | SPM |
| 5410.634 | 5.54 | 6.35 | 34.2 | 0.686 | CFHT | 6962.795 | 4.30 | 11.67 | 57.1 | 0.130 | SPM |
| 5414.580 | 5.64 | 6.35 | 34.1 | 0.829 | CFHT | 6963.764 | 3.67 | 11.16 | 50.3 | 0.166 | SPM |
| 5925.657 | 4.90 | 6.60 | 29.5 | 0.415 | TCO | 6964.654 | 3.23 | 11.82 | 47.3 | 0.198 | TCO |
| 6154.576 | 2.84 | 7.05 | 29.2 | 0.739 | Ondrj | 6964.758 | 3.42 | 12.03 | 49.6 | 0.202 | SPM |
| 6158.531 | 2.57 | 5.91 | 25.7 | 0.883 | Ondrj | 6969.693 | 2.16 | 8.77 | 31.2 | 0.381 | TCO |
| 6187.475 | 4.40 | 5.56 | 27.8 | 0.936 | Ondrj | 6971.685 | 3.39 | 7.71 | 29.4 | 0.454 | TCO |
| 6244.761 | 5.16 | 7.89 | 44.1 | 0.019 | SPM | 6972.701 | 3.80 | 7.18 | 28.8 | 0.491 | TCO |
| 6250.694 | 4.20 | 5.66 | 30.9 | 0.235 | SPM | 6973.731 | 4.07 | 6.60 | 28.3 | 0.528 | TCO |
| 6290.675 | 4.02 | 7.42 | 23.3 | 0.689 | McDon | 6976.659 | 4.24 | 6.22 | 30.4 | 0.635 | TCO |
| 6295.634 | 6.13 | 5.71 | 38.3 | 0.869 | McDon | 6980.685 | 4.47 | 5.72 | 35.0 | 0.781 | TCO |
| 6320.678 | 3.45 | 5.58 | 22.1 | 0.780 | SPM | 6982.656 | 4.32 | 6.43 | 33.9 | 0.853 | TCO |
| 6322.655 | 2.59 | 3.57 | 14.7 | 0.852 | SPM | 6992.652 | 4.74 | 5.85 | 29.7 | 0.216 | TCO |
| 6580.981 | 4.83 | 4.54 | 33.7 | 0.246 | SPM | 6993.718 | 4.62 | 6.61 | 36.5 | 0.255 | SPM |
| 6584.811 | 4.84 | 8.76 | 49.0 | 0.385 | SPM | 6996.678 | 5.23 | 7.85 | 44.5 | 0.362 | SPM |
| 6585.786 | 4.45 | 9.19 | 49.3 | 0.420 | SPM | 7002.668 | 2.89 | 6.42 | 24.1 | 0.580 | TCO |
| 6587.831 | 1.93 | 10.30 | 38.4 | 0.495 | SPM | 7003.596 | 2.64 | 6.56 | 24.0 | 0.614 | TCO |
| 6589.851 | 1.97 | 8.92 | 28.2 | 0.568 | SPM | 7004.645 | 2.95 | 6.30 | 23.8 | 0.652 | TCO |
| 6591.920 | 2.80 | 7.40 | 25.1 | 0.643 | SPM | 7006.590 | 3.50 | 5.90 | 22.5 | 0.723 | TCO |
| 6592.607 | 2.49 | 6.63 | 21.4 | 0.668 | Ondrj | 7032.592 | 3.47 | 9.88 | 42.6 | 0.669 | TCO |
| 6592.956 | 2.97 | 7.89 | 24.8 | 0.681 | SPM | 7033.570 | 2.62 | 10.28 | 38.8 | 0.704 | TCO |
| 6600.758 | 4.88 | 7.74 | 34.7 | 0.965 | TCO | 7035.618 | 2.04 | 9.44 | 32.9 | 0.779 | SPM |
| 6605.735 | 4.26 | 7.95 | 38.3 | 0.146 | TCO | 7036.733 | 2.56 | 9.02 | 31.6 | 0.819 | SPM |
| 6606.506 | 3.74 | 7.15 | 32.0 | 0.174 | Ondrj | 7037.609 | 2.44 | 8.39 | 29.2 | 0.851 | SPM |
| 6607.710 | 4.18 | 7.49 | 33.7 | 0.218 | TCO | 7038.613 | 2.57 | 7.63 | 26.8 | 0.887 | SPM |
| 6611.709 | 4.88 | 6.49 | 30.4 | 0.363 | TCO | 7039.559 | 3.28 | 7.29 | 25.6 | 0.922 | TCO |
| 6625.712 | 3.59 | 8.03 | 34.8 | 0.872 | TCO | 7039.748 | 3.48 | 7.28 | 26.4 | 0.929 | SPM |
| 6626.663 | 4.20 | 7.21 | 35.0 | 0.907 | TCO | 7040.720 | 3.43 | 6.35 | 26.5 | 0.964 | SPM |
| 6627.690 | 4.22 | 6.83 | 31.3 | 0.944 | TCO | 7041.586 | 3.14 | 6.65 | 27.4 | 0.996 | TCO |
| 6628.678 | 4.33 | 6.52 | 30.1 | 0.980 | TCO | 7041.717 | 3.25 | 6.51 | 27.4 | 0.000 | SPM |
| 6637.655 | 3.46 | 6.61 | 31.9 | 0.307 | TCO | 7042.595 | 3.58 | 6.45 | 27.4 | 0.032 | TCO |
| 6639.658 | 3.67 | 7.62 | 36.6 | 0.379 | TCO | 7044.508 | 4.24 | 5.89 | 25.9 | 0.102 | TCO |
| 6642.650 | 3.90 | 6.84 | 32.3 | 0.488 | TCO | 7045.529 | 4.57 | 5.90 | 26.5 | 0.139 | TCO |
| 6643.691 | 3.81 | 7.18 | 33.4 | 0.526 | TCO | 7059.535 | 5.96 | 5.71 | 36.5 | 0.648 | TCO |
| 6645.682 | 4.06 | 5.47 | 30.4 | 0.598 | TCO | 7061.549 | 4.98 | 6.52 | 42.3 | 0.722 | TCO |
| 6653.641 | 7.27 | 7.69 | 52.0 | 0.888 | TCO | 7062.544 | 5.68 | 8.14 | 47.2 | 0.758 | TCO |
| 6654.627 | 5.83 | 8.32 | 50.4 | 0.924 | TCO | 7065.554 | 6.32 | 8.44 | 50.5 | 0.867 | TCO |
-
The columns lists Modified Julian dates (JD245000), the blue (IV) and red (IR) peak strengths in the continuum units, the H line EW in Å, orbital phase according to the ephemeris in the text, and the observing site ID (see Table 1), respectively.
The profiles and positions of the metallic absorption lines in the spectra of MWC 728 are noticeably variable (Figure 6, bottom panels). Due to the line weakness that limits the accuracy of individual radial velocity measurements, we used the cross-correlation method implemented in the IRAF package rvsao. A wavelength region between 6100 Å and 6170 Å that is well populated with the absorption lines was chosen for the measurements. The region includes the following lines: Ca i (Mult. 3) 6102.72, 6122.22, and 6162.17 Å, Fe i (Mult. 169) 6136.62 Å, Fe i (Mult. 816) 6141.73 Å, O i (Mult. 10) 6155.99, 6156.78, and 6158.19 Å, and Ca i (Mult. 20) 6163.76 and 6169.56 Å. No Li i line at 6104.00 Å can be clearly separated from the Ca i 6102.72 Å line. Forty four spectra obtained at CFHT, McDonald, OAN SPM, and TCO were used to measure radial velocities. A high signal-to-noise spectrum obtained at CFHT on 2004 December 24 was chosen as a template. The absorption lines are well defined in this spectrum which allowed an accurate measurement of the averaged radial velocity of 21.91.1 km s-1. All radial velocities measured by cross-correlation are presented in Table 3.
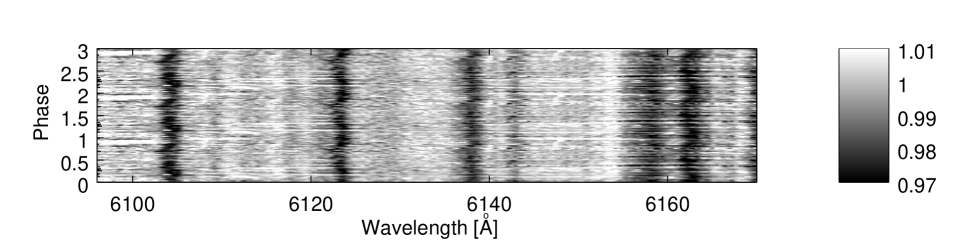
The Discrete Fourier Transform (DFT) method222http://www.univie.ac.at/tops/Period04/ (Deeming, 1975) and CLEAN procedure (Roberts et al., 1987) were applied to search for periodicity in the radial velocity data. The resulting periodograms are presented in Figure 7 (left panel). The two highest peaks in the DFT power spectrum have nearly equal strengths at frequencies that correspond to periods of 29.7 and 27.5 days, while the CLEAN procedure picks on the only period of Porb= 27.5(1) days. The latter one was adopted as an orbital period of the system. The radial velocity curve and the –band photometric data folded on Porb are shown in Figure 7 (right panel). Figure 8 shows phased time series spectra for the 6100–6170 Å wavelength region where positional variations of the absorption lines are clearly seen. The ephemeris of the orbital phase from the radial velocity measurements can be described as
where corresponds to a moment when the cool companion is located between the hot companion and the observer. The radial velocity curve is symmetric about a –velocity of +25 km s-1. It can be considered sinusoidal within the measurement errors (circular orbit) and has a semi-amplitude of 20 km s-1.
We note that sometimes the absorption lines are split into two components. The splitting develops within a few days and seems to occur at no preferential orbital phase. The components appear on both sides of the initial unsplit line position and are separated by up to 80 km s-1. Such an episode observed on 2006 December 22–26 is shown in Figure 6 (bottom panels). Splitting occurs simultaneously in all absorption lines which adds to the scatter of the radial velocities determined by cross correlation. This phenomenon might be due to appearance of emission components near the line centers, but its actual mechanism is unclear.
The third group of absorption lines has interstellar origin. MWC 728 is located at a galactic latitude of , nearly south of the association Per OB2. The distance of Per OB2 from the Sun is 0.3 kpc (e.g., Mel’nik & Dambis, 2009), and the interstellar extinction in its line of sight is AV = 0.95 mag (Cernis, 1993). A photometric study of a area around MWC 728 by Rydgren (1971) showed that the extinction in this direction is lower and reaches 1 mag at a distance of 1 kpc. The interstellar absorption lines in the MWC 728 spectrum are represented by diffuse interstellar bands (DIBs), such as 4430, 5780, 5797, 6613 Å, and the Na i D–lines at 5889 and 5895 Å. The sodium lines are narrow and saturated at our highest resolution spectra (60000). Their measured average radial velocity is 111 km s-1. The DIBs are weak (e.g., EW5780 = 0.13 Å). Based on the relationship of the EW5780 and E from Herbig (1993), the interstellar reddening for MWC 728 is E 0.3 mag. This estimate implies a visual interstellar extinction of A 1.0 mag, and a distance to the object of at least 1 kpc. Both the distance and reddening are discussed in more detail in Sect. 4.
3.2. Emission lines
The emission-line spectrum is represented by the Balmer lines, the [O i] 6300 Å and 6364 Å lines (Figure 9), and weak emission components of the He i 5876 Å line mentioned above (Figure 5). The forbidden oxygen lines have double-peaked profiles with nearly the same, slightly varying intensity peaks and an average peak separation of 40 km s-1. The average radial velocity of these lines is km s-1 which virtually coincides with the -velocity of the absorption lines. The equivalent widths of the [O i] lines are EWÅ and EWÅ.
The H and H lines are relatively strong and show double-peaked emission profiles in most of our spectra (Figure 9 and 10). Measured parameters of the H line are presented in Table 4 and plotted in Figure 11 (for the seasons of 2013–2014). The H line profile is highly variable with changes occurring on a time scale from days (Figure 10) to months (Figure 11). The EW of the H line emission component varies from 15 Å to 61 Å.
The blue peak of the H line is usually weaker than the red one with an average peak intensity ratio of V/R = 0.60.2. This is different from the Balmer line profiles of classical Be stars, in which the peaks typically show a nearly equal strength (except for cyclic variations of the peak ratio, variations, that are due to density perturbations rotating in the disk). This effect may be explained by emission from the stellar wind of the hot companion that expands beyond its disk (see Figure 13).
Sometimes the peak intensity ratio reaches V/R (Fig 12). The H line EW is typically Å at these moments. However, on one occasion (2013 December 26) the line was stronger with an EW of Å. We interpret the profiles with V/R as dominated by the circum-primary disk emission with almost no contribution from the primary’s stellar wind. The EW changes of the symmetric H profiles may be due to density variations in the circum-primary disk.
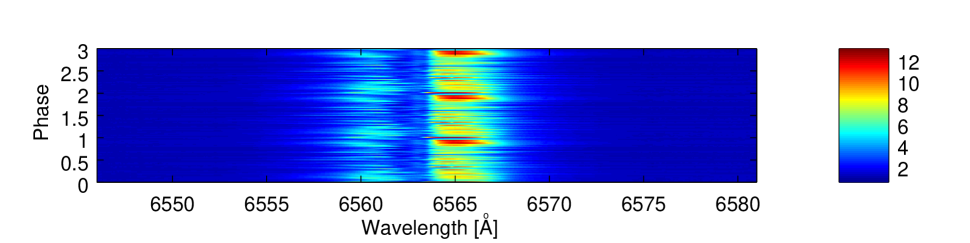
We do not find noticeable variations of the H line profile related to the periodicity of the absorption lines. However some imprints of the orbital motion can be seen in the violet peak in Figure 14, where phased time series spectra around H folded with the orbital period are shown. The current amount of data is not sufficient to verify this suggestion. A few months of continuous spectroscopic observations are needed to explore the validity of this statement.
Another feature of the profile is a weak emission peak at a nearly zero heliocentric radial velocity. It is clearly visible in most of our high-resolution spectra but occasionally overlaps with one of the main peaks (Figs. 9, 10, and 12). The source of this emission is not clear yet.
To summarize our current understanding of the formation and variations of the H line we roughly reproduced it by a simple toy model (Figure 13). It includes an atmospheric absorption from the hot star, a double-peaked emission from the circum-primary disk, an emission from the shell/wind with a P Gyg-type profile, and a weak emission peak at the systemic velocity. All the components were represented by simple Gaussian profiles. The resulting profile was calculated following equation 12 from Schoenberg (1985) as , where is a sum of all normalized fluxes of the underlying components and , are absorption and emission components from the P Cyg-type profile of the shell/wind. Such a toy model can qualitatively reproduce the observed profiles and their variability. However application of a radiation transfer code that is capable of treating variable circum-primary disk and wind components is required for quantitative modeling. The latter is beyond the scope of this paper.
3.3. Brightness variations
Photometric observations of MWC 728 are sparse. It was observed in the course of the Northern Stars Variability Survey (NSVS, Woźniak et al., 2004) in 1999–2000. The object’s brightness was detected to be =10.17 mag with no correction to the standard Johnson system. No regular variations or evidence for eclipses were found in these data.
Our photometric data obtained at TShAO show a scatter of 0.1 mag (see Figure 7), similar to that of the NSVS data. However on two nights (2014 November 2 / JD2456964 and 2015 February 4–5 / JD2457058) we managed to take photometry contemporaneously with times when the emission-line spectrum got stronger. On both these occasions the increased by a factor of 1.5 from Å to Å, but the object faded by mag in the –band from the quiescence level. These variations of both the spectral line and brightness can be explained by sporadic matter outbursts from the surface of the hot star. Part of this material obscures the stellar surface and leads to a fading, while line emission becomes stronger due to increasing amount of circumstellar gas. A similar phenomenon has been observed during the built-up of the circum-primary disk around in the Scorpii binary system (Miroshnichenko et al., 2003).
4. Discussion
4.1. The binary system parameters
Adopting an orbital period of 27.5 days and a semi-amplitude of the radial velocity curve of km s-1, we derive a mass function of
where M1 is the primary (hot) companion mass, is the secondary to primary mass ratio, and is the orbital inclination angle.
The small mass function implies a low inclination angle to be reconciled with a meaningful hot star mass and the absence of the photometric evidence for eclipses. No signs of the orbital motion in the Balmer lines formed in the circum-primary disk require a (see Figure 15). Additionally, the detection of the radial velocity variations of the absorption lines and the double-peaked Balmer emission-line’s profiles are inconsistent with the system viewed exactly pole-on.
As mentioned in Sect. 3.1, the He i 4471 Å and Mg ii 4482 Å line profiles suggest a 110 km s-1 for the hot star (Figure 3, left panel). Single main sequence stars with spectral types B51 have masses of , radii of 3.3 R⊙, and breakup rotational velocities of 420 km s-1 (e.g., Frémat et al., 2005). The presence of a circum-primary disk suggests that the hot star rotates near the breakup velocity, and an upper limit on the orbital inclination angle is 15 if the circum-primary disk and the orbital plane are coplanar. A more massive primary would require an (Figure 15). Assuming as an upper limit for the mass ratio leads to the companions’ separation of R⊙ and the size of the secondary’s Roche lobe of 26R⊙.
There is a potential problem in explanation of the Balmer line profiles whose relatively deep central depressions (see, e.g., Figure 4 and 9) may not be consistent with the derived low orbital inclination angle. This apparent contradiction may be resolved by assuming precession of the circum-primary disk. Such an explanation has already been proposed to account for emission-line profile variations in some Be stars (e.g., Hirata, 2007). In the case of MWC 728, the precession period should be large as we did not detect any noticeable changes in the emission-line profiles for over 10 years.
4.2. Relative flux contributions
In order to place more tight constraints on the fundamental parameters of the companions and the distance to the system we need to estimate relative contributions of all the system constituents, i.e. both stars and the circumstellar matter. The cool companion contribution cannot be determined precisely due to veiling by the other flux components that prevents us from learning its true rotation rate and therefore the strength of its spectral lines. Taking this uncertainty into account and using our results for the spectral line contributions (see Sect. 3.1), we adopt a –band contribution of 10% from the cool companion to the total system flux.
Using stellar atmosphere models of Kurucz (1994), we found that a 5000 K star continuum contributions to that of a 14000 K star are nearly the same as the spectral line contributions in all the wavelength intervals we mentioned in Sect. 3.1). This implies that the disk contribution to the total flux has nearly the same wavelength dependence as that of the hot star at least between 5390 Å and 8800 Å. A very similar result has been derived for optical emission from disks of Be stars (e.g., Carciofi et al., 2006) .
Since most of the disk surface seems to be facing the observer, it should result in a non-zero disk contribution to the system radiation. The –band excess is mostly due to the free-free and bound-free disk radiation, because circumstellar dust typically has temperatures below 1500 K and dominates the spectral energy distribution at longer wavelengths (see Figure 2). At the same time, we can estimate upper limits on the –band excess and interstellar extinction by assuming no circumstellar contribution to the continuum in the optical range. Using our average photometric data for the dates when no strong spectral variations were observed ( mag, mag, see Table 2) and taking into account the contribution from the cool companion, we get the following upper limits: = 0.39 mag, = 1.22 mag, and the –band excess of 0.3 mag.
Based on these results, we adopt a lower interstellar extinction of 1.0 mag, which is consistent with that derived from the diffuse interstellar band EW (see Sect. 3.1) and implies a circumstellar color-excess of 0.1 mag. This estimate does not contradict our observations of the He i 4471 Å and Mg ii 4482 Å lines and suggests a disk contribution of 20 % to the continuum at these wavelengths.
Finally, we estimate the expected contributions of the hot companion, the disk, and the cool companion in the optical range (in the –band) to be roughly 60%, 30%, and 10%, respectively. This is in agreement with a general conclusion that the disk contribution to the total optical flux in Be stars may hardly exceed 50% of the hot companion flux Haubois et al. (2012). The wavelength dependence of the disk radiation in the IR region was calculated by extrapolation of the difference between the total flux and that of both stars (see Fig 2).
The fractional contributions define a lower limit the secondary’s radius (corresponding to a luminosity type iii, Straizys & Kuriliene, 1981), if we assume a typical main-sequence mass of and a radius of for the primary. The companions would have these radii at a distance of 1 kpc, which is consistent with the distance dependence of the interstellar extinction (see Sect.3.1) and can be considered a lower limit of the system distance. An upper limit is 3.5 kpc at which the secondary fills its Roche lobe.
Fundamental parameters of the companions for both distances are listed in Table 5. The upper distance limit is hardly consistent with the orbital parameters, because it corresponds to a low critical rotational velocity of the hot star (320 km s-1). The latter requires and a cool companion that is more massive than the hot star (see Figure 15). Therefore, it is unlikely that the cool companion fills its Roche lobe. This allows us to assume that the distance to the system is close to its lower limit, and the companions mass ratio is 0.5.
| D, kpc | ||||
|---|---|---|---|---|
| 1.0 | 2.8 | 3.3 | 1.6 | 7.7 |
| 3.5 | 3.7 | 15.0 | 2.6 | 26.0 |
-
Column 1 lists the distance, columns 2 and 3 show the luminosity and radius of the hot star, columns 4 and 5 show the luminosity and radius of the cool star. We assumed Teff = 14000 K and BC mag for the hot star, Teff = 5000 K and BC mag for the cool star. The bolometric corrections are taken from Miroshnichenko (1997).
4.3. Possible system model
The strong IR excess at m (see Figure 2) implies the presence of dust in the system. It should exist in the circum-binary area, as the stars are too close together to allow its existence around either star. Miroshnichenko (2007) proposed that the dust forms out of the material lost from the system in the course of mass-transfer between the stars. Evolution of intermediate-mass binary systems has been studied theoretically by van Rensbergen et al. (2008). They calculated a grid of models for conservative evolution as well as for a weak and strong tidal interaction between the stars. The grid includes detailed calculations of physical and orbital parameters from formation through the entire mass-transfer phase and beyond. Non-conservative (liberal) evolution, when some mass is lost from the system, was only considered for the more massive companion mass of 5 M⊙.
Browsing through the grid, we found a model which qualitatively explains our findings for MWC 728. It has initial masses of 5 M⊙ and 2 M⊙ and an initial orbital period of 8 days. The mass-transfer starts in years since the evolution began when the more massive star fills its Roche lobe. It lasts for years when the donor reaches a mass of 0.9 M⊙, the gainer has 4.2 M⊙, and nearly 2 M⊙ is lost from the system. Therefore there is enough material to produce dust in the circum-binary area. The evolutionary tracks for the stars in this model are shown in Figure 16.
Although the orbital period evolution in the model does not match that of MWC 728 (it reaches 27 days in the model, but only when the companions have almost the same temperature and luminosity), it is qualitatively consistent with the nature of this system. In particular, the companions’ luminosity and their ratio along with their temperatures roughly match our results. Refining the system parameters with further observations and calculating a finer grid of binary models with non-conservative evolution would provide a more complete explanation of the system properties.
5. Conclusions
Our study confirm an earlier suggestion by Miroshnichenko et al. (2007) that MWC 728 is a binary system. We found the orbit to be circular (within the measurement errors) with a period of Porb = 27.5 days. The system consists of a B5 primary that is 6 times brighter (in the –band) than a G8 iii secondary and is most likely located at a distance of 1 kpc.
The presented results further support the idea that FS CMa objects are a group of moderately evolved binary systems and not proto-planetary nebulae or young stars. Although nearly a dozen FS CMa objects shows signs of binarity mostly through the presence of spectral lines of a cool star (Miroshnichenko, 2007; Miroshnichenko et al., 2007, 2011), MWC 728 is only the second group object with detected orbital motion. The first one was CI Cam (Porb = 19.41 days, Barsukova et al., 2006), and it seems to have a degenerate secondary companion. In all recognized FS CMa type binaries but one (MWC 623, Zickgraf, 2001) spectral lines of the secondary companion are very weak and require both high-resolution and high signal-to-noise spectroscopy to detect them. Additionally, irregular variations of the emission-line spectrum contribute to veiling of the hot star orbital motion. This phenomenon occurs on a time scale of a few days and may represent fast variations of the hot star wind specific to this evolutionary stage. These findings call for frequent and long-term coordinated spectroscopic and photometric campaigns to reveal the objects’ nature.
A recent result by de la Fuente et al. (2015) on two newly found FS CMa group candidates in young clusters brought up an idea that some FS CMa objects could result from a merger in a binary system. This is definitely a possibility, although failure to detect of signs of the secondary companion does not unequivocally imply its absence. Models of non-conservative binary evolution (see Sect. 4) shows that the cooler secondary may be much fainter than the hot primary for a long time. In any case, the binary model remains the major mechanism to explain objects of this group.
We will continue coordinated spectroscopic and photometric observations of MWC 728 in order to further study properties of occasional increases of the emission-line spectrum. They seem to be associated with the object’s brightness decreases and should help to better constrain the nature of the binary system.
References
- Allen & Swings (1976) Allen, D. A., & Swings, J. P. 1976, A&A, 47, 293
- Barsukova et al. (2006) Barsukova, E. A., Borisov, N. V., Burenkov, A. N., et al. 2006, Astronomy Reports, 50, 664
- Carciofi et al. (2006) Carciofi, A. C., Miroshnichenko, A. S., Kusakin, A. V., et al. 2006, ApJ, 652, 1617
- Cernis (1993) Cernis, K. 1993, Baltic Astronomy, 2, 214
- Cruz-González et al. (1994) Cruz-González, I., Carrasco, L., Ruiz, E., et al. 1994, Rev. Mexicana Astron. Astrofis., 29, 197
- de la Fuente et al. (2015) de la Fuente, D., Najarro, F., Trombley, C., Davies, B., & Figer, D. F. 2015, A&A, 575, A10
- Deeming (1975) Deeming, T. J. 1975, Ap&SS, 36, 137
- Donati et al. (1997) Donati, J.-F., Semel, M., Carter, B. D., Rees, D. E., & Collier Cameron, A. 1997, MNRAS, 291, 658
- Ekström et al. (2012) Ekström, S., Georgy, C., Eggenberger, P., et al. 2012, A&A, 537, A146
- Frémat et al. (2005) Frémat, Y., Zorec, J., Hubert, A.-M., & Floquet, M. 2005, A&A, 440, 305
- Grankin et al. (2008) Grankin, K. N., Bouvier, J., Herbst, W., & Melnikov, S. Y. 2008, A&A, 479, 827
- Gray & Corbally (1994) Gray, R. O., & Corbally, C. J. 1994, AJ, 107, 742
- Haubois et al. (2012) Haubois, X., Carciofi, A. C., Rivinius, T., Okazaki, A. T., & Bjorkman, J. E. 2012, ApJ, 756, 156
- Herbig (1993) Herbig, G. H. 1993, ApJ, 407, 142
- Hirata (2007) Hirata, R. 2007, in Astronomical Society of the Pacific Conference Series, Vol. 361, Active OB-Stars: Laboratories for Stellare and Circumstellar Physics, ed. A. T. Okazaki, S. P. Owocki, & S. Štefl, 267
- Hunt et al. (1998) Hunt, L. K., Mannucci, F., Testi, L., et al. 1998, AJ, 115, 2594
- Kumar et al. (2011) Kumar, Y. B., Reddy, B. E., & Lambert, D. L. 2011, ApJ, 730, L12
- Kurucz (1994) Kurucz, R. 1994, Solar abundance model atmospheres for 0,1,2,4,8 km/s. Kurucz CD-ROM No. 19. Cambridge, Mass.: Smithsonian Astrophysical Observatory
- Lamers et al. (1998) Lamers, H. J. G. L. M., Zickgraf, F.-J., de Winter, D., Houziaux, L., & Zorec, J. 1998, A&A, 340, 117
- Lèbre et al. (2009) Lèbre, A., Palacios, A., Do Nascimento, Jr., J. D., et al. 2009, A&A, 504, 1011
- Mel’nik & Dambis (2009) Mel’nik, A. M., & Dambis, A. K. 2009, MNRAS, 400, 518
- Merrill & Burwell (1949) Merrill, P. W., & Burwell, C. G. 1949, ApJ, 110, 387
- Miroshnichenko (1997) Miroshnichenko, A. S. 1997, in ”Fundamental Stellar Properties: The Interaction between Observation and Theory”, (ed.) T. R. Bedding, Proc. of IAU Symp. 189, Publ. by School of Physics, University of Sydney, p.50
- Miroshnichenko (2007) Miroshnichenko, A. S. 2007, ApJ, 667, 497
- Miroshnichenko et al. (2011) Miroshnichenko, A. S., Manset, N., Polcaro, F., Rossi, C., & Zharikov, S. 2011, in “Active OB stars: structure, evolution, mass loss, and critical limits”, IAU Symposium, Vol. 272, eds. C. Neiner, G. Wade, G. Meynet, & G. Peters, p. 260
- Miroshnichenko et al. (2003) Miroshnichenko, A. S., Bjorkman, K. S., Morrison, N. D., et al. 2003, A&A, 408, 305
- Miroshnichenko et al. (2007) Miroshnichenko, A. S., Manset, N., Kusakin, A. V., et al. 2007, ApJ, 671, 828
- Moultaka et al. (2004) Moultaka, J., Ilovaisky, S. A., Prugniel, P., & Soubiran, C. 2004, PASP, 116, 693
- Murakami et al. (2007) Murakami, H., Baba, H., Barthel, P., et al. 2007, PASJ, 59, 369
- Roberts et al. (1987) Roberts, D. H., Lehar, J., & Dreher, J. W. 1987, AJ, 93, 968
- Rydgren (1971) Rydgren, A. E. 1971, PASP, 83, 656
- Savage & Mathis (1979) Savage, B. D., & Mathis, J. S. 1979, ARA&A, 17, 73
- Schoenberg (1985) Schoenberg, K. 1985, A&AS, 62, 339
- Šlechta & Škoda (2002) Šlechta, M., & Škoda, P. 2002, PAICz, 90, 1
- Straizys & Kuriliene (1981) Straizys, V., & Kuriliene, G. 1981, Ap&SS, 80, 353
- Tull et al. (1995) Tull, R. G., MacQueen, P. J., Sneden, C., & Lambert, D. L. 1995, PASP, 107, 251
- van Rensbergen et al. (2008) van Rensbergen, W., De Greve, J. P., De Loore, C., & Mennekens, N. 2008, A&A, 487, 1129
- Woźniak et al. (2004) Woźniak, P. R., Vestrand, W. T., Akerlof, C. W., et al. 2004, AJ, 127, 2436
- Wright et al. (2010) Wright, E. L., Eisenhardt, P. R. M., Mainzer, A. K., et al. 2010, AJ, 140, 1868
- Zacharias et al. (2005) Zacharias, N., Monet, D. G., Levine, S. E., et al. 2005, VizieR Online Data Catalog, 1297, 0
- Zickgraf (2001) Zickgraf, F.-J. 2001, A&A, 375, 122
- Zorec et al. (2009) Zorec, J., Cidale, L., Arias, M. L., et al. 2009, A&A, 501, 297
- Zorec & Royer (2012) Zorec, J., & Royer, F. 2012, A&A, 537, A120