Vortex Formation and Evolution in Planet Harboring Disks under Thermal Relaxation
Abstract
We study the evolution of planet-induced vortices in radially stratified disks, with initial conditions allowing for radial buoyancy. For this purpose we run global two-dimensional hydrodynamical simulations, using the PLUTO code. Planet-induced vortices are a product of the Rossby wave instability (RWI) triggered in the edges of a planetary gap. In this work we assess the influence of radial buoyancy for the development of the vortices. We found that radial buoyancy leads to smoother planetary gaps, which generates weaker vortices. This effect is less pronounced for locally isothermal and quasi-isothermal (very small cooling rate) disks. We observed the formation of two generations of vortices. The first generation of vortices is formed in the outer wall of the planetary gap. The merged primary vortex induces accretion, depleting the mass on its orbit. This process creates a surface density enhancement beyond the primary vortex position. The second generation of vortices arise in this surface density enhancement, indicating that the bump in this region is sufficient to trigger the RWI. The merged secondary vortex is a promising explanation for the location of the vortex in the Oph IRS 48 system. Finally, we observed a nonmonotonic behavior for the vortex lifetimes as a function of the thermal relaxation timescale, agreeing with previous studies. The birth times of the secondary vortices also display a nonmonotonic behavior, which is correlated with the growth time of the primary vortex and its induced accretion.
Subject headings:
Accretion disks — Astrophysics: planet-disk interactions, protoplanetary disks — Hydrodynamics — Methods: numerical — Physics: instabilitiesemail:]gomes@mpia.de
1. Introduction
High mass planets leave remarkable features in their parent protoplanetary disks (PPDs), namely a gap, spiral waves, vortices, and eccentricities. These features are captured in numerical simulations of planet-disk interactions (e.g., Nelson et al., 2000; Winters et al., 2003; Klahr & Kley, 2006; Kley & Dirksen, 2006; de Val-Borro et al., 2007; Uribe et al., 2011; Lin & Papaloizou, 2011a, b; Ataiee et al., 2013; Zhu & Stone, 2014), and are also expected to be observationally detectable (Regály et al., 2010; Pinilla et al., 2012; Ruge et al., 2013; Regály et al., 2014; Ruge et al., 2014; Juhász et al., 2015; Pinilla et al., 2015). In this work we are particularly interested in studying the evolution of planet-induced vortices in buoyantly unstable disks.
Vortices can be formed in PPDs as a product of a Kelvin-Helmholtz instability, referred to as the Rossby wave instability (RWI) for accretion disks, and/or unstable radial buoyancy. The RWI can be triggered when there is a local bump in the inverse potential vorticity profile of the disk (Lovelace et al., 1999; Li et al., 2000). Radial buoyancy can be manifested as the baroclinic instability (BI, Klahr & Bodenheimer, 2003), which needs a radially decreasing pressure and entropy, or in other words, a pressure and entropy gradients with the same sign. Vortices can be amplified due to the subcritical baroclinic instability (SBI, Lesur & Papaloizou, 2010), which is a nonlinear process. A convective overstability (CO, Klahr & Hubbard, 2014; Lyra, 2014) is also able to amplify vortices, CO is linear phase of SBI. More about this topic will be discussed in Section 4. Vortices are interesting structures to be studied, considering that they are important in the context of planet formation, angular momentum transport through the dead zone, and type I migration.
In the context of planet formation, vortices are good candidates to trap dust grains allowing them to grow to planetesimal or planets sizes (Barge & Sommeria, 1995; Klahr & Bodenheimer, 2006). This scenario is a possible solution for the radial drift barrier – large dust grains achieve high velocities toward the central star, making for them impossible to grow before being accreted (Whipple, 1972). However, if the disk has a pressure bump, the dust grains can get trapped into this pressure maximum and an anticyclonic vortex is an example of such maxima (e.g., Bracco et al., 1999; Varnière & Tagger, 2006; Inaba & Barge, 2006; Lyra et al., 2009b; Regály et al., 2012; Meheut et al., 2012a).
Accretion disks need some mechanism to transport angular momentum outwards, allowing then matter to fall inwards. Shakura & Sunyaev (1973) introduced an -disk model to explain this transport, where viscosity, triggered by some kind of turbulence, is shown to be an efficient accretion mechanism. Usually, magnetorotational instability (MRI; Balbus & Hawley, 1991) is the most invoked mechanism to explain turbulence in accretion disks, though in PPDs there is a region, around the disk’s midplane, where the level of ionization is not high enough for MRI to take place: the so called dead zone (Gammie, 1996). The problem of angular momentum transport through the dead zone has been investigated by many authors (e.g., Klahr & Bodenheimer, 2003; Lesur & Papaloizou, 2010; Dzyurkevich et al., 2010; Meheut et al., 2012b). Large-scale vortices in the dead zone of PPDs can help to transport angular momentum through that region. Meheut et al. (2012b) studied the angular momentum flux carried by Rossby vortices. The exchange of angular momentum between Rossby waves in the inner and outer sides of a density bump, leads to a negative net flux, thus an outward transport of angular momentum.
Vortices may also play a role in the context of type I migration. Planet cores and low mass planets experience type I migration (Ward, 1997; Tanaka et al., 2002). One of the biggest issues about type I migration is the fast time scale in which it happens. Vortices are able to trap not only dust particles but also planet cores, thus they are able to slow down the type I migration rate (e.g., Koller et al., 2003; Ou et al., 2007; Li et al., 2009; Yu et al., 2010; Regály et al., 2013; Ataiee et al., 2014).
The formation of planet-induced vortices is being explored thoroughly (e.g., Balmforth & Korycansky, 2001; de Val-Borro et al., 2007; Lyra et al., 2009a; Lin & Papaloizou, 2011b; Zhu & Stone, 2014; Fu et al., 2014; Les & Lin, 2015). Fu et al. (2014) studied the long term evolution of vortices depending on the disk viscosity, disk temperature, and planet mass. They found critical parameters for the disk viscosity () and temperature () that lead to a long vortex lifetime ( Myr). A nonmonotonic behavior with respect to the viscosity and temperature was found, thus high and low viscosities/temperatures lead to a faster damping of the vortices. They concluded also that disks with same viscosity and temperature, but more massive planets, in their case , can sustain vortices for a longer time. Les & Lin (2015) studied vortex evolution in terms of different cooling timescales. They found a non-monotonic dependence of the vortex lifetimes with the cooling timescales, which is in agreement with Fu et al. (2014). Moreover, they pointed out the importance of not considering locally isothermal disks, due to the fact that the RWI theory was developed for adiabatic disks (Lovelace et al., 1999; Li et al., 2000).
In addition to the theoretical/numerical stage of this field, observations with high angular resolution are increasing. The Atacama Large Millimeter/submillimiter Array (ALMA) is now giving the capabilities to detect structures which may be related with unseen planets. Recently, dust asymmetries were observed in five different systems: LkHa 330 (Isella et al., 2013), Oph IRS 48 (van der Marel et al., 2013), HD 142527 (Casassus et al., 2013; Fukagawa et al., 2013), SAO 206462 (Pérez et al., 2014), and SR 21 (Pérez et al., 2014). An anticyclonic vortex could be a reasonable explanation for these asymmetries; however, the definite explanation for these observations is still under debate (Pinilla et al., 2015; Flock et al., 2015).
The aim of this work is to study the long term evolution of planet-induced vortices in buoyantly unstable disks. The paper is laid out as follows. In Section 2 we describe the planet-disk model and simulation setups. We describe the general evolution of our different simulations in Section 3. We discuss the role that the RWI and buoyancy played for vortex formation and sustenance in Section 4. We study the convergence of our results with respect to several factors in Section 5. We observed the formation of a second generation of vortices, which arise in a surface density enhancement that is created beyond the primary vortex position. The formation of the secondary vortices is discussed in Section 6. The vortex lifetimes and birth times with respect to different thermal relaxation timescales is discussed in Section 7. Lastly, in Section 8 we briefly summarize our results and state our conclusions.
2. Simulations
We study the formation and evolution of vortices in the outer edge of planetary gaps by solving numerically the following system of hydrodynamical (HD) equations
| (1) | |||
| (2) | |||
| (3) |
where is the gas surface density, is the velocity, is the vertically integrated pressure, is the gravitational potential, and is the sound speed. In order to close the system of equations, we used an ideal equation of state , with .
We considered an inviscid disk, thus no prescribed viscosity was included. This approximation may influence the vortex evolution, since previous works showed that the vortex lifetime is inversely proportional to the magnitude of viscosity (de Val-Borro et al., 2007; Ataiee et al., 2013; Fu et al., 2014). In this work, we would like to study the direct influence of the RWI and radial buoyancy for the development of the vortices. Therefore we chose to not include a prescribed viscosity. In our models, the only possible source of viscosity is the turbulence-triggered viscosity by the hydrodynamical instabilities. Lastly, we assumed that the barycenter of the system is located at the star’s center. This simplification is plausible, because the planet masses considered are not very large ( and ) neither the vortices accumulate much mass,777We obtained vortices masses up to a few , integrating the surface density with respect to the area element inside the vortex region. thus the deviation of the barycenter with respect to the star’s center should be small. Nonetheless, this approximation may slightly influence planet-induced vortex formation, since it eliminates the Lagrange point L3, in the corotation region, which could change the gap structure.
We used the planet-disk module for the PLUTO code that is presented in Uribe et al. (2011). The gravitational potential includes contributions from the planet and the star, and it is given by
| (4) |
where is the gravitational constant, is the planet mass, is the planet location, is the stellar mass and is a softening parameter. It is needed to soften the gravitational potential of the planet in order to avoid numerical divergence close to the planet’s location. Moreover, this softening can account for 3D effects of vertical stratification. We considered this parameter as being a fraction of the Hill radius , with and . The recommended softening factor for the planet gravitational potential is of (Kley et al., 2012), where is the disk scale height. These values can recover 3D effects of vertical stratification. The Hill radius and the disk scale height at the planet position are similar in our simulations, thus we chose .
The stationary solution of a sub-Keplerian disk was taken as initial conditions, which in polar coordinates is given by
| (5) | |||
| (6) | |||
| (7) | |||
| (8) |
where is the initial surface density at AU, is the slope for the power law distribution of surface density, is the slope for the power law distribution of sound speed, is the Keplerian velocity, and is the initial aspect ratio and fix the intial sound speed at AU, since at AU is set as one.
The planet is set up as a point mass in a given position and with a given mass . In order to avoid an initial big disturbance to the disk, we added the planet slowly along its first Keplerian orbit, according to the following
| (9) |
where is the global time and is one planetary orbit. Thus, while the planet mass slowly increases toward .
The planet initial velocity is assumed to be the Keplerian velocity and the initial acceleration coming from the gravitational interaction with the star and the disk is
| (10) |
where is the area element and is a factor that soften the contribution of the disk gravity in the Hill sphere and is given by
| (11) |
Lastly, the planet position, velocity, and acceleration changed according to the dynamical interaction with the star-disk system. Its acceleration changes with time following Equation 10 and its position and velocity are then updated using a leapfrog integrator.
2.1. Thermal Relaxation
In order to account for radiative effects, we applied cooling to the system. We modeled this cooling via thermal relaxation, following the approach below
| (12) |
where is the temperature, is the initial temperature (equilibrium temperature as result of irradiation), and is the relaxation timescale, which depends on radius (). This approach tends to reestablish the equilibrium temperature profile, after the planetary gap is opened and the system reaches a steady state.
Instead of adding cooling as a source term in the energy equation, we updated the temperature at each time step according to equation 12. Numerically it corresponds to
| (13) |
where is the relaxed temperature, would be the temperature we get from the solution of the energy equation, and is the time step. We solve Equation 3, which describes conservation of energy, considering pressure as an independent variable. Hence, we had to convert equation 13 from temperature to pressure dependent, for which we used the relation , leading to
| (14) |
where is the new pressure from the relaxed temperature, is the pressure we get from the solution of equation 3, is the initial pressure, is the density we get from the solution of equation 1 and is the initial density. Finally, we cooled the disk through equation 14. For the locally isothermal setups, instead of using Equation 14 to cool the disk, we setup the sound speed to its initial profile at every time step, in order to guarantee locally isothermality.
2.2. Numerical Setup
The simulations were carried out using the finite volume Godunov-type code PLUTO (Mignone et al., 2007). Spacial integration and time evolution were performed using the piecewise parabolic method (PPM) and second order Runge-Kutta schemes, respectively. The Harten-Lax-van Leer-Contact (HLLC) Riemann solver was used to compute the numerical fluxes and the Strang operator splitting method to solve the equations in multi-dimensions.
The HD equations were solved in a two-dimensional domain considering polar coordinates. A logarithmic grid was used for the radius and a uniform one for azimuth. The system was integrated from 0.25 AU to 4.0 AU in radius and from 0 to in azimuth. Temporal evolution was taken up to 5000 orbits. Reflective boundary conditions were used in the radial direction and periodic conditions in the azimuthal direction. Distances are given in units of AU; surface densities in units of , which corresponds to a disk mass of inside the domain considered, therefore it is plausible to neglect disk self-gravity, since the Toomre parameter is everywhere in the disk; and velocities in units of Keplerian speed at AU. Table 1 summarizes the simulations parameters.
| Label | a | b | c | d |
|---|---|---|---|---|
| (AU) | () | |||
| TR001 | 1.0 | 1.0 | 0.01 | (512, 1024) |
| TR01 | 1.0 | 1.0 | 0.1 | (512, 1024) |
| TR1 | 1.0 | 1.0 | 1.0 | (512, 1024) |
| TR2 | 1.0 | 1.0 | 2.0 | (512, 1024) |
| TR5 | 1.0 | 1.0 | 5.0 | (512, 1024) |
| TR10 | 1.0 | 1.0 | 10.0 | (512, 1024) |
| ISO1MJ | 1.0 | 1.0 | 0.0 | (512, 1024) |
| ISO3MJ | 3.0 | 1.0 | 0.0 | (512, 1024) |
-
a
Planet mass in terms of Jupiter mass (considering ).
-
b
Planet location in AU.
-
c
Thermal relaxation timescale in orbital units.
-
d
Numerical resolution in the radial () and azimuthal () directions.
3. General Evolution
In this section we describe the system evolution for our simulations. First, we present the results for the simulations with a planet mass, varying the thermal relaxation timescales. Second, we present the results for the isothermal simulations, considering and planet masses.
3.1. Non-isothermal Cases
The first set of results presented are the cases with a planet and different thermal relaxation timescales. The different values of 888Hereafter, we refer to as . considered and their labels can be seen in Table 1. All the simulations presented a similar behavior, which we describe hereafter.
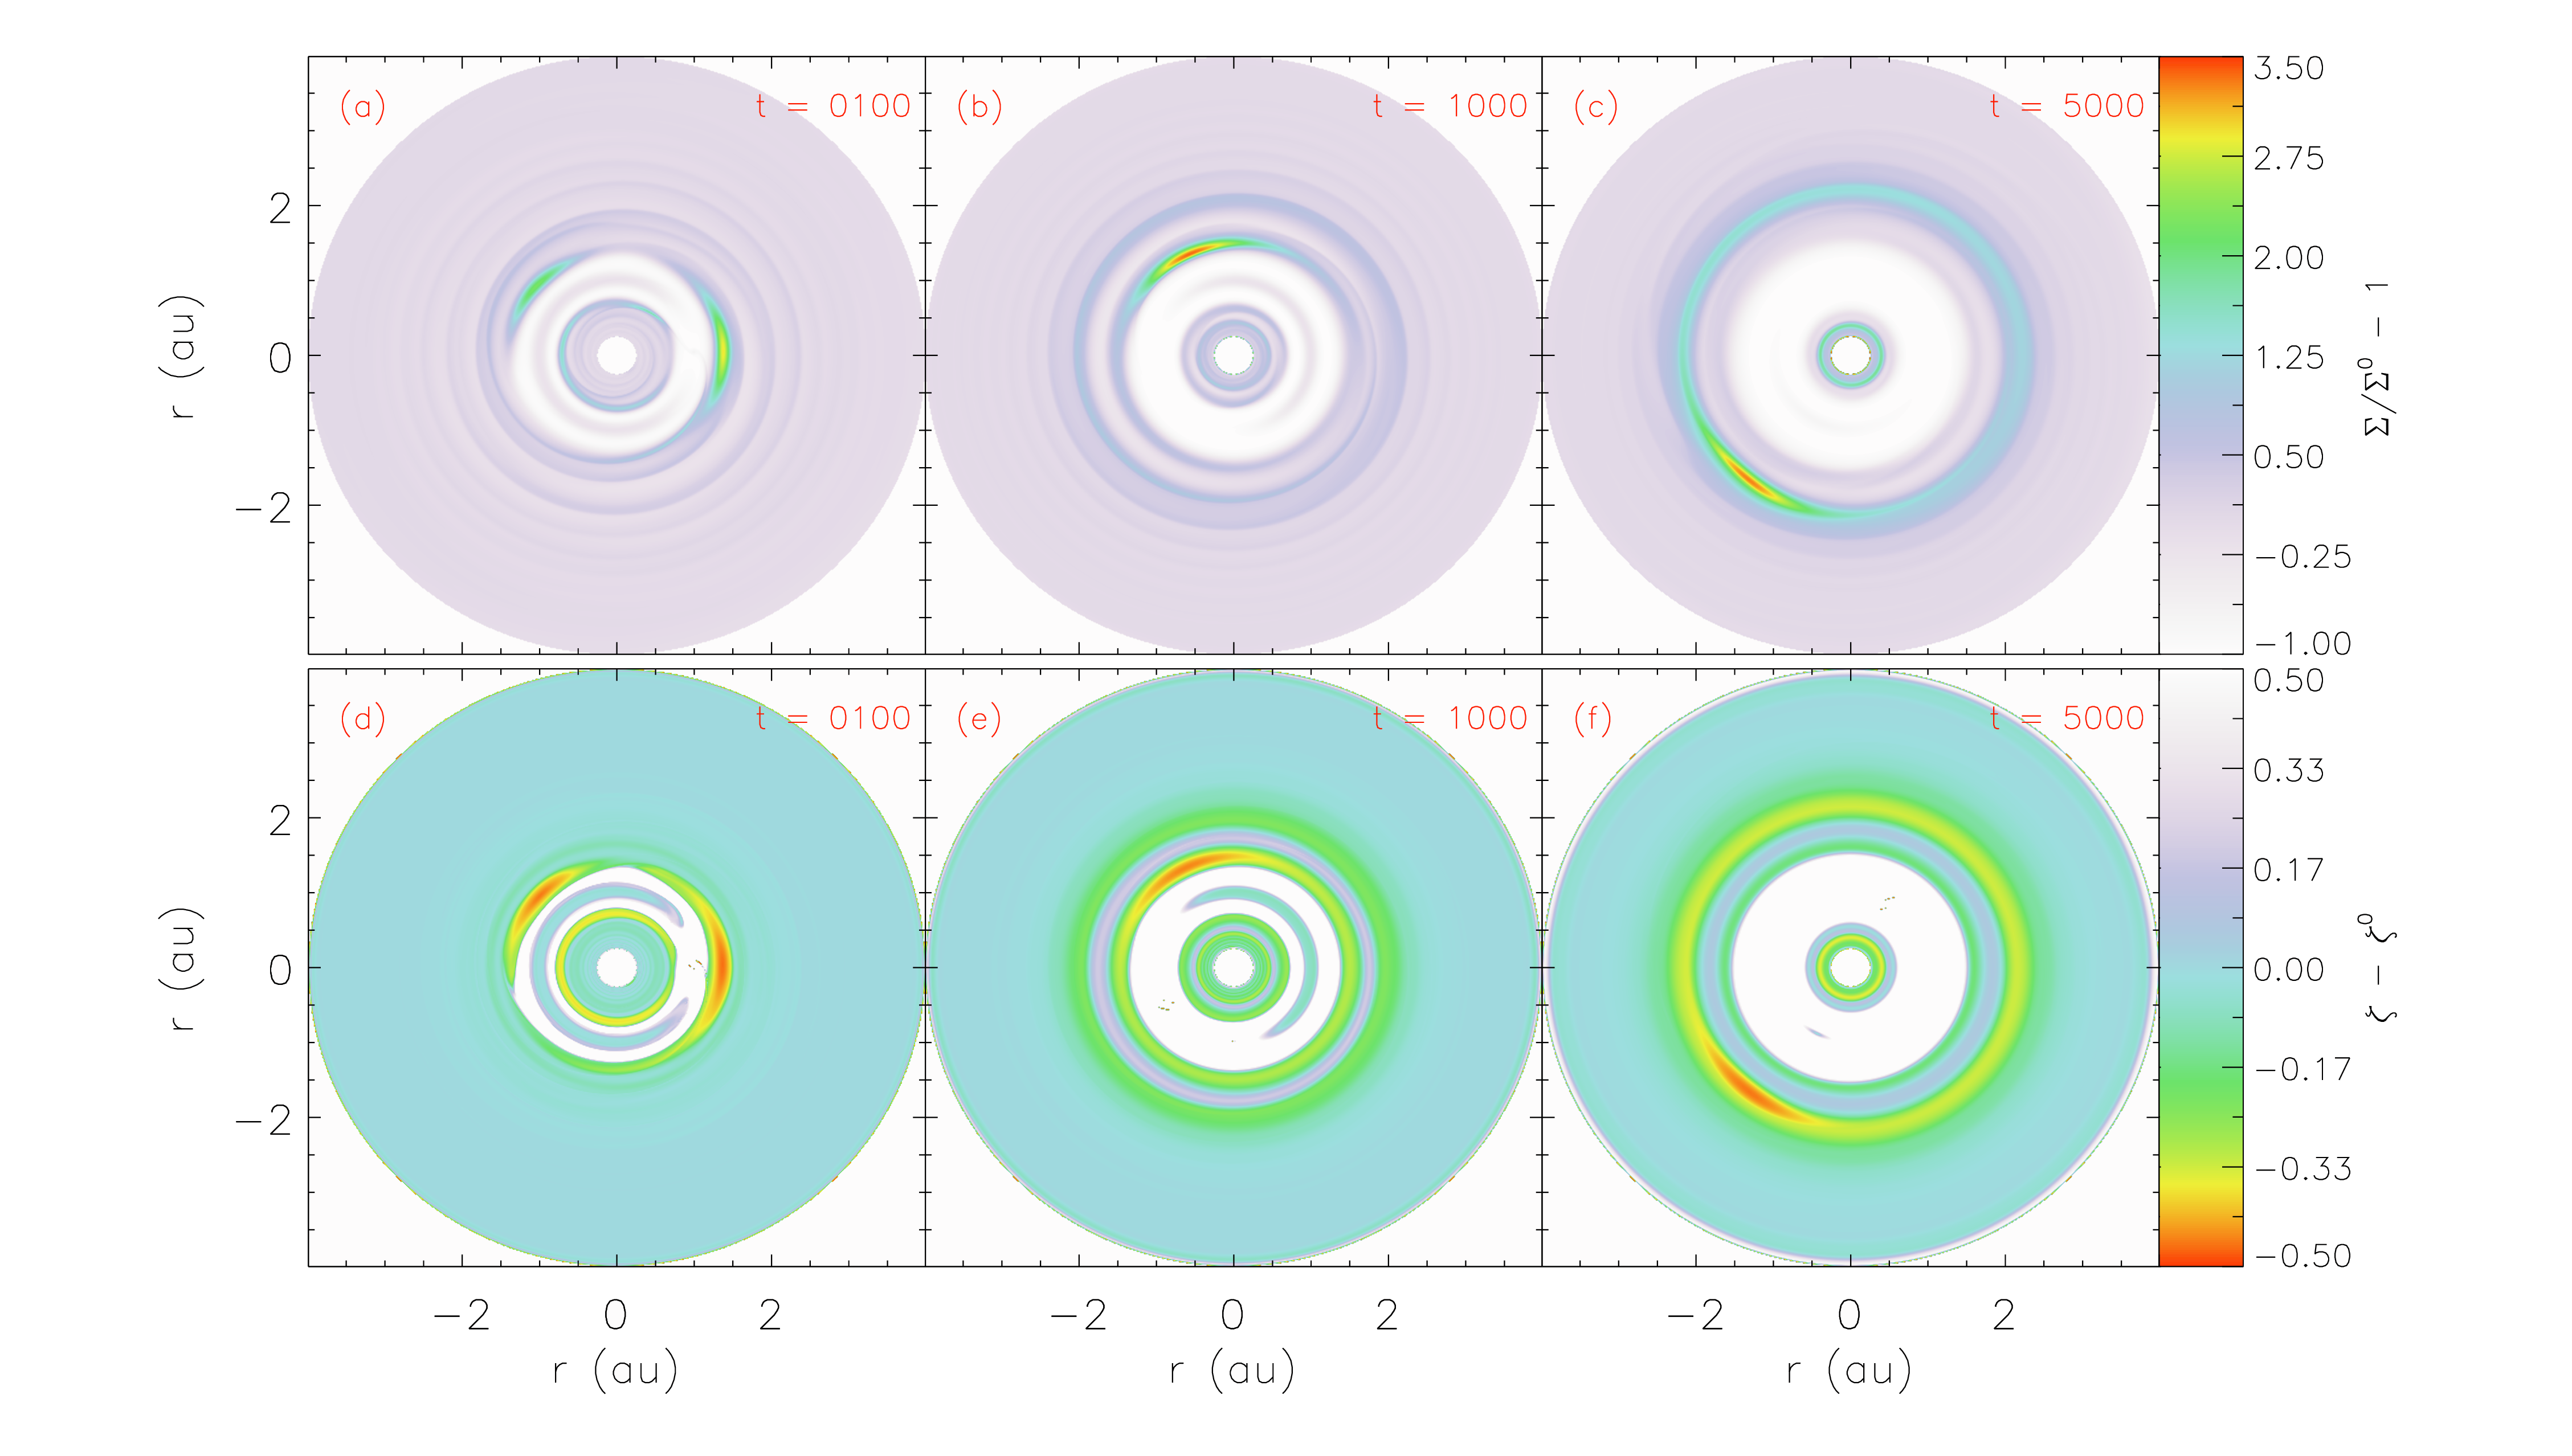
The formation of spiral waves takes place during the first planetary orbit. Additionally, during the first tens of orbits the planet carves out a very noticeable gap and small vortices are formed in the outer edge of this gap. In the first hundreds of planetary orbits these small vortices merge into a bigger one. Some mass remains in the gap region even after a few thousands of orbits, which can be related to the inviscid and/or non-barycentric approximations. The inviscid approximation may influence the efficiency of mass transport. Nonetheless, neglecting the indirect potential exerted on the disk due to the barycenter shift also seems to retain mass in the gap region, even for non-inviscid disks (see Figure 2 in Zhu & Stone, 2014). In the first thousands of planetary orbits a surface density enhancement appears beyond the vortex position. Accumulation of mass persists and a second vortex is formed in this region. The primary vortex is damped in different timescales for the different ’s, nonetheless some material remains in a ring-shape form in between the planetary gap and the secondary vortex. This material is also dispersed out in different timescales.
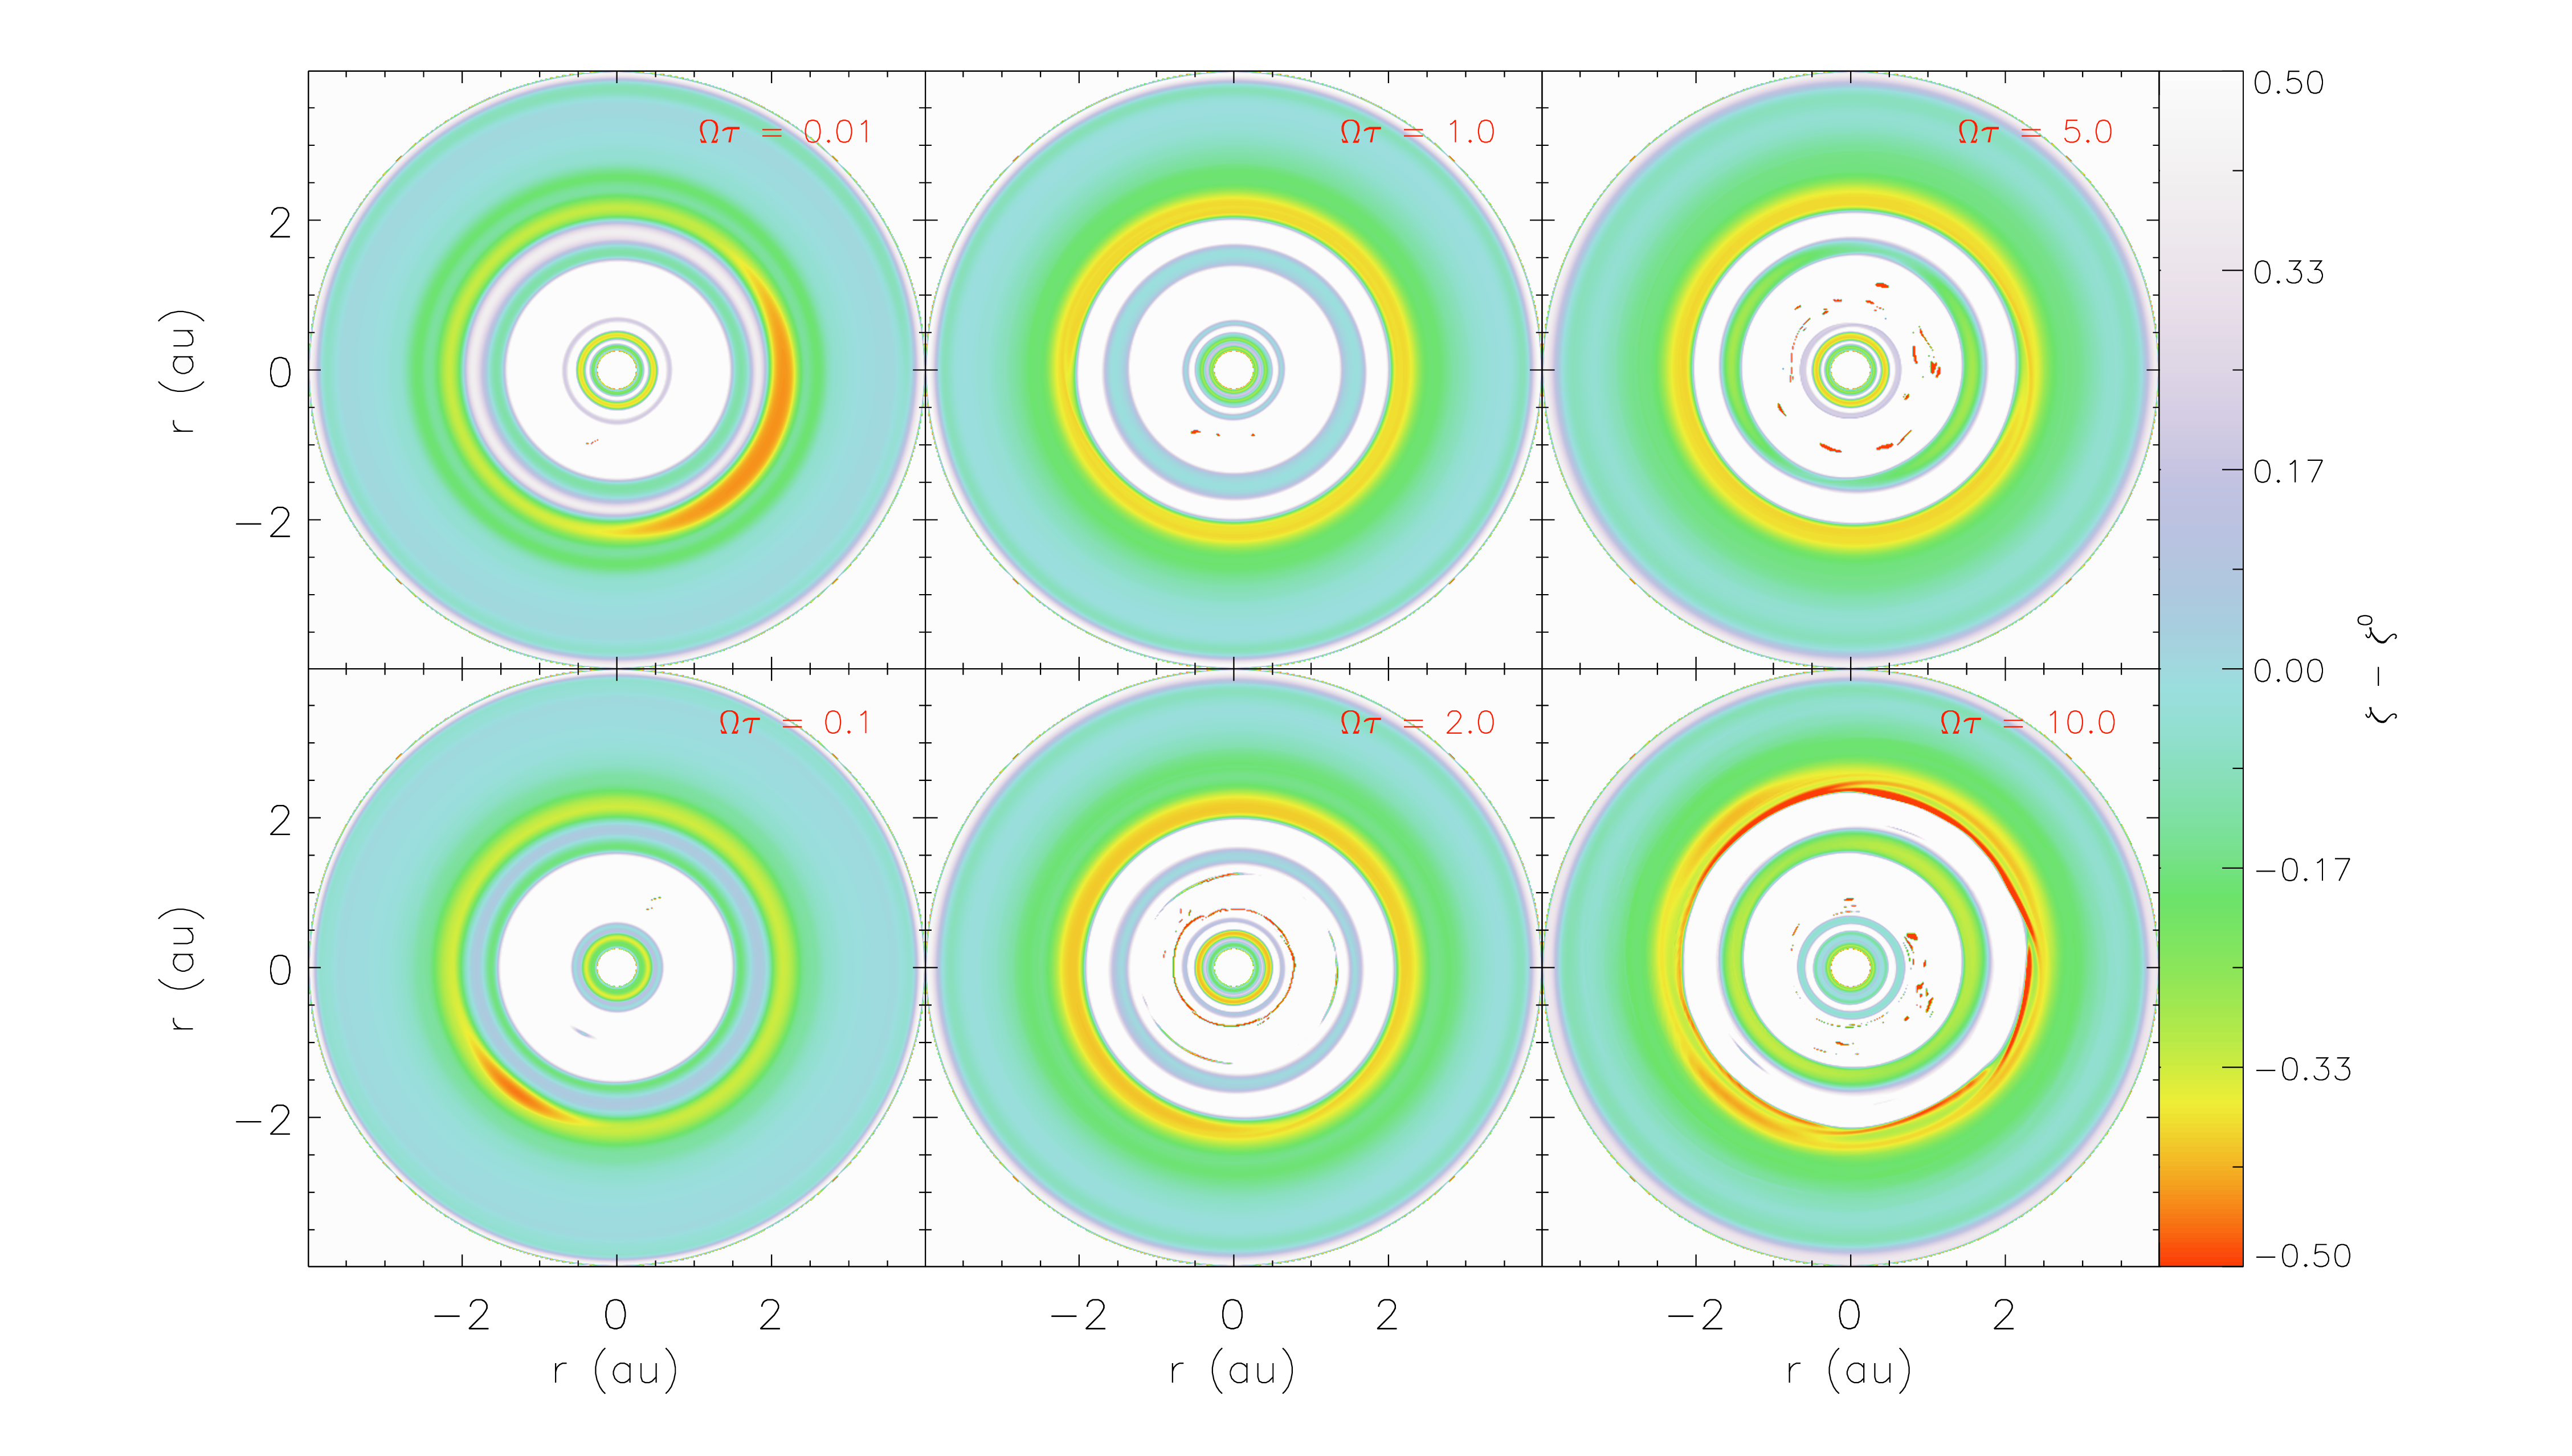
Simulations TR001 and TR01 present a secondary vortex very similar to the primary one. Figure 1 shows the system evolution for TR01. Simulations TR1, TR2, TR5, and TR10 present also a secondary vortex; however, the new vortex is highly spread in the azimuthal direction. Figure 2 shows the potential vorticity at orbits for the different ’s. For , the secondary vortex survives until the end of the simulation; however, the vortex gets spread along the azimuthal direction. For , the secondary vortex survives and does not get spread in the azimuthal direction. For , the secondary vortex is mostly damped by the end of the simulation interval.
3.2. Isothermal Cases
Here we present the results for the isothermal setup and planet masses of and . The simulations labels are presented on Table 1.
The isothermal configuration shows a considerably similar behavior as the models with thermal relaxation. For the ISO1MJ simulation, the sequence of events is the same. We first observe the formation of spiral waves, followed by planet gap opening, and production of small vortices at the outer edge of this gap. The small vortices gather together and merge into a bigger one. A surface density enhancement appears beyond the primary vortex position. Material is accumulated at this location and a second vortex arises, this structure gets spread in the azimuthal direction with time. The primary vortex gets damped and the material in between the planetary gap and the secondary vortex disperses out. The timescales for the events are similar to the ones for the non-isothermal cases.
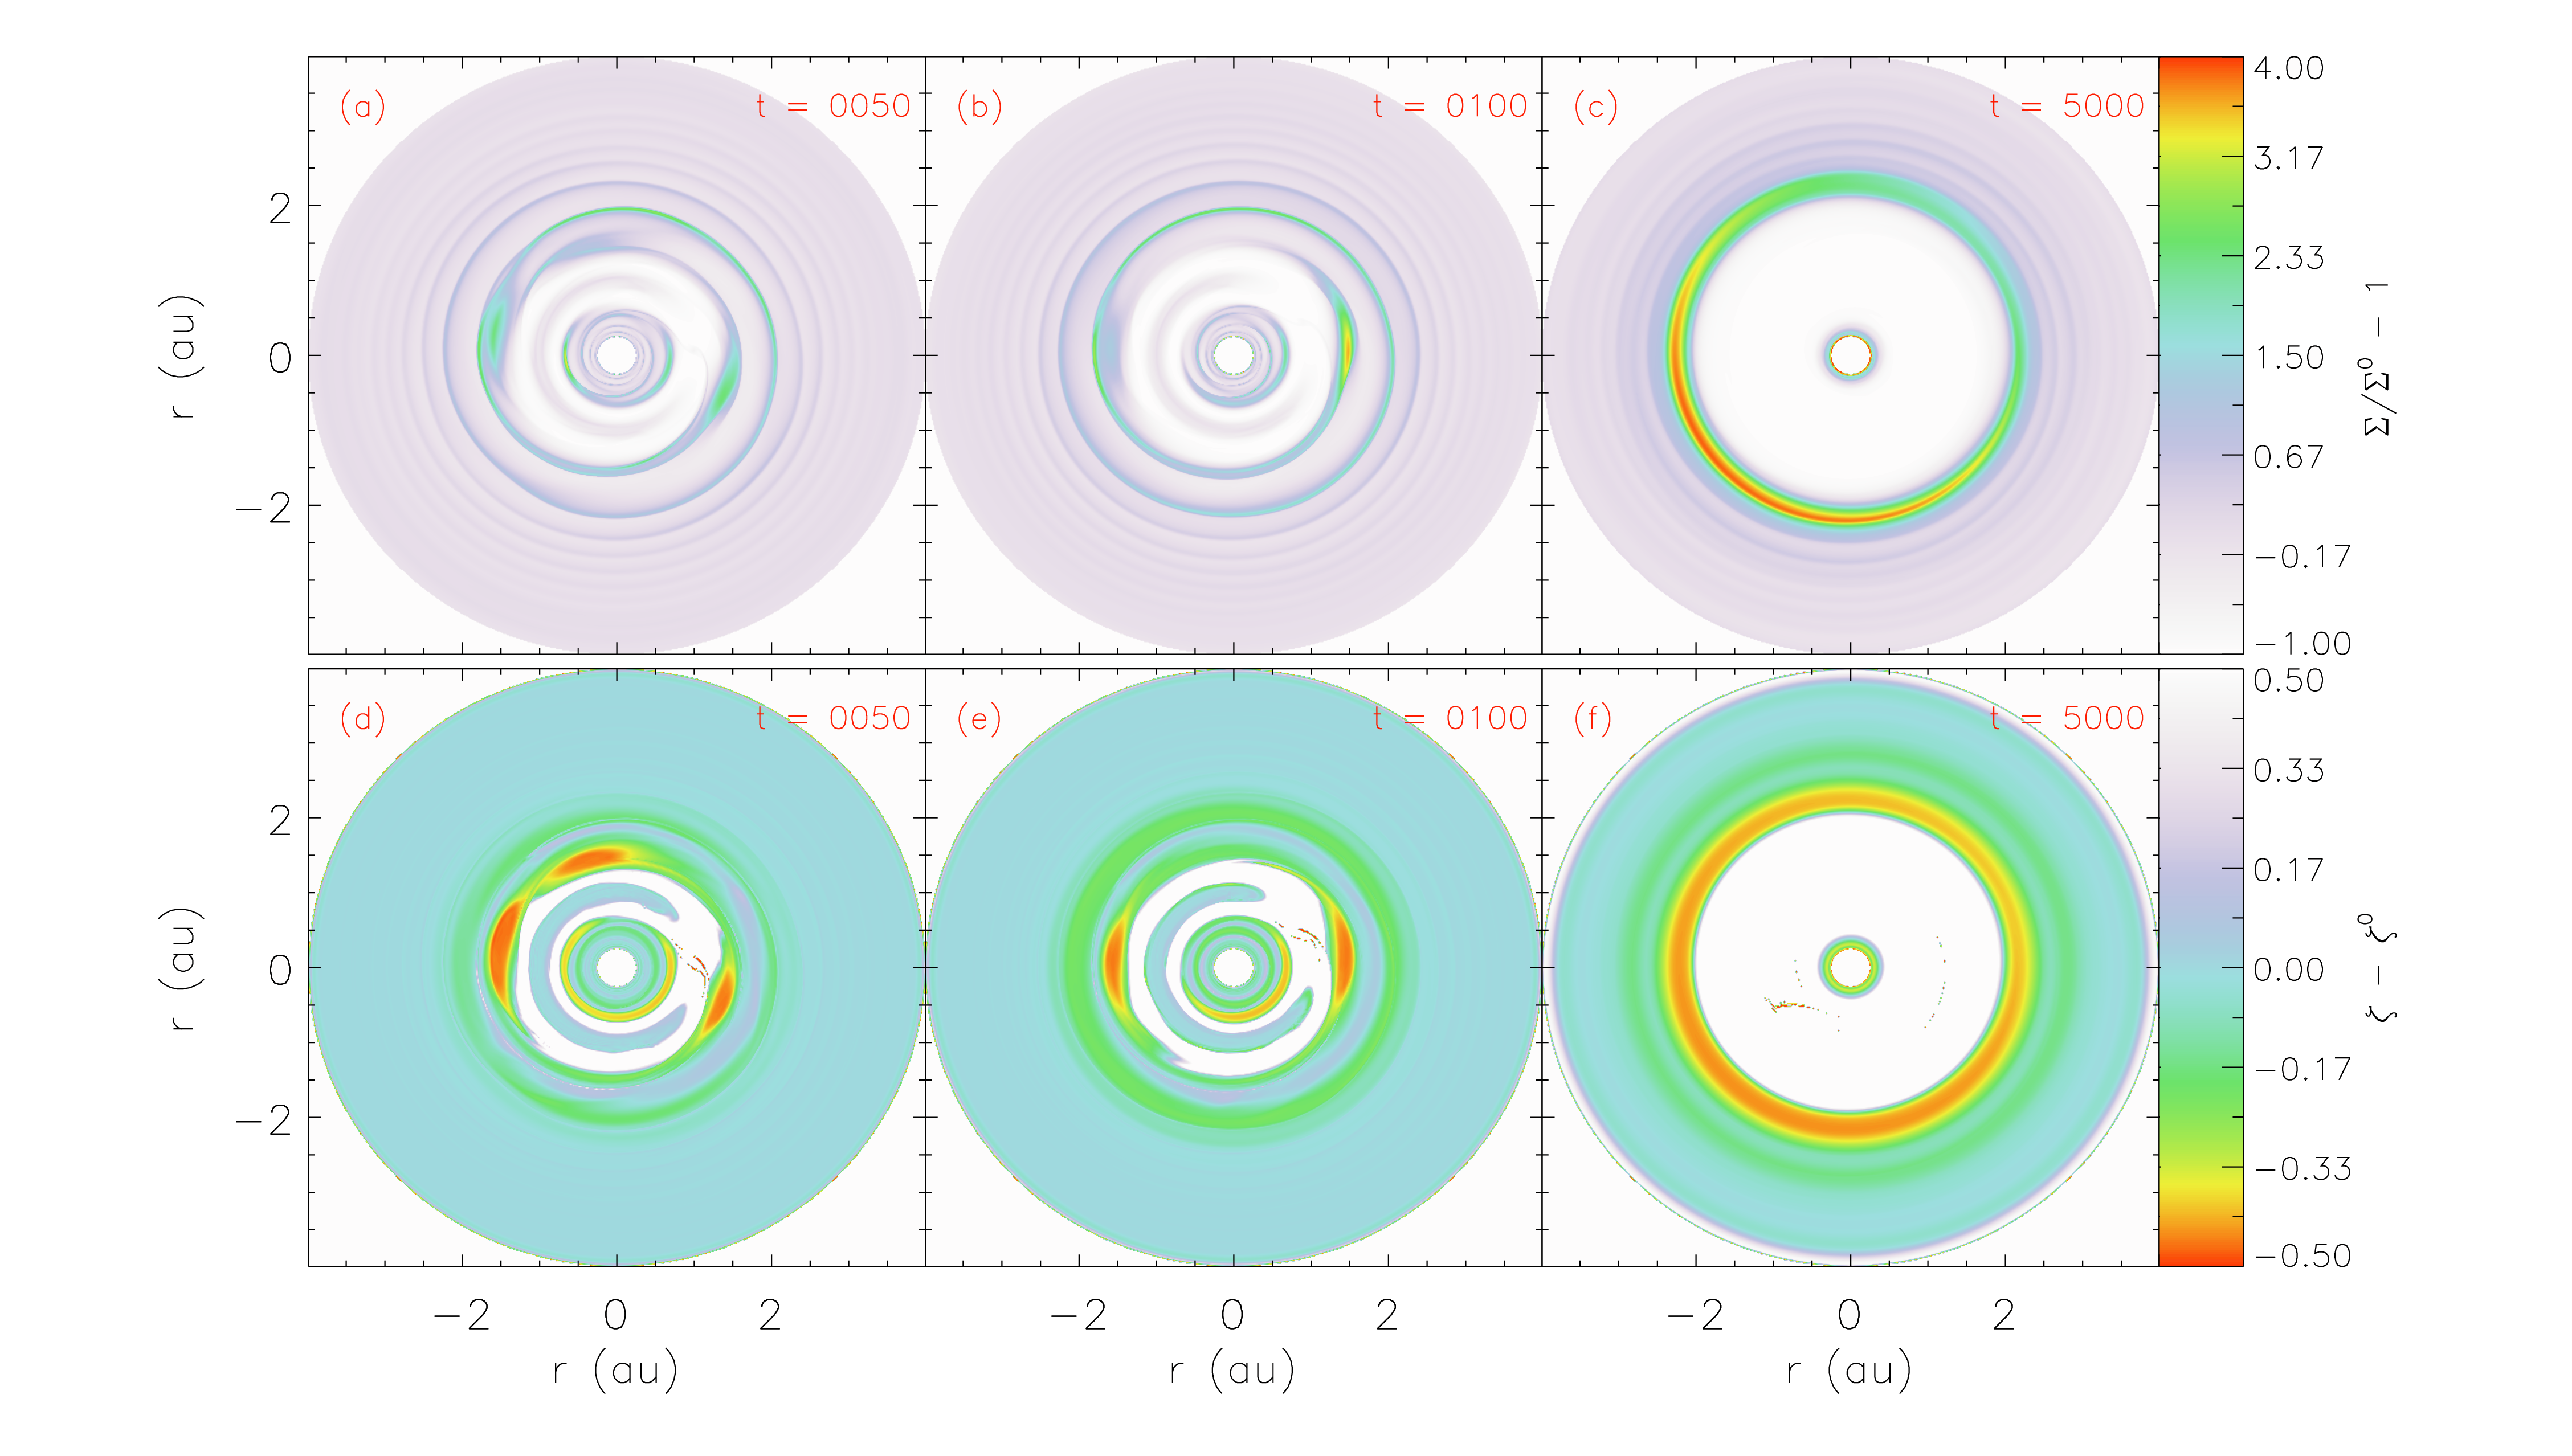
The ISO3MJ simulation presents a similar sequence of events, with the difference that two vortices, that do not merge with time, are created in the outer edge of the planetary gap. The evolutionary timescales for which different structures form are also different. The surface density enhancement appears in hundreds of planetary orbits, instead of thousands. The damping of the primary vortices is also faster. Pile-up of material at the surface density enhancement also happens. Nonetheless, it takes thousands of planetary orbits for a secondary vortex to arise. After a few thousands of planetary orbits the material between the planetary gap and the secondary vortex is totally dispersed out, and a much wider gap is settled. Figure 3 shows the system evolution for simulation ISO3MJ.
It was not possible to consider a higher planet mass (e.g., ) under the setup assumed, because the gap created is much wider, which makes the disk size considered too small. To solve the same structures in a bigger disk, we would need to use more grid cells.
4. Vortex Formation and Evolution
In a protoplanetary disk, we know that vortex formation can happen as a product of the RWI (Lovelace et al., 1999; Li et al., 2000) and/or radial buoyancy (Klahr & Bodenheimer, 2003; Lesur & Papaloizou, 2010; Klahr & Hubbard, 2014). In this work, we considered initially buoyantly unstable disks. Nonetheless, we know that the presence of a planetary gap naturally triggers the RWI, due to the sharp surface density gradient that is created in the gap edges. Hereafter, we discuss the role that the RWI and radial buoyancy played for the formation and evolution of planet-induced vortices. We would like to remember that we are using an inviscid approximation, thus any viscosity in the system is turbulence-triggered viscosity by the hydrodynamical instabilities. We chose to consider an inviscid approximation to assess the direct influence of radial buoyancy and the RWI for the vortices evolution.
4.1. Rossby Wave Instability
The RWI is a pressure driven instability for rotating systems, which is composed of non-axisymmetric modes. The RWI is triggered when there is a local maximum in the radial profile of the function (Lovelace et al., 1999)
| (15) |
where is the potential vorticity999Hereafter, called as instead of . and is an equivalent to the entropy. Physically, this condition can be achieved at the edge of planetary gaps (de Val-Borro et al., 2007) and the edge of dead zones due to sharp viscosity transitions (Lyra & Mac Low, 2012).
The formation of vortices as a product of the RWI has been studied by many authors. The growth rate of the instability for 2D disks was studied by Li et al. (2000) and Umurhan (2010), using different approximations, and in 3D stratified disks by Meheut et al. (2012b) and Lin (2012b). The nonlinear phase of the instability was explored by Meheut et al. (2013). Despite the theory for the RWI was developed for adiabatic disks (Li et al., 2000), most of the works used locally isothermal disks to study the formation and evolution of planet-induced vortices (Balmforth & Korycansky, 2001; de Val-Borro et al., 2007; Lyra et al., 2009a; Lin & Papaloizou, 2011b; Zhu et al., 2014; Fu et al., 2014). Just recently, Les & Lin (2015) made a breakthrough and added an artificial source of cooling and heating to explore the non-isothermal behavior. In this context, our work is a second step to the process of understanding the non-isothermal scenario.
It is not in the scope of this work to make an extensive study of the growth and decay of the RWI, since this matter was already addressed by Les & Lin (2015) for a physical scenario very similar to ours. In order to have just a qualitative insight, we analyzed the spacetime evolution of the potential vorticity () averaged in azimuth. Figure 4 shows the result for simulation TR01.
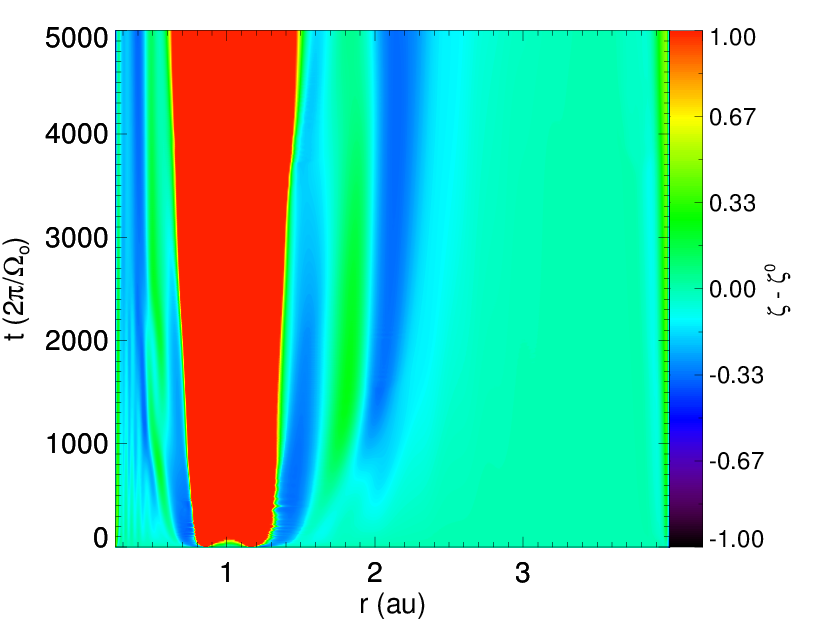
The blue region in Figure 4 represents a minimum in . A minimum in is equivalent to a maximum in (Equation 15), sufficient condition to trigger the RWI. This minimum is achieved in both, the outer edge of the planetary gap and at the surface density enhancement outwards the primary vortex position. Therefore, the RWI has been triggered in both regions. The presence of the minimum is maintained along the whole simulation interval. In the planetary gap edge, its value slowly increases with time, which explains the vortex decay. In the surface density enhancement outwards the primary vortex position, its value is kept slightly constant with time, which explains the survival of the secondary vortex until the end of our simulation. The spacetime evolution of is similar for all the cases. A local minimum is observed in the regions of the primary and secondary vortices. The main differences are the size of the blue regions (local minimums), the time the local minimum related the primary vortex starts to decay, and the time the local minimum related to the secondary vortex appears.
4.2. Radial Buoyancy
The necessary ingredients for a CO and SBI are: (i) radial pressure and entropy gradients possessing the same sign (radial buoyancy) and (ii) thermal relaxation, with maximum amplification for . The formation of vortices due to the BI was first observed by Klahr & Bodenheimer (2003). Further studies by Petersen et al. (2007a, b) showed the importance of thermal relaxation for baroclinic vortex amplification. They found that thermal relaxation or diffusion, besides entropy gradient, are required to keep the instability in action. Lesur & Papaloizou (2010) studied baroclinic vortex amplification through the growth of existing vortical perturbations. In order to not cause confusion between the generation of vortices by the classical BI and amplification of the vortices in a radial buoyant fluid, they coined this process a SBI. A parametric study covering the important ranges of entropy gradients, thermal diffusion timescales, and thermal relaxation timescales for PPDs was carried out by Raettig et al. (2013). They showed the importance of baroclinic effects even for small entropy gradients, which is the case in PPDs. Klahr & Hubbard (2014) found a linear amplification of epicyclic oscillations in radially stratified and vertically unstratified disks, which they called convective overstability. This phenomenon can be regarded as the linear phase of the SBI. Yet not much efforts were made to study how vortex formation and amplification proceeds in a buoyantly unstable disk with a high mass planet embedded. Les & Lin (2015) discussed briefly whether an axisymmetric instability was at play in their simulations of planet induced vortices; however, they concluded that only the RWI was in action.
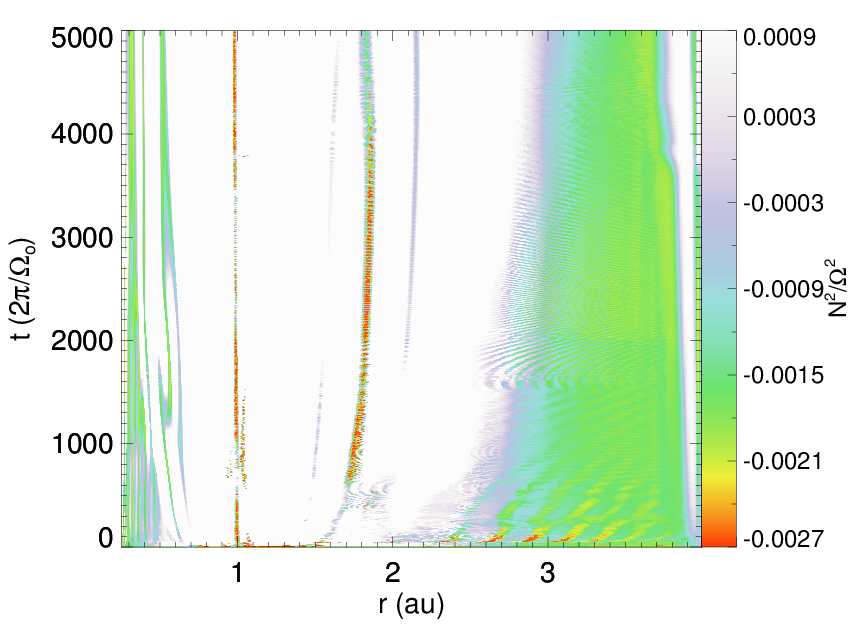
We can quantify the radial stability in a disk with regards to convection through the Brunt-Väisälä frequency (), which is given by (Raettig et al., 2013)
| (16) |
where is the pressure gradient, is the entropy gradient, and is the angular velocity. Positive values of indicate stability. The entropy gradient for a 2D vertically integrated disk is given by
| (17) |
where is the temperature gradient and is the surface density gradient. We made the choice for the initial surface density and sound speed gradients in a way that it gives an initial negative value for equals to , thus favoring instability.
Figure 5 shows the spacetime evolution of averaged in azimuth for simulation TR01. We plot instead of , to eliminate the dependence with the angular velocity. Since is always positive, still indicates stability. We can see that in the outer disk is kept negative and roughly equals to its initial value, with exception for the outer boundary. The outer radial extent with negative becomes narrower throughout the simulation interval, thus the evolution of the system tends to stabilize the disk with respect to buoyancy. In the gap region and outer gap wall, becomes positive after a few tens of planetary orbits; however, there is a strip around the primary vortex position with smaller values of . The strip’s center possesses negative in the first tens of planetary orbits, but turns positive later on. From orbits, becomes negative again in the central position of the vortex. The region with negative is not as large as the vortex size, thus buoyancy is not playing a major role for the evolution of the primary vortex. is positive in the region where the second generation of vortex appears, until the time that the secondary vortex arises and a strip with negative appears around the secondary vortex position. Once more, the strip width is smaller than the vortex size, indicating that buoyancy may not be playing a major role in the location of the vortex.
The behavior of for the other cases is similar to the one of TR01, with exception for TR001 and the isothermal cases. For them, becomes positive in the first tens of planetary orbits and remains positive along the whole simulation interval. This indicates that buoyancy does not play any role for the quasi-isothermal and isothermal cases. Reinforcing the findings of Petersen et al. (2007a, b), in the lack of thermal relaxation or diffusion, buoyancy is not sustained. For , the strip around the position of the primary vortex has negative during a larger fraction of the primary vortex lifetime. The strip around the secondary vortex is wider, indicating that buoyancy had more importance for the secondary vortex evolution than in the case that .
To check the impact that buoyancy has in the results, we used a model where the initial is positive. We run the new simulation with the same physical and numerical setup as for the TR01 case, but changing the surface density gradient from to . The general evolution of the system was very similar to the case where is initially negative. Two major differences were noticed. The first is regarding the maximum amplitudes that the primary and secondary vortices achieve, which is higher for the case where is initially positive. The second is regarding the second generation of vortices. For the case, two vortices arise in the surface density enhancement region and take more time to merge ( orbits against orbits for the reference case). The secondary merged vortex has also an aspect ratio much smaller than the secondary vortex for the case. Figure 6 presents a comparison of the surface density profiles for the positive and negative cases, for two different points in time ( orbits and orbits).
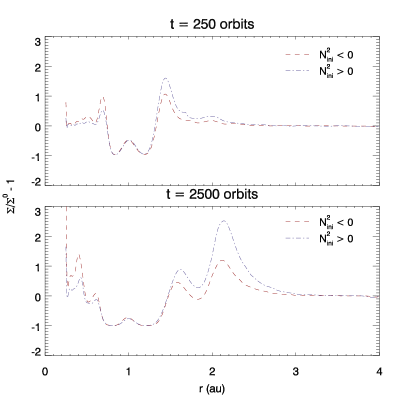
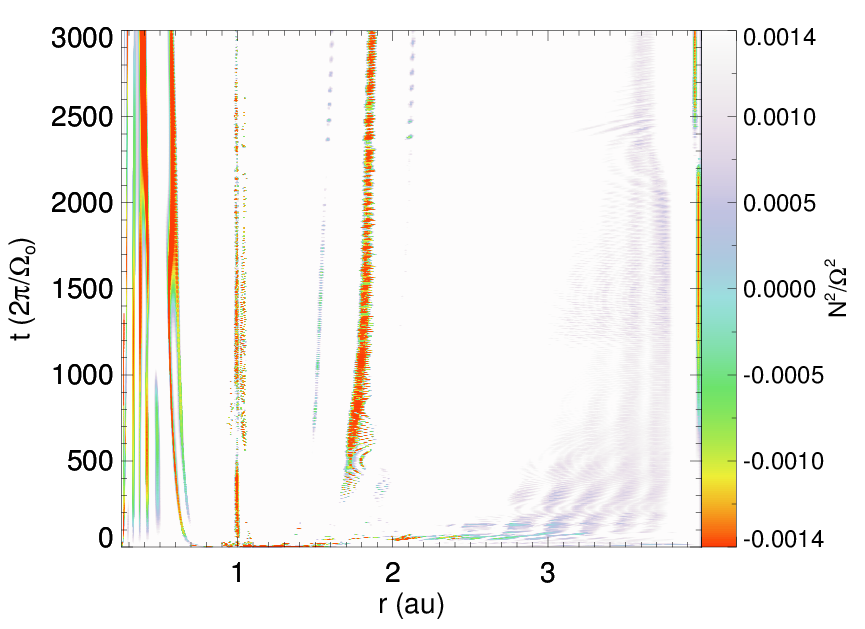
The planetary gap structure is very similar for the different surface density slopes, the same width and lower level for the depth are observed, as well as the same location for the maximum and minimum surface density perturbations. The standing difference is the sharpness of the surface density gradient in the planetary gap edge and at the surface density enhancement beyond the primary vortex position. A larger gradient produces stronger vortices, therefore the vortices for are stronger. The times chosen to compare the cases represent a moment the vortices are totally merged. The spacetime evolution of for (Figure 7) shows that becomes negative in the first tens of orbits in the region where the primary vortices arise; however, it becomes positive again and local buoyancy disappears for hundreds of orbits, becomes negative again from orbits. The strip with negative around the vortex position is again not as wide as the vortex size, indicating that buoyancy is not playing a major role for the evolution of the primary vortex. Nonetheless, this shows that initially buoyantly stable disks can undergo an inversion of sign for the entropy gradient, therefore turning on instability. In the secondary vortex region, never turns to be negative. The RWI is the only responsible for the formation and sustenance of the secondary vortex.
This result demonstrates that when we have the RWI and buoyancy acting at the same time, weaker vortices are produced. Therefore, buoyancy opposes vortex amplification and survival, in this scenario. Taking into account that these processes provide viscosity to the system, once we have both in action more viscosity is produced. More viscous disks carve out smoother gaps, leading to the weaker vortices. It should also be noticed that for , the secondary vortices get damped during the simulation interval, those are also the cases for which buoyancy plays some role for the secondary vortex evolution.
5. Code Control
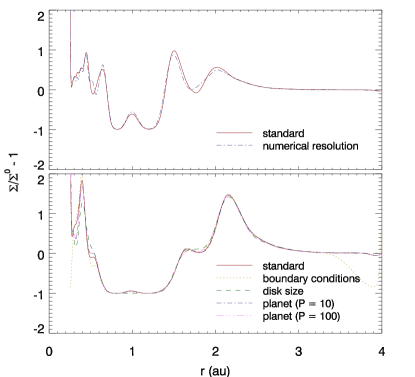
In this section, we explore the numerical factors that could influence the physical validity of our simulations. The tests were done using the TR01 case as reference. The physical conditions and numerical setup were exactly the same as for TR01, varying only what we following mention. We checked the convergence of the results considering a higher numerical resolution. We analyzed whether our reflecting boundary conditions for the radial direction may have reflected waves, influencing the evolution of the system. A different way to prevent boundary effects is to push the outer disk to a larger radius, hence we also used this approach to check whether the disk size influenced the results. Lastly, we added the planet along a larger number of planetary orbits to analyse whether the initial planet disturbance could have been too large, generating fake effects.
For the numerical resolution test, we doubled the resolution from (, ) = (512, 1024) to (, ) = (1024, 2048). The temporal evolution was taken up to 1000 planetary orbits. The full temporal evolution was not checked, because the doubled resolution is numerically highly expensive. For the boundary conditions test, we first changed the inner and outer radial boundary conditions from reflective to non-reflective, second we considered a larger disk extending from 0.25 AU to 8 AU. Finally, aiming to check the effect of the initial planet disturbance to the disk, we made two tests: slowly adding the planet along its first 10 and 100 orbits, following Equation 9, in the reference case the planet was slowly added along its first orbit. The temporal evolution for the last four tests was taken up to 5000 planetary orbits.
We compare our test cases with the reference case using their surface density profiles at the latest snapshot. Figure 8 presents these profiles for orbits (numerical resolution comparison) and orbits (other comparisons). We observed a good agreement for the surface density profiles, indicating that the simulation results were not much influenced by these factors. Nonetheless, for the resolution test, the outer gradient that leads to the second generation of vortices is slightly smoother than for the standard case.
For the boundary condition test, in the outer disk ( AU) the material is emptied out, due to the boundary choice; however, the main results agree with the standard case. The major difference is regarding the secondary vortex, for the standard case a secondary merged vortex is created, in this case two secondary vortices are created and they do not merge until the end of the simulation. The two secondary vortices, for the non-reflecting radial boundaries, are right opposite to each other in the azimuthal direction and they have about the same strength. We speculate that the flow in the corotation region of these vortices is not being able to push them together, exactly because the vortices have same strength and are located right opposite to each other, leading to a stable configuration. For the larger disk size, the standing difference is regarding the local minimum between the surface density bumps, where the primary and secondary vortices sit. For the standard case, the local minimum is still present by the end of the simulation. For the larger disk size, this local minimum has disappeared by the end of the simulation, meaning that the matter is dissipating slightly faster.
For the planet being added along the first 10 orbits, the primary small vortices merge in a faster timescale, and the vortices amplitudes take a longer time to grow than for the standard case. For the planet being added along the first 100 orbits, the vortices amplitudes take also a longer time to grow than for the standard case. Higher planet masses can excite stronger vortices (Fu et al., 2014), thus when the planet perturbation is added slower, the vortices will also take a longer time to grow.
6. Second Generation of Vortices
The most interesting result of our simulations is the second generation of vortices. A surface density enhancement was observed beyond the primary vortex position for all the cases. This bump is strong enough to trigger the RWI outside the primary vortex radius and to form a second generation of vortices. As it was discussed before, we observe a minimum for in the region of the secondary vortex for all the cases. Also, there are strips of negative in the region of the secondary vortex, with exception for the TR001 and the isothermal cases. Once more, the action of the RWI together with buoyancy controls the vortex evolution. For the TR001 and isothermal cases, the RWI is solely responsible for the secondary vortex. We already established that our results were not affected by the choice of boundary conditions, resolution, or the planet perturbation being too sharp. Therefore, it confirms the physical origin of the second generation of vortices. No further density enhancement (strong enough to keep triggering the RWI) beyond the secondary vortex position was observed, even for the test simulation with a larger disk, thus we do not expect a third generation of vortices.
6.1. The Origin of the Secondary Vortex
Accumulation of mass is observed at the inner boundary for all the cases. Our understanding is that the primary vortices produce an effective -viscosity that is large enough to induce accretion in the disk in the timescales we simulate. Therefore mass is flowing from the region of the primary vortex to the inner disk. The depletion of mass in the orbit of the primary vortex position looks like a gap carved out by the primary vortex. In fact, the outer wall of the planetary gap is moving outwards due to this depletion of mass. For instance, for the ISO3MJ case, by the end of our simulation all the mass in the orbit of the primary vortex was already depleted and the planetary gap became wider in its outer side. Figure 9 presents the inner disk mass as a function of time for simulation TR01, where the increase of the mass is demonstrated.
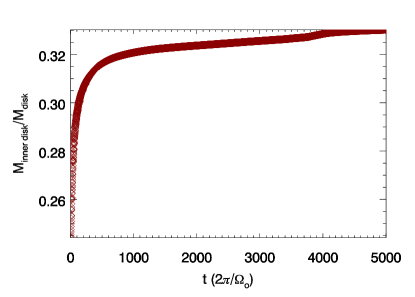
The faster mass increase happens in the first tens of orbits, when the planet still carving out its gap. During this period, the mass increase is mostly due to the planetary gap opening process. The inner disk mass is being pushed from AU to the inner parts of the disk. For orbits, the mass increase is most likely due to accretion induced by the primary vortex. Our simulations assumed an inviscid disk, therefore any viscosity is produced by the hydrodynamical instabilities, which in this case could be named a vortex-induced viscosity. We can obtain an estimate of the -parameter, using the component of the Reynolds stress and the local sound speed (Flock et al., 2011). For simulation TR01, the -parameter averaged in space and time (until the time the secondary vortex appears) was , a value in the range of what is typically obtained by the MRI, (Dzyurkevich et al., 2010). The other simulations presented values in the range from , in agreement with MRI. The lowest value obtained was , for TR1, and the highest value was , for TR5. Large-scale vortices are able to transport angular momentum outwards, because a negative angular momentum flux is obtained from the balance between the angular momentum carried by Rossby waves in the inner and outer sides of a surface density bump (Meheut et al., 2012b).
In this work we assumed that the barycenter of the system is located at the star’s center. This approximation could influence the gap structure, since the Lagrange point L3, in the corotation region of the planet, is removed. Changes in the gap structure may affect the primary vortex generation, subsequently possibly impacting the second generation of vortices. This assumption summed to the inviscid disk approach are two factors that could influence the formation of a second generation of vortices. We suggest that further studies should check these factors.
6.2. Pressure Bumps
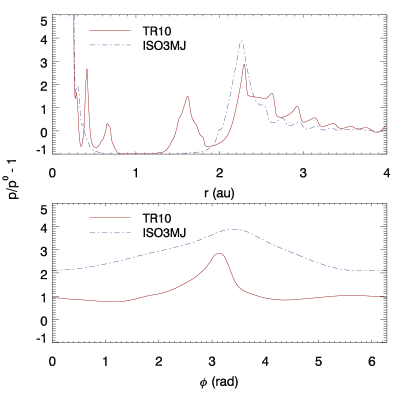
Vortices are able to trap dust particles, because they are local pressure bumps. The particles are attracted to the highest pressure region, thus to the vortex center. The secondary vortex becomes extensively spread in the azimuthal direction for and . In order to make sure that these nonaxisymmetric structures can still trap dust particles, we checked their pressure profiles. Figure 10 shows a radial cut of the pressure for equals to the vortex center and an azimuthal cut of the pressure for equals to the vortex center. We show the cases of and , since these are the simulations that present the most spread vortices in the azimuthal direction. We can observe a pressure bump in both radial and azimuthal directions; however, in the azimuthal direction the bump of ISO3MJ is very smooth. Birnstiel et al. (2013) showed that a very smooth pressure bump in the azimuthal direction is still sufficient to trap mm and cm particles in the vortex center. Therefore the secondary vortices should be able to trap dust particles, leading to an asymmetric global dust distribution.
6.3. Oph IRS 48
The system Oph IRS 48 is a good candidate to host a vortex-like structure induced by a planet (van der Marel et al., 2013). The continuum emission ALMA observations at mm revealed a high-contrast asymmetry in the disk of this system, which was interpreted as existing due to the presence of an anticyclonic vortex (van der Marel et al., 2013). Besides, this system shows a central cavity in CO line observations, which was explained as a gap opened by a massive planet (Brown et al., 2012). van der Marel et al. (2013) ran a FARGO simulation considering the parameters of this system to get the gas density distribution. Later on the result from the HD simulation was used as the initial condition in a dust evolution code to get the expected continuum emission. They were able to roughly reproduce the ALMA observation; however, there is a debate regarding the location of the vortex. If the planet is located at AU, the vortex is expected to be located at most at AU, nonetheless it is located at AU.
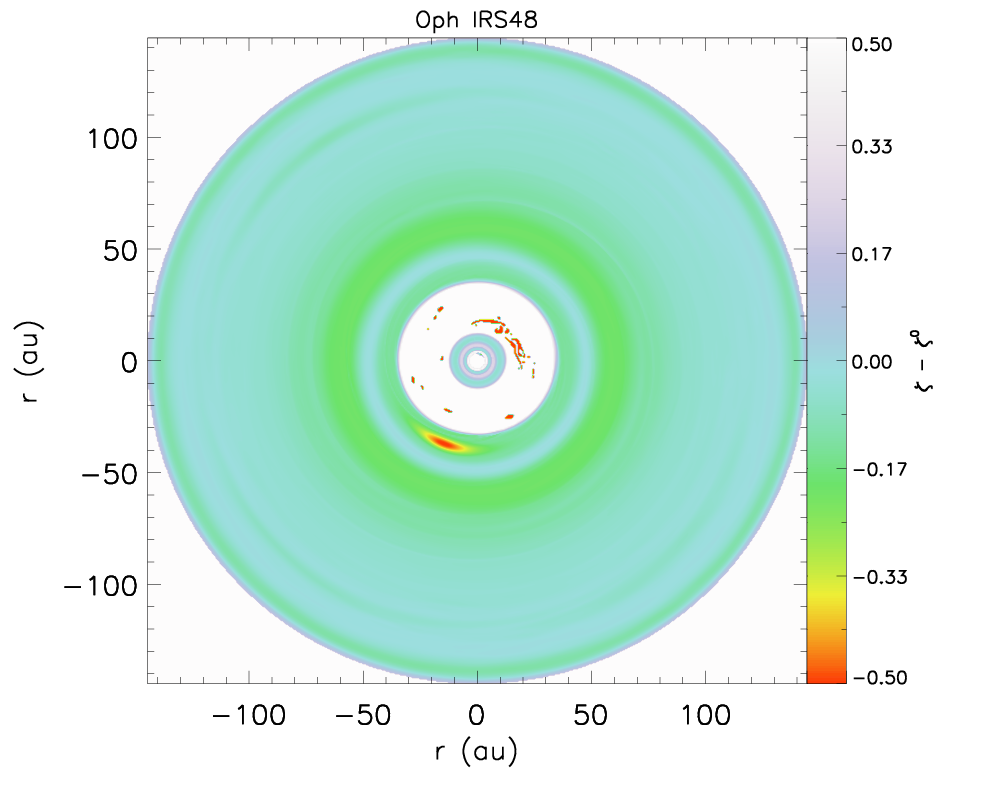
We run a simulation using the same setup as van der Marel et al. (2013), with the difference that here no viscosity was included, but instead we used thermal relaxation, and initialized the disk with constant. We observed vortex formation at the outer edge of the planetary gap, the vortex position is roughly AU; however, we did not observe a second generation of vortices. The disk considered was much larger (from to AU) than the one of our benchmark cases (from to AU), therefore the resolution may not have been sufficient to solve the secondary vortex. Figure 11 shows the potential vorticity for this simulation after planetary orbits. We can see that is negative around AU, therefore a secondary vortex could be formed in that region.
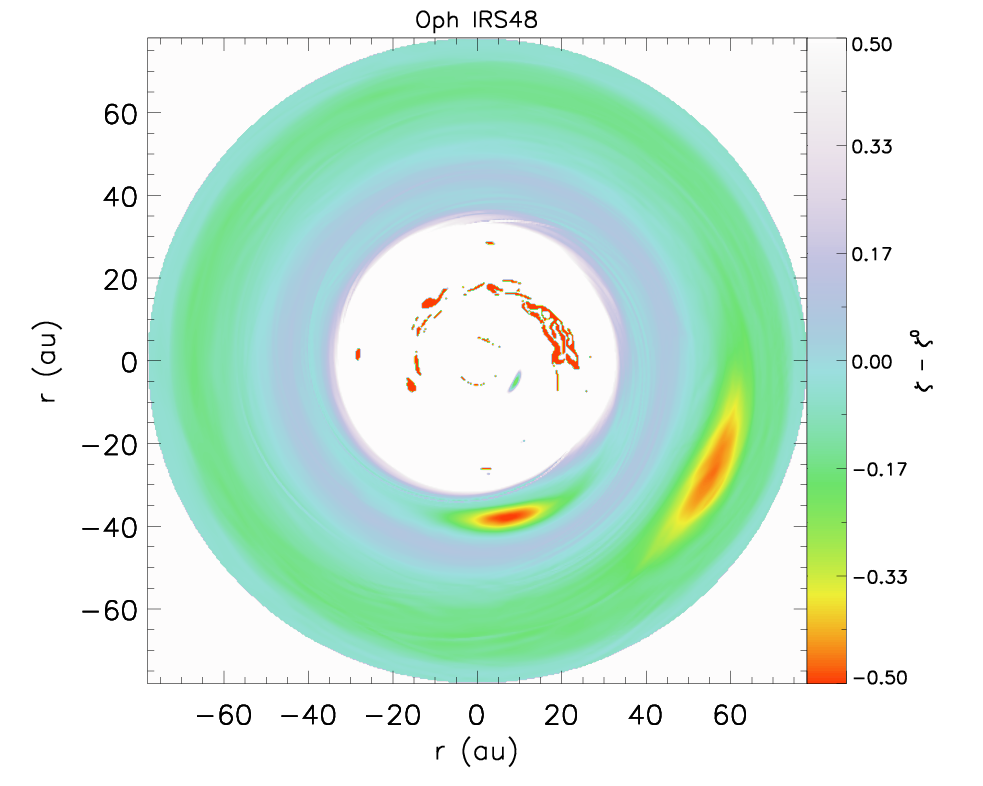
The ratio between the positions of the secondary and primary vortices in our benchmark cases is about . If this ratio is fixed, the second generation of vortices in the Oph IRS 48 system would be located at AU. In order to check whether the secondary vortex was not observed due to a numerical resolution problem, we run a second simulation considering the same planet-disk setup as before, but integrating over a smaller disk size. We fixed the inner and outer disk radius, in order to maintain the same ratio between the planet orbital distance and the boundaries as for the benchmark cases. The new simulation has a disk ranging from AU to AU. Figure 12 shows the potential vorticity for the smaller disk size after planetary orbits. Here, we can see the formation of a secondary vortex, located at AU, indicating that in the previous case the numerical resolution was indeed not sufficient. This new result is a promising explanation for the location of the Oph IRS 48’s vortex, assuming a single planet at AU distance from the star. It is also important to mention that at planetary orbits, the primary and secondary vortices are present. The benchmark cases show that the primary vortex get damped before the secondary one, thus for later times, just the secondary vortex may be present.
7. Vortex Lifetimes and Birth Times
In this section we obtain the primary vortex lifetime and secondary vortex birth time as a function of the thermal relaxation timescale. For this purpose, we first had to define when the vortex is born. Once an overdensity with negative potential vorticity arises, we declare that this overdensity is a vortex. We define as overdensity a region that possesses an average surface density at least higher than the average background surface density.
The center of the vortex was defined as the position of the maximum surface density. We determined the vortex edge by looking to the position where the potential vorticity drops to below its value at the vortex center. This procedure was done in both radial and azimuthal directions. Knowing the dimensions of the vortex, we could calculate the average surface density and potential vorticity inside the vortex.
The procedure of finding the vortex and defining its border was done until the time that the vortex can not be defined as an overdensity anymore. Once this criterion was reached we defined the vortex as dead. In this way, the vortex lifetime was defined as the difference between the time it is born and the time it dies.
Figure 13 presents the primary vortex lifetime as a function of the different thermal relaxation timescales. We observe a nonmonotonic behavior that was already seen by Fu et al. (2014) and Les & Lin (2015). Les & Lin (2015) explained that the nonmonotonic behavior is due to the fact that the vortex lifetime depends on (i) the decay timescale of the RWI, which decreases for increasing , and (ii) the vortex growth time, which increases for values of up to and then decreases for larger values. The nonmonotonic nature is a result of this double dependence. The double peak, featuring at small ’s and , is due to the nonmonotonic behavior of the vortex growth time for different ’s. Higher disk temperatures favors the RWI (Li et al., 2000; Lin, 2012a), nevertheless this effect seems to be important just for larger ’s. The dependence of the vortex lifetime with the vortex growth time comes to the fact that once the vortex amplitude is very large, it begins to induce shocks, thus the vortex looses energy through shock dissipation and starts to decay. The inviscid approximation may have influenced the estimation of the vortex lifetimes, since it is inversely dependent on the viscosity magnitude (de Val-Borro et al., 2007; Ataiee et al., 2013; Fu et al., 2014). Nonetheless, it is clear that it did not influence the qualitatively behavior of vortex lifetimes as a function of thermal relaxation timescales, since our results are in agreement with Fu et al. (2014) and Les & Lin (2015).
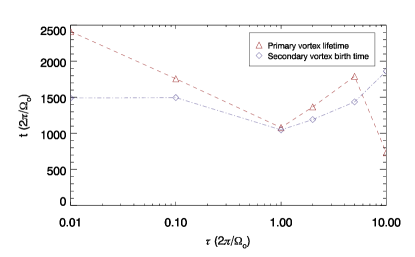
We also plot in Figure 13 the time when the secondary vortex is born. A nonmonotonic behavior is also observed and the curves are shifted by a few hundreds of planetary orbits, with exception for . Since the primary vortex is born in a scale of tens of planetary orbits, it is clear that the secondary vortex is always born before the death of the primary vortex, again with exception for . The time taken for the secondary vortex to be born is correlated to the time that the primary vortex needs to deplete the mass on its orbit. Therefore it depends on the vortex growth time and the accretion rate generated by the primary vortex. This explains the inverse dependence of the secondary vortex birth time and primary vortex growth time as a function of the thermal relaxation time scale.
8. Summary and Conclusions
Vortices can be formed as a product of the RWI and/or radial buoyancy (BI/SBI/CO). The RWI can be triggered in the walls of a planetary gap due to a sharp surface density gradient. The disk is buoyantly unstable when the pressure and entropy gradients have the same sign, a thermal relaxation of the order of also favors vortex amplification. We carried out global 2D-HD simulations of planet-disk interactions, using the PLUTO code. The aim was to study the long-term evolution of planet-induced vortices in inviscid disks and initially buoyantly unstable, considering several thermal relaxation timescales. Thermal relaxation is an important ingredient to sustain radial buoyancy (Petersen et al., 2007a, b). It has also a strong impact on amplifying and damping vortices.
We found that radial buoyancy smoothen the surface density gradients in the wall of a planetary gap, which generates weaker vortices. In this particular physical scenario, radial buoyancy operates against vortex amplification and survival. This effect is less pronounced for the isothermal and quasi-isothermal states (), which is expected, since thermal relaxation is a required ingredient to sustain radial buoyancy. The qualitative system evolution is similar for different thermal relaxation timescales and different planet masses. The major difference is regarding the timescales of events (e.g., time required for vortex damping and mass transfer).
The most interesting result from our simulations was the formation of a second generation of vortices. The primary vortex creates an effective -viscosity that is large enough to induce accretion. We obtained -values in the range , which agrees with what is obtained by the MRI (Dzyurkevich et al., 2010). The accretion process depletes the mass in the primary vortex orbit, creating a density enhancement outwards the vortex position. This bump is sufficient to trigger the RWI, leading to the secondary vortex formation. This result is a promising explanation for the location of the vortex in the Oph IRS 48 system (van der Marel et al., 2013), which is located at AU. Previous models predicted that the vortex location could be at most at AU, assuming a single planet at AU. Our model suggests that a second generation of vortices can be formed at AU, if a massive planet () is assumed at AU. We suggest that further works should test the formation of a second generation of vortices in non-inviscid disks and considering a proper treatment of the system’s barycenter location, since these factors may influence the generation and sustenance of vortices.
We observed a nonmonotonic behavior for the vortex lifetime as a function of the thermal relaxation timescale. This result was already observed by Fu et al. (2014) and Les & Lin (2015). The vortex lifetime depends on the decay of the RWI and the vortex growth time. The former decreases as a function of the thermal relaxation timescale. The latter increases as a function of the thermal relaxation timescale up to , decreasing for larger ’s. The nonmonotonic behavior and double peak observed for the vortex lifetime is a result of this double dependence. The birth time of the secondary vortex also presents a nonmonotonic behavior. The appearance of the secondary vortex is correlated to the time the primary vortex needs to deplete the mass on its orbit. Therefore it is linked to the primary vortex growth time and the accretion rate generated by it. It is important to remember that we considered an inviscid disk. Previous works have shown that the vortex lifetime is inversely dependent on the viscosity magnitude (de Val-Borro et al., 2007; Ataiee et al., 2013; Fu et al., 2014). All the viscosity in our models is turbulence-triggered by the hydrodynamical instabilities. The inviscid approximation may have quantitatively changed the vortices lifetimes; however, it did not change the qualitative behavior of vortices lifetime as a function of thermal relaxation timescales.
References
- Ataiee et al. (2014) Ataiee, S., Dullemond, C. P., Kley, W., Regály, Z., & Meheut, H. 2014, A&A, 572, A61
- Ataiee et al. (2013) Ataiee, S., Pinilla, P., Zsom, A., Dullemond, C. P., Dominik, C., & Ghanbari, J. 2013, A&A, 553, L3
- Balbus & Hawley (1991) Balbus, S. A., & Hawley, J. F. 1991, ApJ, 376, 214
- Balmforth & Korycansky (2001) Balmforth, N. J., & Korycansky, D. G. 2001, MNRAS, 326, 833
- Barge & Sommeria (1995) Barge, P., & Sommeria, J. 1995, A&A, 295, L1
- Birnstiel et al. (2013) Birnstiel, T., Dullemond, C. P., & Pinilla, P. 2013, A&A, 550, L8
- Bracco et al. (1999) Bracco, A., Chavanis, P. H., Provenzale, A., & Spiegel, E. A. 1999, Physics of Fluids, 11, 2280
- Brown et al. (2012) Brown, J. M., Herczeg, G. J., Pontoppidan, K. M., & van Dishoeck, E. F. 2012, ApJ, 744, 116
- Casassus et al. (2013) Casassus, S., Hales, A., de Gregorio, I., & et al, . 2013, A&A, 553, A64
- de Val-Borro et al. (2007) de Val-Borro, M., Artymowicz, P., D’Angelo, G., & Peplinski, A. 2007, A&A, 471, 1043
- Dzyurkevich et al. (2010) Dzyurkevich, N., Flock, M., Turner, N. J., Klahr, H., & Henning, T. 2010, A&A, 515, A70
- Flock et al. (2011) Flock, M., Dzyurkevich, N., Klahr, H., Turner, N. J., & Henning, T. 2011, ApJ, 735, 122
- Flock et al. (2015) Flock, M., Ruge, J. P., Dzyurkevich, N., Henning, T., Klahr, H., & Wolf, S. 2015, A&A, 574, A68
- Fu et al. (2014) Fu, W., Li, H., Lubow, S., & Li, S. 2014, ApJ, 788, L41
- Fukagawa et al. (2013) Fukagawa, M., Tsukagoshi, T., Momose, M., & et al, . 2013, PASJ, 65, L14
- Gammie (1996) Gammie, C. F. 1996, ApJ, 457, 355
- Inaba & Barge (2006) Inaba, S., & Barge, P. 2006, ApJ, 649, 415
- Isella et al. (2013) Isella, A., Pérez, L. M., Carpenter, J. M., Ricci, L., Andrews, S., & Rosenfeld, K. 2013, ApJ, 775, 30
- Juhász et al. (2015) Juhász, A., Benisty, M., Pohl, A., Dullemond, C. P., Dominik, C., & Paardekooper, S.-J. 2015, MNRAS, 451, 1147
- Klahr & Bodenheimer (2006) Klahr, H., & Bodenheimer, P. 2006, ApJ, 639, 432
- Klahr & Hubbard (2014) Klahr, H., & Hubbard, A. 2014, ApJ, 788, 21
- Klahr & Kley (2006) Klahr, H., & Kley, W. 2006, A&A, 445, 747
- Klahr & Bodenheimer (2003) Klahr, H. H., & Bodenheimer, P. 2003, ApJ, 582, 869
- Kley & Dirksen (2006) Kley, W., & Dirksen, G. 2006, A&A, 447, 369
- Kley et al. (2012) Kley, W., Müller, T. W. A., Kolb, S. M., Benítez-Llambay, P., & Masset, F. 2012, A&A, 546, A99
- Koller et al. (2003) Koller, J., Li, H., & Lin, D. N. C. 2003, ApJ, 596, L91
- Les & Lin (2015) Les, R., & Lin, M.-K. 2015, MNRAS, 450, 1503
- Lesur & Papaloizou (2010) Lesur, G., & Papaloizou, J. C. B. 2010, A&A, 513, A60
- Li et al. (2000) Li, H., Finn, J. M., Lovelace, R. V. E., & Colgate, S. A. 2000, ApJ, 533, 1023
- Li et al. (2009) Li, H., Lubow, S. H., Li, S., & Lin, D. N. C. 2009, ApJ, 690, L52
- Lin (2012a) Lin, M.-K. 2012a, ApJ, 754, 21
- Lin (2012b) —. 2012b, MNRAS, 426, 3211
- Lin & Papaloizou (2011a) Lin, M.-K., & Papaloizou, J. C. B. 2011a, MNRAS, 415, 1445
- Lin & Papaloizou (2011b) —. 2011b, MNRAS, 415, 1426
- Lovelace et al. (1999) Lovelace, R. V. E., Li, H., Colgate, S. A., & Nelson, A. F. 1999, ApJ, 513, 805
- Lyra (2014) Lyra, W. 2014, ApJ, 789, 77
- Lyra et al. (2009a) Lyra, W., Johansen, A., Klahr, H., & Piskunov, N. 2009a, A&A, 493, 1125
- Lyra et al. (2009b) Lyra, W., Johansen, A., Zsom, A., Klahr, H., & Piskunov, N. 2009b, A&A, 497, 869
- Lyra & Mac Low (2012) Lyra, W., & Mac Low, M.-M. 2012, ApJ, 756, 62
- Meheut et al. (2013) Meheut, H., Lovelace, R. V. E., & Lai, D. 2013, MNRAS, 430, 1988
- Meheut et al. (2012a) Meheut, H., Meliani, Z., Varniere, P., & Benz, W. 2012a, A&A, 545, A134
- Meheut et al. (2012b) Meheut, H., Yu, C., & Lai, D. 2012b, MNRAS, 422, 2399
- Mignone et al. (2007) Mignone, A., Bodo, G., Massaglia, S., Matsakos, T., Tesileanu, O., Zanni, C., & Ferrari, A. 2007, ApJS, 170, 228
- Nelson et al. (2000) Nelson, R. P., Papaloizou, J. C. B., Masset, F., & Kley, W. 2000, MNRAS, 318, 18
- Ou et al. (2007) Ou, S., Ji, J., Liu, L., & Peng, X. 2007, ApJ, 667, 1220
- Pérez et al. (2014) Pérez, L. M., Isella, A., Carpenter, J. M., & Chandler, C. J. 2014, ApJ, 783, L13
- Petersen et al. (2007a) Petersen, M. R., Julien, K., & Stewart, G. R. 2007a, ApJ, 658, 1236
- Petersen et al. (2007b) Petersen, M. R., Stewart, G. R., & Julien, K. 2007b, ApJ, 658, 1252
- Pinilla et al. (2012) Pinilla, P., Benisty, M., & Birnstiel, T. 2012, A&A, 545, A81
- Pinilla et al. (2015) Pinilla, P., de Juan Ovelar, M., Ataiee, S., Benisty, M., Birnstiel, T., van Dishoeck, E. F., & Min, M. 2015, A&A, 573, A9
- Raettig et al. (2013) Raettig, N., Lyra, W., & Klahr, H. 2013, ApJ, 765, 115
- Regály et al. (2012) Regály, Z., Juhász, A., Sándor, Z., & Dullemond, C. P. 2012, MNRAS, 419, 1701
- Regály et al. (2014) Regály, Z., Király, S., & Kiss, L. L. 2014, ApJ, 785, L31
- Regály et al. (2013) Regály, Z., Sándor, Z., Csomós, P., & Ataiee, S. 2013, MNRAS, 433, 2626
- Regály et al. (2010) Regály, Z., Sándor, Z., Dullemond, C. P., & van Boekel, R. 2010, A&A, 523, A69
- Ruge et al. (2013) Ruge, J. P., Wolf, S., Uribe, A. L., & Klahr, H. H. 2013, A&A, 549, A97
- Ruge et al. (2014) —. 2014, A&A, 572, L2
- Shakura & Sunyaev (1973) Shakura, N. I., & Sunyaev, R. A. 1973, A&A, 24, 337
- Tanaka et al. (2002) Tanaka, H., Takeuchi, T., & Ward, W. R. 2002, ApJ, 565, 1257
- Umurhan (2010) Umurhan, O. M. 2010, A&A, 521, A25
- Uribe et al. (2011) Uribe, A. L., Klahr, H., Flock, M., & Henning, T. 2011, ApJ, 736, 85
- van der Marel et al. (2013) van der Marel, N., van Dishoeck, E. F., Bruderer, S., & et al, . 2013, Science, 340, 1199
- Varnière & Tagger (2006) Varnière, P., & Tagger, M. 2006, A&A, 446, L13
- Ward (1997) Ward, W. R. 1997, Icarus, 126, 261
- Whipple (1972) Whipple, F. L. 1972, in From Plasma to Planet, ed. A. Elvius (New York: Wiley Interscience Division), 211
- Winters et al. (2003) Winters, W. F., Balbus, S. A., & Hawley, J. F. 2003, ApJ, 589, 543
- Yu et al. (2010) Yu, C., Li, H., Li, S., Lubow, S. H., & Lin, D. N. C. 2010, ApJ, 712, 198
- Zhu & Stone (2014) Zhu, Z., & Stone, J. M. 2014, ApJ, 795, 53
- Zhu et al. (2014) Zhu, Z., Stone, J. M., Rafikov, R. R., & Bai, X.-n. 2014, ApJ, 785, 122