Multiband electronic characterization of the complex intermetallic cage system Y1-xGdxCo2Zn20
Abstract
A detailed microscopic and quantitative description of the electronic and magnetic properties of Gd3+-doped YCo2Zn20 single crystals (Y1-xGdxCo2Zn20: (0.002 1.00) is reported through a combination of temperature-dependent electron spin resonance (ESR), heat capacity and magnetic susceptibility experiments, plus first-principles density functional theory (DFT) calculations. The ESR results indicate that this system features an exchange bottleneck scenario wherein various channels for the spin-lattice relaxation mechanism of the Gd3+ ions can be identified via exchange interactions with different types of conduction electrons at the Fermi level. Quantitative support from the other techniques allow to extract the exchange interaction parameters between the localized magnetic moments of the Gd3+ ions and the different types of conduction electrons present at the Fermi level (, and ). Despite the complexity of the crystal structure, our combination of experimental and electronic structure data establish GdCo2Zn20 as a model RKKY system by predicting a Curie-Weiss temperature K directly from microscopic parameters, in very good agreement with the bulk value from magnetization data. The successful microscopic understanding of the electronic structure and behavior for the two end compounds YCo2Zn20 and GdCo2Zn20 means they can be used as references to help describe the more complex electronic properties of related materials.
pacs:
76.30.-v, 71.20.-b, 76.60.EsI Introduction
The understanding of the physical properties of complex materials with cage-like structures, such as the family RT2Zn20 (R = rare earth, T = transition metal), have attracted the attention of many researchers focused in condensed matter physics. Among other aspects, these intermetallic cage compounds generate interest due to the different types of electronic and magnetic behaviors governed by “naturally diluted” rare earth ions.Jia0 ; Jia The magnetic versatility associated with the 4 electrons goes from weakly correlated Pauli-like paramagnetic behavior (Lu3+), to hybridization with conduction electrons (Yb3+) and peculiar interactions of local magnetic moments (Gd3+) with conduction electrons, as a few examples.
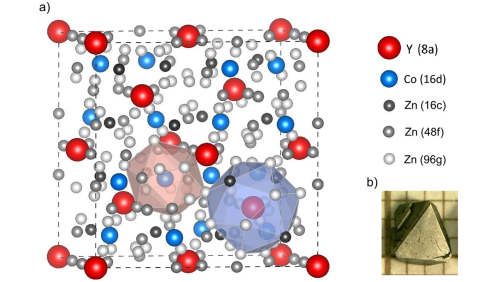
Despite the apparent complexity (184 atoms per conventional unit cell arranged in different types of cages), their crystallographic structure can be broken down into surprisingly simple sub-units, which allows clean analyzes and interpretations of experimental results, and sets this family as an excellent model system for several physical problems. They adopt a cubic CeCr2Al20-type structure (space group: ),Nasch in which the R and T ions occupy their own unique crystallographic sites ( and , respectively). The Zn ions form the cage structure by occupying three inequivalent crystallographic sites (, and ). If we consider the sub-structure in terms of the nearest neighbors and the next nearest neighbors, the R and T ions are fully surrounded by shells formed by Zn ions, leaving a shortest R-R spacing of Å. The R ions are thus isolated in Frank-Kasper cages formed by 16 Zn ions as exemplified in Fig. 1.
The observation of radically different magnetic behaviors such as the contrast between low-temperature antiferromagnetic order ( K)Jia2 in GdCo2Zn20 and the high temperature ferromagnetic order ( K)Jia2 in GdFe2Zn20 hints at peculiar magnetic couplings governed by the Ruderman-Kittel-Kasuya-Yosida (RKKY) interaction. In the case of Y-based compounds, largely different types of behavior are also found. YFe2Zn20 has been described as a “nearly ferromagnetic Fermi sea” compoundJia3 because it is near the Stoner limit, in contrast to YCo2Zn20 with more conventional metallic behavior. Moreover, within this family all the Yb-based compounds described so far have presented heavy fermion behavior,Torikachvili as evidenced by the enhanced Sommerfeld coefficients, reaching mJ/mol.K2 for YbCo2Zn20. All of these observations point to the need to investigate the electronic structure,Tanaka particularly around the Fermi level, and describe the electronic interactions in detail to better understand the electronic and magnetic behaviors.
In order to conduct this task in a tractable manner, we have chosen an initial focus on the weakly correlated compound YCo2Zn20 that features Pauli like paramagnetism, metallic transport and a Sommerfeld coefficient of mJ/mol.K2,Jia ; Jia2 as an appropriate host for a microscopic study using Gd3+ ions as an electron spin resonance (ESR) probe. ESR of rare earth ions diluted in metallic hosts is a useful local technique to investigate microscopic properties of materials, since it directly probes the localized magnetic moments and the nature of the interactions with their neighbors.Taylor ; Barnes The metallic and nonmagnetic YCo2Zn20 host doped with Gd is an excellent model system to study the Gd3+ spin-lattice relaxation, associated with the conduction electrons (ce) spin-flip scattering mechanism due to the exchange interaction between the localized magnetic moment and the ce. The Hasegawa-Korringa modelHasegawa ; Korringa for the spin-lattice relaxation has been carefully discussed and applied in previous studies of ESR for Gd3+ in the intermetallic compounds like LaAl2 Davidov1 , LuAl2 Rettori1 and in elemental Al.Rettori2 We have recently applied the same technique to investigate the electronic structure of the superconductor YIn3.Michael
In this work we show that the ESR spectra of Gd3+ in YCo2Zn20 () presents a Gd3+ concentration-dependent thermal broadening of the linewidth and -shift. This reveals the existence of the exchange bottleneck effect in this compound, that can be tuned by the concentration of Gd3+. By combining the ESR results with heat capacity, magnetic susceptibility and band structure calculations, we extract the exchange parameters of the interaction between Gd3+ and the , , and present at the Fermi level of YCo2Zn20. We are then able to establish a clear correlation of these microscopic parameters with the RKKY interaction. This in turn offers a better understanding of the peculiar “Fermi sea” present in the system, which has lead to the magnetic anomalies found in this family.
II Experimental and computational details
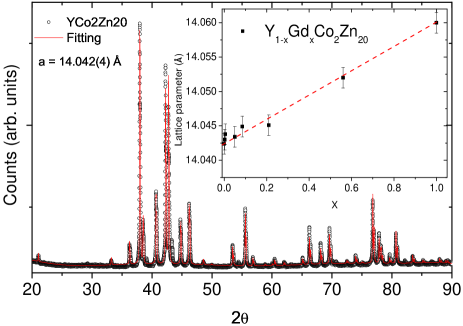
Batches of Y1-xGdxCo2Zn20 (0.001 1.00) single crystals were grown by the self-flux methodCanfield ; Raquel using excess Zn. The starting reagents were 99.9 Y, 99.9 Co, 99.9 Gd and 99.9999 Zn (Alfa-Aesar). Initial ratios of elements were 1:2:47 for the pure ternaries Y:Co:Zn and Gd:Co:Zn, or 1-x:x:2:47 for the pseudo-quaternaries Y:Gd:Co:Zn, based on previously reported growths of the ternary compounds.Jia2 The elemental mixtures were sealed in an evacuated quartz ampoule and placed in a box furnace for the temperature ramping. Crystals were grown by slowly cooling the melt between 1100 ∘C and 600 ∘C over 100 h. At 600 ∘C the ampoules were removed from the furnace, inverted and placed in a centrifuge to spin off the excess flux. The separated crystals are typically polyhedral, mm or larger and manifest clear, triangular [111] facets (Fig. 1). The Gd concentrations were estimated based on the effective moments per formula unit extracted from fits of magnetic susceptibility measurements. Powder x-ray diffraction on crushed crystals was used to ascertain the CeCr2Al20-type structureNasch as exemplified for YCo2Zn20 in Fig. 2. The refined lattice parameter of Å is in good agreement with the literature.Jia0 The inset shows that the refined lattice parameter increases linearly with Gd concentration, as expected by Vegard’s law.Vegard
.
For the ESR experiments, single crystals were crushed into fine powders of particle size greater than 100 m, corresponding to average grain size (d) larger than the skin depth (), . We have noticed that experiments on as-grown single crystals should be carried out with caution, because strong resonances similar to those reported by Ivanshin et al.Ivanshin are frequently observable, and likely due to residual Co surface contamination since that particular signal disappears after removing the as-grown crystal surfaces. The X-Band ( GHz) ESR experiments were carried out in a conventional CW Bruker-ELEXSYS 500 ESR spectrometer using a TE102 cavity. The sample temperature was changed using a helium gas-flux coupled to an Oxford temperature controller. The specific heat () and magnetic susceptibility () measurements were performed on Quantum Design PPMS and SQUID-VSM platforms, respectively, using their standard procedures.
The ground state crystal structures were calculated using spin-polarized first-principles density functional theory (DFT), using the PBEsol exchange-correlation functional.Perdew The Kohn-Sham equations were solved using the projector augmented plane-wave (PAW) method as implemented in the VASP code.Kresse1 ; Kresse2 The PAW atomic reference configurations are: 4445 for Y, 55456 for Gd, 3334 for Co and 334 for Zn, where only electrons treated as valence electrons are explicitly enumerated. The energy cut-off in the plane-waves expansion is 507.5 eV, where the total energy has been converged to1 meV/unit cell. All structural parameters, lattice constants and atomic positions for each calculated compound have been optimized by simultaneously minimizing all atomic forces and stress tensor components via a conjugate gradient method. Successive full-cell optimizations adapting basis vectors have been conducted until the unit cell energies and structural parameters were fully converged. Brillouin-zone integration has been performed on a Monkhorst-Pack -point grid with a Gaussian broadening of 0.01 eV for full relaxation (ionic forces are converged to 0.1 meV/Å). Then, we used the relaxed crystal structures to calculate the total and partial density of states (DOS), the dispersion relations and the Fermi surfaces using the full-potential augmented-plane wave method with local orbitals. Dewhurst The muffin-tin (MT) radii of Y, Gd, Co and Zn are set to and 2.2804 a.u., respectively. The parameter governing the number of plane waves has been converged to 9.0. The irreducible wedge of Brillouin zone is sampled with a uniformly spaced -point grid. Fermi surfaces were plotted using the XCrysDen package.Kokalj
III Experimental Results
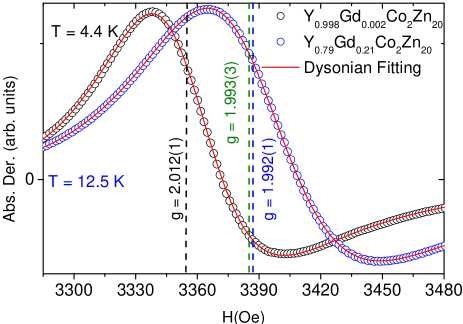
Figure 3 displays the Gd3+ ESR spectra in Y1-xGdxCo2Zn20 for and at 4.4 K and 12.5 K, respectively, and microwave power of mW. These ESR spectra show different resonance magnetic fields than that of Gd3+ in insulators, for which a resonance field of Oe and -value of 1.993(2) are well established.Abragam It is evident that for the low concentration sample () the resonance is shifted toward a lower field (higher -values) compared to that of the higher concentration sample ().
The observed ESR spectra of Gd3+ localized magnetic moments in Y1-xGdxCo2Zn20 will be analyzed according to the generally accepted approach where, at resonance, the microwave absorption in a metal is given by the Dyson theory in the diffusionless limit, .Feher ; Dyson In this limit, for particles larger than the skin depth, the ESR spectra reduce to a simple admixture of absorption and dispersion of Lorentzian lineshapes.Feher ; Dyson The derivative of this admixture is given by:
| (1) | |||||
where and are the resonance and the applied fields respectively, is the electron gyromagnetic ratio, the spin-spin relaxation time, the admixture of absorption and dispersion and the paramagnetic contribution from the static susceptibility. It is usually acceptedDyson that for diluted magnetic moments in a metallic host , where is the spin-lattice relaxation time.Abragam ; Poole Therefore, the fitting of the experimentally observed ESR absorption lines to Eq. 1 allows the extraction of the two most relevant ESR parameters, i.e., the -value from the resonance condition, , and the linewidth .
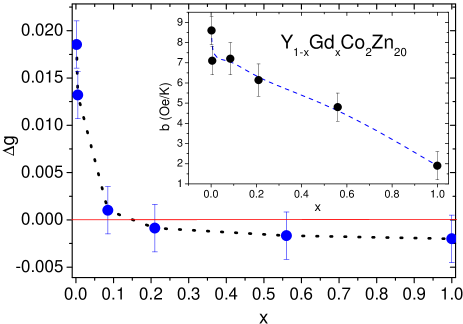
Figure 4 displays the -dependence of the Gd3+ ESR linewidth, , in Y1-xGdxCo2Zn20 for at a microwave power of mW. The broadening of at low temperature for the high concentration samples is presumably originated by the interaction between randomly distributed Gd3+ magnetic moments, that cause an inhomogeneous local field. However, for the stoichiometric GdCo2Zn20 this disorder should be absent and the low temperature broadening of less pronounced (black symbols in Fig. 4). This allows the drop in the magnetic susceptibility at to become evident in the ESR intensity (see Fig. 7). The high -dependence of follows the linear behavior where the parameter represents the residual linewidth, , and the Korringa-like relaxation rate. The extracted and values are given in Table I, together with the obtained -values at 10 K for the studied samples.
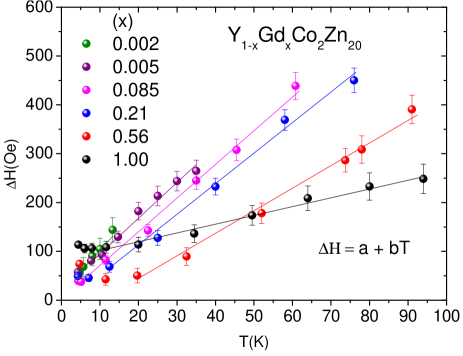
Figure 5 displays the Gd concentration dependence of the -shift ( = - 1.993(2)) and in the inset the thermal broadening of the linewidth, . The general trends of the data presented in Fig. 5 is characteristic of an exchange bottleneck phenomenon, where the relaxation to the Gd3+ localized magnetic moment (Overhauser relaxation) overcomes the spin-lattice relaxation.
We now focus on bulk thermodynamic measurements which, together with the band structure calculations presented in the following section, provide support for a proper quantitative analysis of the ESR results. Figure 6 shows the low temperature linear behavior of as a function of leading to a Sommerfeld coefficient of mJ/mol.K2 and a Debye temperature of = 370(7) K for the YCo2Zn20 compound. Our obtained value of is in agreement with the previously reported value of 18.3 mJ/mol.K2.Jia2 The inset of Fig. 6 zooms in on the weak -dependence of the magnetic susceptibility, , for YCo2Zn20. The dome-like feature at 120 K may be due to -dependent - at the Fermi surface (see Fig. 10 below) and the small upward tail at low temperature (which has no influence in the analyzes that follow) due to residual rare-earth magnetic impurities from the 99.9% Y reagents used in our samples.
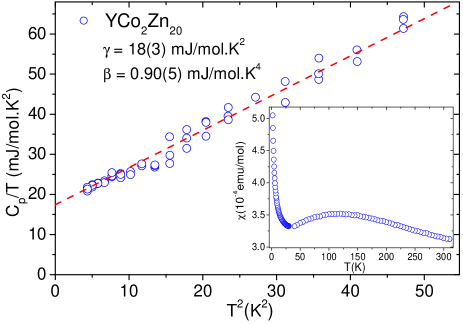
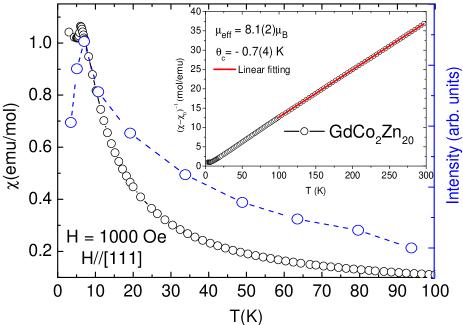
Fig. 7 presents the -dependence of the magnetic susceptibility of GdCo2Zn20 where the antiferromagnetic order is seen at a Neel temperature of K, with an effective magnetic moment , comparable to that of Gd3+ ions ( ) and a paramagnetic Curie temperature K. Note that the paramagnetic Curie temperature is the same as in the Weiss molecular field theory. Fig. 7 also shows that the ESR signal integrated intensity follows the trends of the magnetic susceptibility, crossing the paramagnetic-antiferromagnetic transition at approximately the same Neel temperature. This is in itself a rare observation because usually, around the ordering temperature of a magnetic transition, the ESR signal is lost due to a strong broadening of the resonance.
The magnetic susceptibility for all our Y1-xGdxCo2Zn20 samples were fitted to a Curie-Weiss law using the effective magnetic moment of for the Gd3+ ions. From these fittings the Gd concentrations were estimated and their values are listed in Table 1.
IV Analysis and Discussion
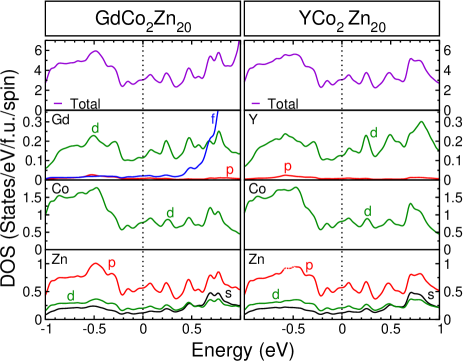
The low- linear behavior of for YCo2Zn20 of Figure 6 leads to a Sommerfeld coefficient mJ/mol K2 and a Debye temperature K. In the Fermi liquid model the Sommerfeld coefficient is given by , where is the total density of states (DOS) per formula unit (f.u.), spin and eV at the Fermi level. Thus, we estimate states/f.u., spin and eV for YCo2Zn20.
A Pauli-like paramagnetic susceptibility for YCo2Zn20 can be estimated at high- (310 K). The data in the inset of Figure 6 presents, after correction by the core diamagnetism of YCo2Zn20 ( emu/mol), a lower limit magnetic susceptibility value at K of emu/mol which is slightly smaller than the value reported by Jia et al. Jia3 Notice that the diamagnetism of the cage structure has not been considered.
Once again within the Fermi liquid model, the Pauli-like paramagnetic susceptibility is given by . Then, using the experimental Pauli paramagnetic susceptibility for YCo2Zn20 we estimate states/f.u., spin and eV as a lower limit for the DOS. However, one has to consider the possibility of an exchange-enhanced magnetic susceptibility, i.e., , where accounts for the electron-electron exchange enhancement. Nevertheless, the estimated value of states/f.u., spin and eV is, within the accuracy or our experiments, comparable to the value obtained from the Sommerfeld coefficient. Thus, in our analysis we shall ignore the electron-electron exchange enhancement for YCo2Zn20.
| Conc. | g-value | Measured b | Calculated b |
|---|---|---|---|
| x | (10 K) | (Oe/K) | (Oe/K) |
| 0.002 | 2.012(1) | 8.6(6) | 8.4(3) |
| 0.005 | 2.006(1) | 7.1(6) | 4.3(3) |
| 0.085 | 1.994(1) | 7.2(6) | 0.02(3) |
| 0.21 | 1.992(1) | 6.1(6) | 0.02(3) |
| 0.56 | 1.991(2) | 4.8(6) | 0.08(5) |
| 1.00 | 1.991(2) | 1.9(6) | 0.09(5) |
From the high- data of Figure 7 (100 K - 300 K) for GdCo2Zn20 we obtain a small negative value for the Curie-Weiss temperature, = -0.7(4) K, as expected for this antiferromagnetic material. This is in contrast to the small positive value reported in previous studies.Jia2
In order to complement the experimental data analysis and provide details about the electronic structure, we have performed first-principles band structure calculations for the pure compounds GdCo2Zn20 and YCo2Zn20. The calculated lattice constant of the fully relaxed crystal structures are 13.7738 Å and 13.7564 Å for GdCo2Zn20 and YCo2Zn20, respectively, obtaining an absolute relative error of 2%, as it is expected from local and semi-local functionals. For GdCo2Zn20 we have obtained that the magnetic stabilization energy meV/unit cell, therefore the ground state is antiferromagnetic, with a calculated local magnetization of /Gd ion and zero local magnetization for the Co ions. On the other hand, YCo2Zn20 converged to a non magnetic ground state. A previous band structure calculation,Jia2 with local and semi-local functionals without including explicitly the Gd -states into the valence window and with a tiny -point grid, found for the unrelaxed crystal structure of GdCo2Zn20 a slightly larger local magnetic moment of /Gd ion. However, it is worth noting that the calculation of the magnetic moment is very sensitive to the number of -points and those values were not fully converged.Jia2
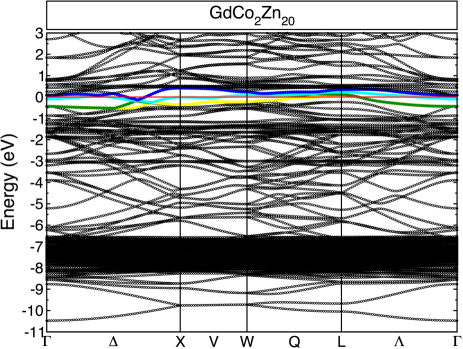
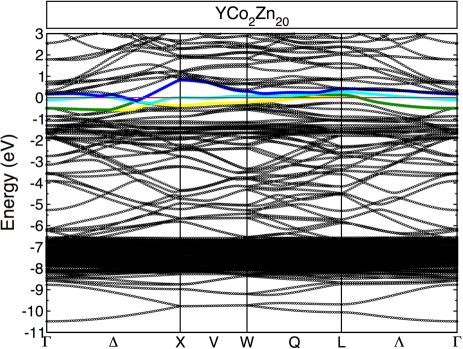
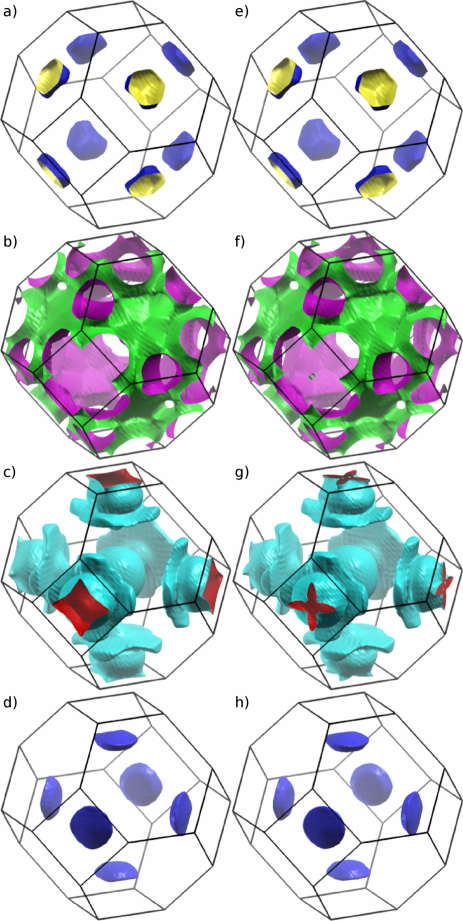
Figure 8 shows the calculated dispersion relations for these two systems. For GdCo2Zn20 the valence bands are built up mainly from Zn -states and a small contribution of Zn - and -states between -11 and -6.5 eV for both systems. The remaining valence bands result from the hybridization of Gd - and -states (the latter localized between -3.3 and -2.8 eV), Co -states and Zn -, - and -states. The conduction bands are also built up from the hybridization of Gd - and -states, Co -states and Zn -, - and -states, with the Gd -states localized between 0.3 and 1.0 eV. On the other hand, the bands of YCo2Zn20 are built up similar to the previous system with the obvious absence of -states, in this case Y -states contribute mostly to the upper valence bands and the conduction bands. As can be observed in Fig. 8, the topology of the bands is almost identical for the two systems, especially the four conduction bands that cross the Fermi level. The similarity of these four bands is more lively appreciable in the branches of the Fermi surface, as seen in Fig. 9. The first branch is formed by eight pockets along the direction of the first Brillouin zone. These pockets are formed from the contributions of Gd(Y) -states and Co -states. The second branch of the Fermi surface has eight connected structures along the and directions that resemble a six-arm starfish. These starfish are built up from Gd(Y) -states, Co -states and Zn and -states. The third branch has one sphere at the center of the first Brillouin zone, which is made up from Zn -states, and six structures that have the appearance of mushrooms with the stem along the direction. These six mushrooms are formed from Gd(Y) -states and Co -states. The fourth branch is constituted of six lenses with their surfaces perpendicular to the direction. These lenses are built up from Co -states and Zn -states.
For GdCo2Zn20 our calculations estimate a total DOS at the Fermi level of 3.03(1) states/f.u., spin and eV (Fig. 10). Similarly, a total DOS at the Fermi level of 3.02(1) states/f.u., spin and eV was estimated for YCo2Zn20 (Fig. 10), which is comparable to the above values obtained experimentally. Also, our calculated values are in relatively good agreement with a previous first-principles study with a much less dense -point grid.Jia2 These results support the previous statement that YCo2Zn20 may be considered as an intermetallic compound with negligible electron-electron correlations, i.e, with .
With all these details in mind, we can now return to the ESR analysis. The exchange interaction, between the localized -electron spin of Gd3+, , and the of the YCo2Zn20, , yields an ESR -shift, ,Yosida and thermal broadening of the linewidth, , (Korringa rate)Korringa given by:
and
where is the effective exchange parameter in the absence of momentum transfer, i.e., = ,Davidov is the “bare” density of states for one spin direction at the Fermi surface, is the Boltzmann constant, is the Bohr magneton, and is the Gd3+ -value.
The above equations are normally used in the analysis of the ESR data in the limit of very diluted rare earths and concentration-independent and parameters, i.e., in the non-bottleneck regime, absence of momentum transfer and single band compounds.Davidov2 Using the data in Table I and Eq. 3 one can observe that the correlation between -shift, , and is only verified for the lowest Gd concentration samples. Moreover, Fig. 4, Fig. 5 and Table 1 show clear concentration-dependent ESR parameters, so our data must be analyzed in a different manner.
The change of the Gd3+ -shift from positive values (at low Gd concentrations) to negative ones (at high Gd concentrations) and the -dependence of the Gd3+ ESR thermal broadening of the linewidth, , (see Fig. 3 and Fig. 5) lead us to conclude that the relaxation of the Gd3+ ions to the lattice is processed via an exchange interaction, , between the Gd3+ localized magnetic moment and different types of ce at the Fermi level.
In a multiband approximation the -shift, , and thermal broadening of the linewidth, , are given by:
and
where is the Boltzmann constant, the Bohr magneton, and the Gd3+ -value; are the effective components of the exchange interaction between the Gd3+ 4f magnetic moment and the s-, p- and d-type ce; the partial bare DOS (states/f.u., spin and eV) at the Fermi level of the s-, p- and d-type ce; is the average over the Fermi surface of the square of the -dependent effective exchange parameter in the presence of ce momentum transfer, , i.e., ;Davidov , and are factors associated with the orbital degeneracy of the unsplit (no crystal field effects) bands at the Fermi level, respectively. The -dependence of the exchange interaction with the p-type and d-type ce will be considered constant over the Fermi surface, i.e., (see below).
In Eq. 4 we have considered that the contribution to due to the exchange interaction with s- and d-type ce are positive (atomic-like) and that with p-type ce is negative (covalent-like).Davidov
Due to the strong spin-orbit coupling of p- and d-type ce compared to that of the s-type ce, we assume that only the s-type ce are capable of experiencing the bottleneck effect. Hence, we can consider that the contribution to the ESR parameters, -shift and , of the s-type ce are negligible in the highly concentrated samples. With these assumptions, for (GdCo2Zn20, extreme bottleneck) Eq. 4 reduces to
| (6) |
and Eq. 5 reduces to (see Fig. 10b):
| (7) |
In general, the -dependence of the exchange parameters cannot be disregarded, but in the case in which the relaxation rate, , scales or is slightly larger than the expected value from the -shift () we can neglect the -dependence of the and exchange parameters. In our case, we have that 1.9 Oe/K Oe/K) Oe/K in agreement with Table I.
From Fig. 10 for GdCo2Zn20, we have = 1.09(1) states/f.u., spin and eV and = 0.59(1) states/f.u., spin and eV. Then, using Eqs. 6 and 7 we estimate meV and meV.
Conversely, in the not bottlenecked regime (lowest Gd concentration, ), and from Fig. 10 for YCo2Zn20, Eqs. 4 and 5 reduce to:
| (8) |
| (9) |
Again from Eqs. 8 and 9 and using = 0.13(1) states/f.u., spin and eV, we obtain meV and meV. Comparing this value with those for and , we find that in these compounds the polarization component of the exchange parameter is an order of magnitude larger.
Thus, in order to describe the antiferromagnetic ordering of GdCo2Zn20, it should be more appropriate to use an RKKY approach that considers only the exchange parameter (due to the delocalized nature of the -type electrons compared with and -type) rather than the Campbell model,Campbell ; Shuo that considers the term as the most important one. Therefore our obtained value in ESR analysis for can be used to establish a correlation with the RKKY interaction, which is only valid in very dilute magnetic systems as this family of compounds.
In general, the RKKY interaction depends strongly on the Fermi surface and can have different analytical forms for each case. Finding a suitable expression for a real material with a complex Fermi surface is thus expected to be an almost impossible task. The equation that represents a generalized form of the RKKY interaction is given byJensen :
| (10) |
where and are the step functions that come from the non-zero matrix elements, according to the second-order perturbation theory treatment of the second quantized Heisenberg hamiltonian, between a localized and an itinerant electron spin coupled by . The term corresponds to the energy diference between the ground state and the excited state. This function is known as a Lindhard function that appears in the generalized form of the magnetic susceptibilityJensen . Transforming the two summations into integrals, one may reach the actual expression for the RKKY interaction. Our calculated Fermi surface, shown in Fig. 9, evidences a rather complex dispersion relation for the GdCo2Zn20 compound, so obtaining an exact analytical solution from Eq. 10 is not possible.
However, within a simple Fermi gas model () the problem is simplified and more accessible. In this approximation the analytical expression of the RKKY interaction for the effective coupling between two lattice localized spins is given, in terms of , byCoey :
where is the number of conduction electrons per atom, the Fermi energy, the coupling constant between the Gd3+ spin and the conduction electron spin , (), and is the RKKY function given by:
| (12) |
Hence, in the GdCo2Zn20 compound, it is possible to estimate the effective exchange parameter, (Eq. 11), due to the coupling between two nearest Gd3+ neighbors via the damped spin polarization of only the -type ce, as it can observed in the third branch of the Fermi surface (Fig. 9 (c,g)).
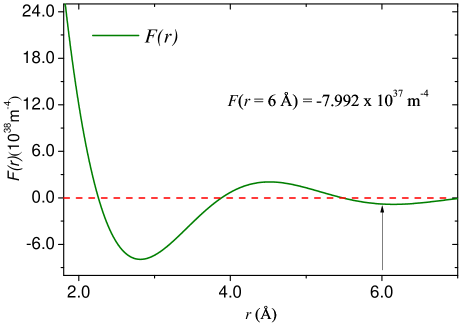
For GdCo2Zn20 the following band structure parameters were determined from the DFT calculations: = 3.77 eV with m-1 ( = ) and c.e/atom. Notice that the value of m-1 is comparable to those reported for uncorrelated simple metals such as Cu, Ag and Au.Aschcroft Then, the amplitude of the RKKY function at Å (nearest Gd-Gd neighbors) gives (6.0 Å) m-4 (Fig. 11) and, consequently, meV, a negative value as expected for antiferromagnetic ordering.
Now, a microscopic Curie-Weiss temperature estimation can be made from this result:Coey
| (13) |
with (Gd nearest neighbors in GdCo2Zn20) and for Gd3+. We obtain K which is, within the accuracy of our experiments, in very good agreement with the bulk estimation (Fig. 7) extracted from the magnetic susceptibility measurements.
V Conclusions
Our experimental ESR results of Y1-xGdxCo2Zn20 (0.002 1.00) were analyzed within a multiband model of ce (-, - and -type) where, via the Gd concentration, the system was tuned from an non-bottleneck regime (Y0.998Gd0.002Co2Zn20) to a bottleneck regime (GdCo2Zn20). The combination of ESR results with those of heat capacity, magnetic susceptibility and band structure calculations allowed us to estimate the polarization component of the exchange parameters, . Besides, by the assumption that only the s-type of ce can experience the bottleneck effect, due to their relatively weak spin-orbit coupling, we found that the average over the Fermi surface of the exchange parameter, associated to the ce momentum transfer, is different from the exchange parameter leading to local polarization effects, i.e., .
The exchange parameters obtained with this multiband scenario revealed that is dominant over and . This allowed a tractable RKKY description for the antiferromagnetic behavior of the GdCo2Zn20 compound. Despite the fact that these compounds are structurally complex, we found that under certain reasonable approximations and using the combination of different experimental results with DFT calculations, the RKKY approach gave a very good quantitative description of the magnetic interaction, as expected for a naturally diluted structure of rare-earth ions. This was confirmed by the reasonably accurate prediction of the Curie-Weiss temperature in terms of microscopic parameters.
With the resulting establishment of GdCo2Zn20 as a model RKKY system, we expect that this work can provide key reference elements to help understand the behaviors of related materials such as RFe2Zn20 and YbT2Zn20, with their more complex and remarkable electronic and magnetic properties.
Acknowledgements.
This work was supported by Brazilian agencies FAPESP (Grant Nos. 2011/19924-2, 2012/17562-9), CNPq, FINEP and CAPES. We thank R. A. Ribeiro for sample preparation support and P. G. Pagliuso for fruitful discussions. JMOG would like to thank CODI-Vicerrectoría de Investigación-Universidad de Antioquia (Estrategia de Sostenibilidad 2014–2015).References
- (1) S. Jia, N. Ni, S. L. Bud’ko, and P. C. Canfield, Phys. Rev. B 76, 184410 (2007).
- (2) S. Jia, N. Ni, S. L. Bud’ko, and P. C. Canfield, Phys. Rev. B 80, 104403 (2009).
- (3) T. Nasch, W. Jeitschko, and U. C. Rodewald: Z. Naturforsch. B 52, 1023 (1997).
- (4) S. Jia, N. Ni, G. D. Samolyuk, A. Safa-Sefat, K. Dennis, H. Ko, G. J. Miller, S. L. Bud’ko, and P. C. Canfield, Phys. Rev. B 77, 104408 (2008).
- (5) S. Jia, S. L. Bud’ko, G. D. Samolyuk, and P. C. Canfield, Nat. Phys.3, 334 (2007).
- (6) M. S. Torikachvili, S. Jia, E. D. Mun, S. T. Hannahs, R. C. Black, W. K. Neils, Dinesh Martien, S.L. Bud’ko, and P. C. Canfield, Proc, Natl. Acad. Sci. U.S.A. 104, 9960 (2007).
- (7) T. Tanaka, and Y. Kubo, J. Phys. Soc. Jpn. 79, 124710 (2010).
- (8) R. H. Taylor, Adv. Phys. 24, 681 (1975).
- (9) S. E. Barnes Adv. Phys. 30, 801 938 (1981).
- (10) H. Hasegawa, Prog. Theor. Phys. 21, 1752 (1968).
- (11) J. Korringa, Physica 16, 601 (1950).
- (12) D. Davidov, A. Chelkowski, C. Rettori, R. Orbach, and M. B. Maple, Phys. Rev. B 7, 1029 (1973).
- (13) C. Rettori, H. M. Kim, E. P. Chock, and D. Davidov, Phys. Rev. B 10, 1826 (1974).
- (14) C. Rettori, D. Davidov, R. Orbach, E. P. Chock, and B. Ricks, Phys. Rev. B 7, 1 (1973).
- (15) M. Cabrera-Baez, W. Iwamoto, E. T. Magnavita, J. M. Osorio-Guillén, R. A. Ribeiro, M. A. Avila and C. Rettori, J. Phys. Cond. Mat. 26, 175501 (2014).
- (16) R. A. Ribeiro and M. A. Avila, Phil. Mag. 92, 2492 (2012).
- (17) P. C. Canfield and Z. Fisk, Phil. Mag. 65, 1117 (1992).
- (18) A. R. Denton and N. W. Ashcroft, Phys. Rev. A 43, 3161 (1991).
- (19) V. A. Ivanshin, T. O. Litvinova, A. A. Sukhanov, N. A. Ivanshin, S. Jia, S. L. Bud’ko and P. C. Canfield, JETP Letters 99, 3 (2014).
- (20) J.P. Perdew, A. Ruzsinszky, G.I. Csonka, O.A. Vydrov, G.E. Scuseria, L.A. Constantin, X. Zhou, and K. Burke, Phys. Rev. Lett. 100, 136406 (2008).
- (21) G. Kresse and J. Furthmüller. Phys. Rev. B 54, 11169 (1996).
- (22) G. Kresse and D. Joubert. Phys. Rev. B 59, 1758 (1999).
- (23) K. Dewhurst, S. Sharma, L. Nordström, and H. Gross, URL http://elk.sourceforge.net.
- (24) A. Kokalj, Comp. Mater. Sci., 2003, Vol. 28, p. 155
- (25) A. Abragam and B. Bleaney, Electron Paramagnetic Resonance (EPR) of Transition Ions (Oxford: Clarendon)(1970).
- (26) G. Feher and A. F. Kip, Phys. Rev. 98, 337 (1955).
- (27) F. J. Dyson, Phys. Rev. 98, 349 (1955).
- (28) C. P. Jr. Poole, Electron Spin Resonance: A Comprehensive Treatise on Experimental Techniques (New York: Wiley) pp 705 17 (1969).
- (29) K. Yosida, Phys. Rev. 106, 893 (1957).
- (30) D. Davidov, K. Maki, R. Orbach, C. Rettori, and E. P. Chock, Solid State Commun.12, 621 (1973).
- (31) D. Davidov, R. Orbach, C. Rettori, D. Shaltiel, L. J. Tao, and B. Ricks, Phys. Lett.35A, 339 (1971).
- (32) P. F. S. Rosa, L. A. S. de Oliveira, C. B. R. de Jesus, K. O. Moura, C. Adriano, W. Iwamoto, T. M. Garitezi, E. Granado, M. E. Saleta, K. R. Pirota, P. G. Pagliuso, Solid State Commun.191, 14-18 (2014).
- (33) I. A. Campbell, J. Phys. F: Met. Phys. 2 L47 (1972).
- (34) H. S. Li, Y. P. Li and J. M. D. Coey, J. Phys. Cond. Mat. 3, 7277-7290 (1991).
- (35) J. Jensen and A. R. Mackintosh, Rare Earth Magnetism, (Oxford: Clarendon) (1991).
- (36) N. W. Ashcroft and N.D. Mermin, Solid State Physics, Saunders, (1976).
- (37) J. M. D. Coey, Magnetism and Magnetic Materials (Cambridge) (2009).