[table]labelsep=period,labelfont=bf,rm
\captionsetup[figure]labelfont=bf,labelsep=period
UPV/EHU]
22footnotemark: 2 Nano-Bio Spectroscopy Group and ETSF Scientific Development Center, Departamento de Física de Materiales, Universidad del País Vasco UPV/EHU and DIPC, E-20018 San Sebastián, Spain
ICN2CSIC]
33footnotemark: 3 Catalan Institute of Nanoscience and Nanotechnology (ICN2), CSIC and The Barcelona Institute of Science and Technology, Campus UAB, Bellaterra, E-08193 Barcelona, Spain
Using GW Level Alignment to Identify Catechol’s Structure on TiO(110)
ABSTRACT:
We perform state-of-the-art calculations for a prototypical dye sensitized solar cell: catechol on rutile TiO2(110). Catechol is often used as an anchoring group for larger more complex organic and inorganic dyes on TiO2 and forms a type II heterojunctions on TiO2(110). In particular, we compare quasiparticle (QP) with hybrid exchange correlation functional (HSE) density functional theory (DFT) calculations for the catechol-rutile TiO2(110) interface. In so doing, we provide a theoretical interpretation of ultraviolet photoemission spectroscopy (UPS) and inverse photoemission spectroscopy (IPES) experiments for this prototypical system.
Specifically, we demonstrate that the position, presence, and intensity of peaks associated with catechol’s HOMO, intermolecular OH–O bonds, and interfacial hydrogen bonds to the surface bridging O atoms (OH–C and OH–O) may be used to fingerprint deprotonation of catechol’s OH anchoring groups. Furthermore, our results suggest deprotonation of these groups, while being nearly isoenergetic at high coverages, may significantly increase the photovoltaic efficiency of catechol–TiO2(110) interfaces.
![[Uncaptioned image]](/html/1508.00786/assets/CatecholTOC2x2.png)
1. INTRODUCTION
Catechol on TiO2(110) is a prototypical system for modelling industrially relevant dye sensitized solar cells 1, 2, 3, 4, 5, 6, 7. This is for two reasons. (1) Catechol is often used as an anchoring group 8 for larger more complex organic and inorganic dyes. (2) Catechol forms type II heterojunctions 8, where the dye’s highest occupied molecular orbital (HOMO) is a gap state, while the lowest unoccupied molecular orbital (LUMO) is above the conduction band minimum (CBM) of the substrate, e.g., TiO2. The level alignment for this system has previously been studied experimentally via ultraviolet photoemission spectroscopy (UPS) 9, 1 and inverse photoemission spectroscopy (IPES) 9, and thus provides an excellent benchmark type II system to be studied theoretically using many-body quasiparticle (QP) techniques, such as 10, 11, 12. For such type II systems, the HOMO–LUMO and HOMO–CBM separations determine the onset of the absorption spectra. In such photovoltaic devices, the dye’s role is to reduce the onset of the absorption spectra to sub-band gap energies, and maximize the overlap with the solar spectrum5, 13.
The exact structure of the catechol–rutile TiO2(110) interface is difficult to identify and control experimentally. This is because for hydroxylated molecules such as catechol, a complex network of interfacial and intermolecular bonds is formed upon adsorption. Moreover, catechol’s anchoring OH groups can be either fully dissociated, partially dissociated, or intact, with each catechol overlayer having similar adsorption energies. Still, dissociation plays a significant role in determining the level alignment1, 14 and, hence, the photovoltaic efficiency13 of the interface.
Generally, the HOMO moves to higher energy upon deprotonation for hydroxylated molecules, e.g., CH3OH on TiO2(110)15 and H2O on rutile TiO2(110)16 and anatase TiO2(101)17. For this reason, the HOMO’s energy provides a fingerprint of the interface’s structure. This is augmented by the presence of distinct identifiable levels associated with intermolecular and interfacial OH–O hydrogen bonds. Specifically, the hydrogenated bridging O atoms (HO) resulting from interfacial deprotonation of the anchoring groups are consistently at eV below the Fermi level on TiO2(110)14, 16, 18, 19.
To describe both highly hybridized 16 and localized 15, 20 molecular interfacial levels, one requires a correct description of the anisotropic screening, i.e., electron-electron interaction, at the interface. This is clearly seen from the level alignment of H2O on TiO2(110)16.
On the one hand, H2O’s 1b1 level becomes highly hybridized with the substrate upon adsorption on TiO2(110) 16. The interfacial level alignment of these highly hybridized levels with the substrate VBM is already described by density functional theory (DFT). This is because the screening of these levels is essentially the dielectric constant of the substrate. At the level, the DFT Kohn-Sham (KS) eigenenergies are shifted by , the difference between the QP self-energy () and the xc potential (), up to a normalization factor , i.e., 12. For example, and eV for all levels of the TiO2(110) substrate from based on DFT calculations employing a generalized gradient approximation (PBE)21 and a hybrid range separated (HSE)22 exchange and correlation (xc)-functional, respectively23.
On the other hand, H2O’s 3a1 and 1b2 levels remain mostly localized on the molecule upon adsorption on TiO2(110) 16. The alignment of these localized levels, whose screening is significantly different from that of the substrate, is poorly described at the DFT level. Not even HSE22 provides an accurate description of the interfacial level alignment for localized levels, e.g., H2O’s 3a1 and 1b2 and CH3OH’s a on TiO2(110)16, 23. This is because HSE DFT calculations effectively perform a constant static screening of the exchange term, i.e., the fraction of Hartree-Fock exact-exchange included is effectively an inverse dielectric constant 24. For this reason, HSE performs well for systems with a homogeneous screening and 24, 23, 16.
To correctly account for differences in screening between the molecular layer and substrate, one may use many-body QP techniques, such as 11. In such methods, the spatial dependence of the screening is included explicitly. In fact, for occupied levels, is linearly dependent on the fraction of the wave function’s density within the molecular layer 15, 23, 25. This means by just rigidly shifting all the levels, one cannot describe the alignment of occupied levels with significant density outside the substrate.
For type I interfaces, i.e., H2O or CH3OH on TiO2(110)16, 15, 23, 20, we have previously demonstrated that provides an accurate alignment for both localized and highly hybridized levels. In each case, shifts the localized levels to stronger binding, into quantitative agreement with UPS experiments.
In this study, we compare the projected density of states (PDOS) onto catechol obtained from QP PBE and HSE DFT calculations with the measured UPS and IPES spectra for the catechol–rutile TiO2(110) interface. In so doing, this study provides a complete state-of-the-art computational description of the simplest experimentally relevant type II interface. Based on our analysis of the PDOS, we are able to suggest the most likely structure of the catechol overlayer measured in UPS experiments. In fact, our results suggest the degree of catechol dissociation may differ with the experimental conditions employed9, 1. Our results suggest fully deprotonating the anchor groups of the overlayer should lead to an increased efficiency of the photovoltaic device.
2. METHODOLOGY
Our calculations10, 11, 12 have been performed using vasp within the projector augmented wave (PAW) scheme 26. The calculations are based on KS wave functions and eigenenergies from DFT obtained using PBE21. DFT calculations employing the HSE06 variant22 of the HSE xc-functional have been carried out for comparison with PBE calculations.
In the approach, the contribution to the KS eigenvalues from the xc-potential is replaced by the QP self energy in a single step, where is the Green’s function and is the screening 10 based on the KS wave functions and eigenvalues 11. The dielectric function is obtained from linear response time-dependent (TD) DFT within the random phase approximation (RPA), including local field effects 12. From one obtains first-order QP corrections to the KS eigenvalues, but retains the KS wave functions.
The geometries have been fully relaxed using the PBE21 xc-functional, with all forces 0.02 eV/Å. We employ a plane-wave energy cutoff of 445 eV, an electronic temperature eV with all energies extrapolated to K, and a PAW pseudopotential for Ti which includes the 3 and 3 semi-core levels. The calculations have been performed spin unpolarized. All unit cells contain a four layer TiO2(110) slab, employ the measured lattice parameters of bulk rutile TiO2 ( Å, Å)27, and include at least 27 Å of vacuum between repeated images. In each case, equivalent catechol overlayers are adsorbed on both sides of the slab. We employ centered -point meshes with densities Å-1, approximately 9 unoccupied bands per atom, i.e. including all levels up to 30 eV above the VBM, an energy cutoff of 80 eV for the number of G-vectors, and a sampling of 80 frequency points for the dielectric function. The parameters are consistent with those previously used for describing both rutile and anatase TiO2 bulk, rutile TiO2(110) and anatase TiO2(101) clean surfaces, and their interfaces15, 23, 16, 17. These parameters have been shown to provide accurate descriptions of bulk rutile and anatase optical absorption spectra, and both clean surface and interfacial level alignment15, 23, 16, 17.
The adsorption energy of catechol on Ti coordinately unsaturated (Ti) sites of a TiO2(110) surface is given by
| (1) |
where is the number of adsorbed catechol molecules in the supercell, and , , and are the total energies of the covered and clean surfaces and gas phase catechol molecule, respectively. For catechol in the gas phase, we find the most stable conformation has an intramolecular hydrogen bond, i.e., symmetry.
Scanning tunneling microscopy (STM) simulations have been performed using the Tersoff-Hamann approximation28. In this approach, the current at a position r is given by
| (2) |
where is a prefactor which depends on the DOS, surface work function, and tip radius. is the potential of the sample relative to the tip in the experiment, i.e., the applied potential relative to the experimental Fermi level . is the local DOS, given by
| (3) |
where is the eigenvalue and is the KS wave function of level at -point k, eV is the electronic temperature of the calculation, and is the weight of -point k. To emphasize any dependence of on the applied bias , we have used throughout . It should be noted, however, that similar results are obtained by integrating over the bias window (see Figure S1 in Supporting Information). Herein, is plotted at an isosurface value of Å3. This is somewhat greater than its maximum far from the surface, i.e.,
| (4) |
This ensures is defined at this isosurface value throughout the surface plane.
Experimental spectra are typically referred to the Fermi level, , which is pinned eV below the CBM for mildly reduced TiO 29, 30, 31. Using the electronic band gap for rutile TiO of eV obtained from electron spectroscopy measurements 32, the experimental VBM energy relative to the Fermi level is eV23. Since the VBM is the most reliable theoretical energy reference23, we subtract eV from the measured UPS and IPES spectra to align with the calculated DOS and PDOS, and vice versa.
We align the DOS and PDOS with respect to the deepest Ti semi-core level (3s2). This allows a direct comparison between spectra for half (D D), mixed (D D), and fully (D D) dissociated catechol overlayers. In each case, the highest occupied levels belong to the catechol overlayer. As we are interested in seeing the difference between the HOMO position and the TiO2(110) VBM for each catechol overlayer, the highest occupied level is not a good reference.
Moreover, the catechol anchor groups form Ti–O bonds, making it impractical to separate the O 2pπ surface levels from those of the molecule. This makes it difficult to identify a highest occupied level with purely surface contributions, which can be associated with the clean surface’s VBM. For this reason, one should use the Ti levels as reference, e.g., occupied semi-core Ti 3s2 or unoccupied Ti 3d CBM levels. Here, we align with respect to the deepest semi-core Ti 3s2 levels. In this way we obtain a consistent alignment relative to the surface levels for each configurations. We find this is effectively equivalent to aligning relative to the TiO2 CBM, i.e., Ti 3 levels.
Using the semi-core levels, we remove differences in work function between surfaces, which would be present if the vacuum level were used as a reference. Here, we take the energy of the VBM for the clean surface relative to its deepest Ti 3s2 semi-core level as our final reference relative to the catechol interface’s deepest Ti 3s2 level . More precisely, , in Figures 3 and 4.
However, for reduced TiO2-x(110), where Ti 3d levels are occupied, all the Ti levels are consequently upshifted compared to stoichiometric TiO2(110). This makes the Ti levels a poor reference for comparison between such systems. For this reason, we use the VBM as an energy reference for 1 ML H@O on TiO2(110), as it is a type I interface.
3. RESULTS AND DISCUSSION
Catechol consists of a benzene ring with two adjacent anchoring OH groups. It has been previously shown, both theoretically and experimentally, that catechol adsorbs on the Ti sites of the rutile TiO2(110) surface via the OH anchor groups in a bidentate configuration.
At low coverage, catechol preferentially adsorbs upright () on the surface, parallel to the [001] -axis 2, with both anchoring groups deprotonated, i.e., fully dissociated, with an accompanying charge of transferred to the nearest O atom of the TiO2(110) surface. As the coverage increases ( ML), catechol tilts () toward the surface, with two interfacial OH–O bonds (cf. Table 1).
structure OH–O OH–O OH–C OH–O (ML) (∘) (bonds/unit cell) (eV) D 86 0 0 0 2 -0.792 I 87 0 0 0 0 -0.249 I 61 0 2 0 0 -0.595 D 80 0 1 0 1 -0.620 D 63 0 1 0 1 -0.676 D 78 0 0 2 0 -0.676 D 87 0 0 0 2 -0.705 D 67 0 0 0 2 -0.748 1 D D 56, 49 2 0 2 0 -0.614 D D 55, 48 1 1 0 2 -0.600 D D 54, 46 2 0 0 2 -0.598 D D 56, 48 1 0 1 2 -0.685 D D 56, 48 1 0 2 1 -0.653 D D 56, 49 0 0 2 2 -0.652
At high coverage (1 ML), where catechol molecules adsorb on every Ti site, they are forced to tilt in alternating directions due to steric hindrance. This gives rise to the catechol overlayers seen via STM1 and shown in Figure 1.
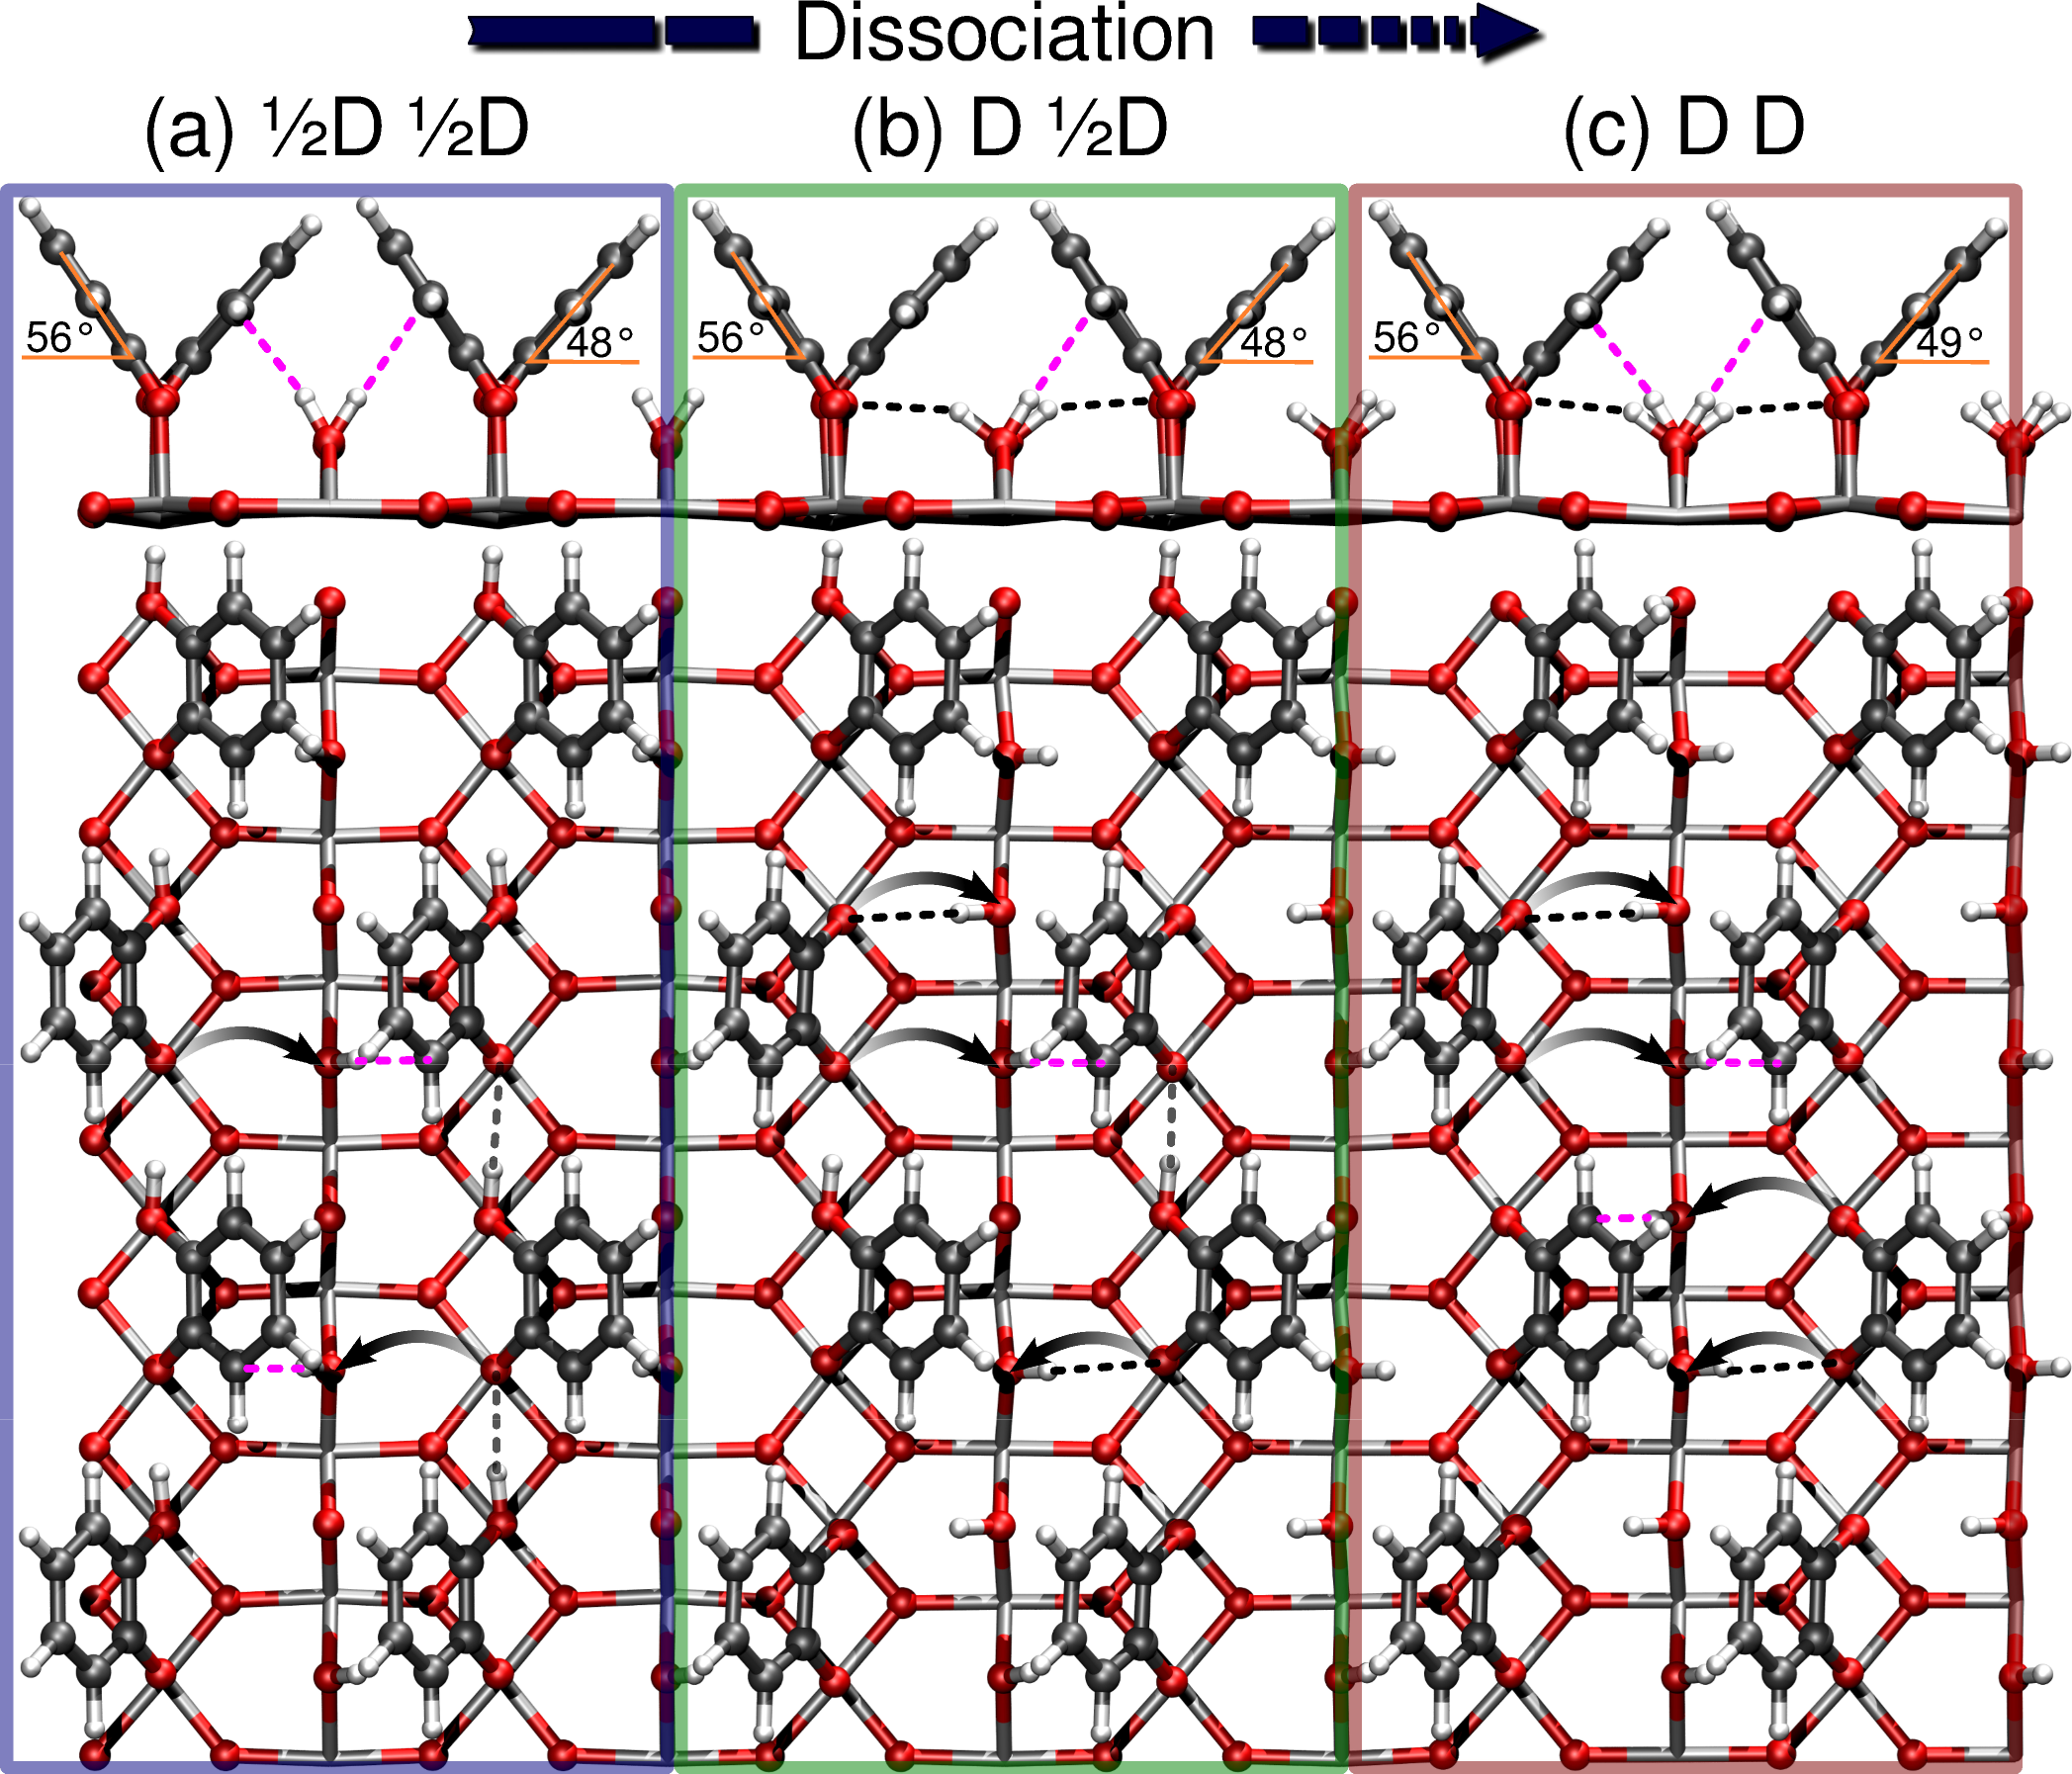
Further, at this coverage, besides interfacial hydrogen bonds to the surface HO, the overlayer, when not fully dissociated, is stabilized by intermolecular hydrogen bonds between neighboring catechol molecules. For this reason, the half, mixed, and fully dissociated catechol adsorption energies are all within 0.1 eV, i.e., the accuracy of DFT (cf. Table 1). These results have also been reproduced to within 25 meV using the real space PAW DFT code gpaw33, 34.
Overall, we find catechol binds more weakly to the surface as the coverage increases. This is attributable to steric hindrance, especially for a 1 ML coverage. Furthermore, the binding energy at ML coverage is significantly stronger for deprotonated anchoring groups and tilted catechol molecules (cf. Table 1). This is consistent with previous DFT studies of catechol on TiO2(110)4.
The most stable 1 ML half, mixed, and fully dissociated catechol overlayers listed in Table 1 are shown in Figure 1. The 1 ML D D structure (Figure 1(a)) has two intermolecular OH–O (gray dashed lines) and two interfacial OH–C bonds (magenta dashed lines), the 1 ML D D structure (Figure 1(b)) has one intermolecular OH–O, one interfacial OH–C, and two interfacial OH–O bonds (black dashed lines), while the 1 ML D D structure (Figure 1(c)) has two interfacial OH–C and two interfacial OH–O bonds. In each case, interfacial deprotonation of the anchoring OH groups is accompanied by a charge transfer of to the nearest O atom, as depicted schematically in Figure 1. Such intermolecular and interfacial hydrogen bonding combinations have also been reported for the 1 ML methanol–TiO2(110) interface 35, 15. Figure 1 shows that the two tilting directions are inequivalent, with adjacent catechols tilted by and . For the OH–O interfacial hydrogen bonds, catechol tilts away from the OH moiety, while for the OH–C interfacial hydrogen bonds, catechol tilts towards the OH moiety. For the latter, the OH–C bond is mostly HO in character, with a minor C 2pπ contribution from the neighboring C atoms.
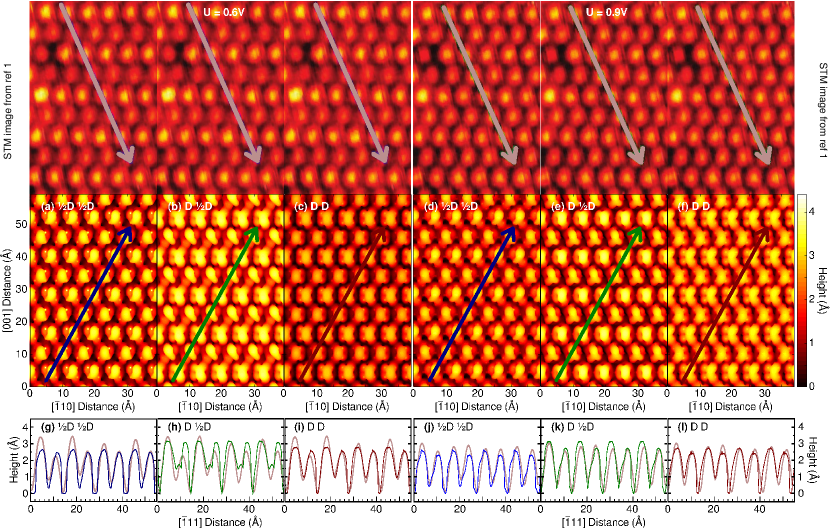
STM images of the catechol overlayer1, and simulated images for the D D, D D, and D D structures are shown in Figure 2. In order to reproduce the line scan’s minima, i.e., effective height, it is necessary to perform the line scan along the [] direction, as indicated by arrows in Figure 2(a–f). This is particularly important for the D D structure, where a line scan along the [] direction would not cross the computed STM minima. Comparing the measured and computed line scans along the [] direction, we thus conclude that the measured catechol overlayer is the mirror image of the computed structures shown in Figure 1.
Overall, the average heights from line scans and simulated STM images agree qualitatively for all three computed structures at both V ( Å, Å) and V ( Å, Å). However, the difference in height between neighbouring molecules is underestimated at V ( Å, Å), but agrees qualitatively at V ( Å, Å). Altogether, this indicates that the structure of the unoccupied levels at these biases are rather insensitive to the deprotonation of catechol’s anchoring OH groups. This is not surprising, considering the structural similarity of the benzene ring orientation for each type of overlayer shown in Figures 1 and 2.
In summary, STM provides direct information as to the relative orientation of catechol on the surface which forms the overlayer on TiO2(110). However, STM lacks direct information about deprotonation of the OH anchor groups. Such information is important, as it determines the relative level alignment of the molecule’s HOMO with the substrate’s VBM. To obtain direct information about the level alignment, one must compare the PDOS with UPS and IPES spectra.
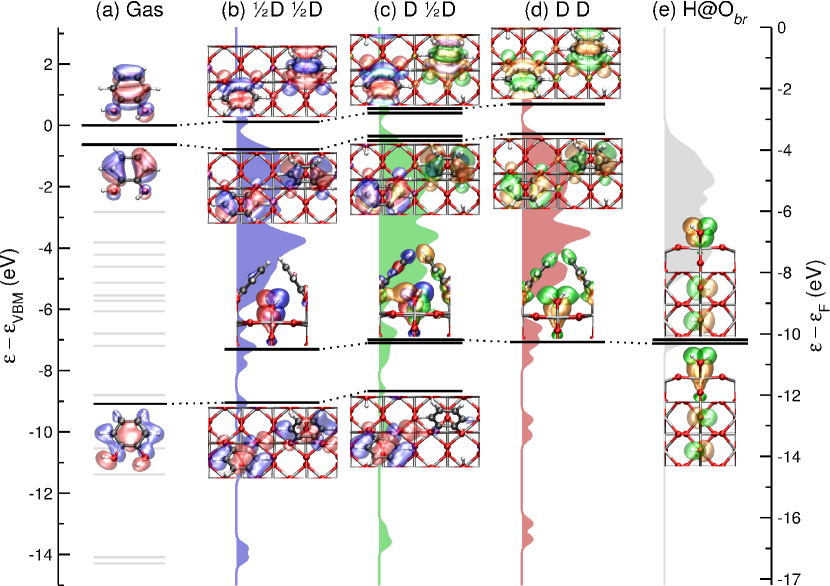
In Figure 3, we identify features of the PDOS which may be used to fingerprint the catechol overlayer’s structure. These features are the HOMO, HOMO, interfacial HO, and intermolecular HO–O levels associated with the half (blue/red) and fully (green/orange) dissociated surface catechol species. Dotted lines connect energy levels associated with the half or fully dissociated catechol species.
Although catechol’s gas phase spectrum contains many additional occupied and skeletal levels, shown in gray in Figure 3(a), these levels are rather insensitive to deprotonation of the OH anchor groups. For this reason, they are ineffective for distinguishing between D D, D D, and D D catechol overlayers on TiO2(110).
As a reference, the HOMO and HOMO levels of gas phase catechol are depicted in Figure 3(a), aligned relative to the molecule’s HOMO. Figure 3(b), (c), and (d) show that the HOMO and HOMO are pinned to each other, and shift up in energy with deprotonation of adsorbed catechol. This deprotonation of the OH anchor group induces a charge transfer of to the substrate. As charge is removed from the molecule, the HOMO and HOMO are destabilized. This effect is even more pronounced at the level, as the molecule’s ability to screen the HOMO and HOMO levels is also reduced as charge is transferred to the substrate15. Consequently, the energy separation between HOMO and VBM may be used to distinguish between half, mixed, and fully dissociated catechol overlayers on TiO2(110).
Another fingerprint of dissociated catechol is the presence of HO surface levels at eV below the experimental Fermi level. The HO level is a general feature of all the interfaces formed from rutile TiO2(110) and hydroxylated molecules, e.g., H2O and CH3OH16. As a reference, we show in Figure 3(e) both in and out of phase HO levels for 1 ML H@O, on TiO2(110)16. This structure is equivalent to ML dissociated H2O adsorbed on bridging O vacancies (H2O@O) of a reduced TiO(110) surface 16. In Figure 3(c,d) we show HO levels associated with adjacent OH–O bonds, while for (b), we show OH–C levels. For this reason, the HO levels in (b) have less weight on the benzene ring compared to (c,d). Despite the differences in reduction of the substrate between the systems depicted in Figures 3(b,c,d,e), the HO levels are surprisingly consistent in energy.
As can be seen in Figure 1(a), for D D, the HO groups are on every other O, whereas in Figure 1(b,c), the HO–O bonds for D D and D D are on adjacent O. For this reason, the HO levels are essentially isoenergetic in Figure 3(c,d,e), whereas in (b) the HO level is more stable by eV. This is consistent with the observed downshift by 0.1 eV of the HO surface levels upon reducing the coverage from 1 ML to ML H@O on TiO2(110) 16.
A peak at eV below the experimental Fermi level indicates the presence of intermolecular OH–O hydrogen bonding within the overlayer. On the one hand, this may be used to fingerprint the presence of catechol which is not fully deprotonated. On the other hand, its absence suggests the catechol overlayer is fully dissociated. These levels have significant -bonding character along the OH–O intermolecular hydrogen bond. This is combined with benzene skeleton orbitals. For the D D overlayer, the OH–O orbital has very little weight on the fully dissociated catechol molecule, as seen in Figure 3(c). In other words, the OH–O levels are mostly associated with D catechol molecules.
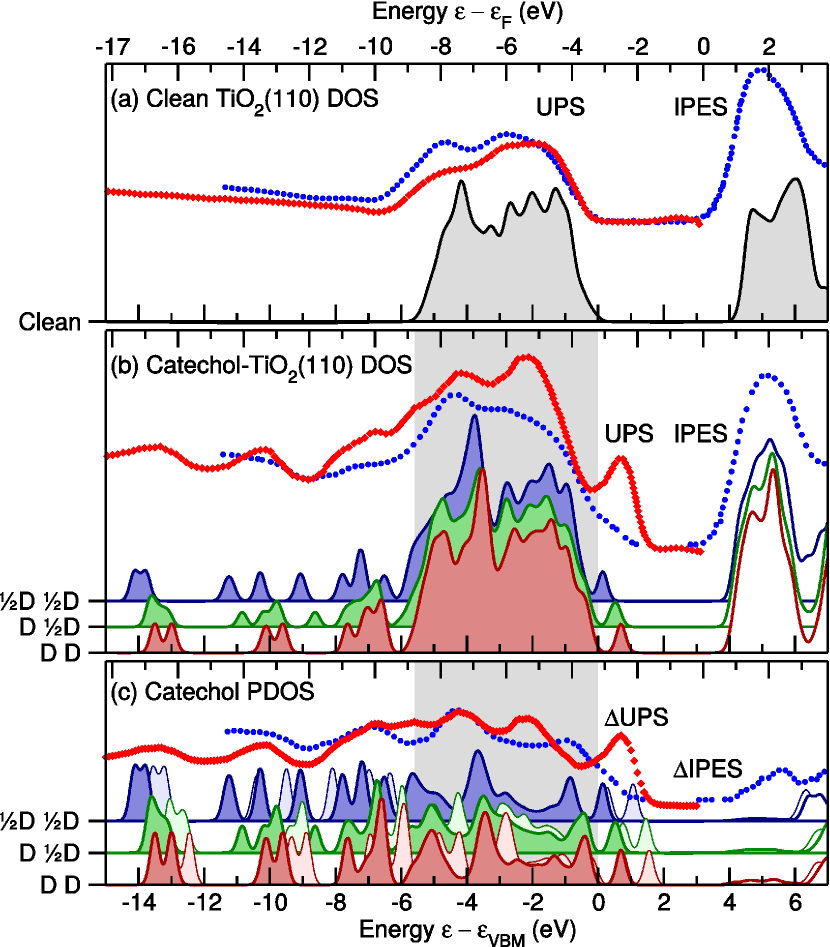
In Figure 4, we compare the DOS and PDOS for the clean, D D, D D, and D D catechol overlayers with IPES9 and UPS1 for the (a) clean, (b) catechol covered, and their (c) difference spectra. In each case, there are several peaks outside the clean surface’s VB region, shown in gray in Figure 4. These are the peaks which are most easily distinguishable from the surface levels. For overlayers which are highly hybridized with the surface, e.g., H2O and H covered TiO2(110) 16, 17, it is difficult to disentangle surface and molecular levels using the difference between experimental spectra for the covered and clean surfaces, i.e., difference spectra. Overall, our DOS and PDOS agree qualitatively with the UPS/IPES and UPS/IPES spectra for catechol on TiO2(110) from refs 1 and 9.
Although there is a nice alignment between the computed and measured spectra for unoccupied levels (Figure 4(b)), these substrate levels are hybridized with the catechol overlayer (Figure 4(c)). As a result, although the unoccupied DOS, PDOS, IPES and IPES levels agree, there is little to distinguish between the types of catechol overlayers. This is not at all surprising, as these levels are predominantly Ti 3d in character, and should hybridize equally well with D and D catechol. However, there is a noticeable increase in PDOS intensity for the D D structure. This is probably associated with a stronger coupling between O–Ti compared to HO–Ti. This results in a raising of the Ti atoms out of the TiO2(110) surface plane in Figure 1(c) for the D D catechol overlayer.
By comparing the UPS peaks outside the VB region to the DOS and PDOS, we find features suggestive of D D catechol in the UPS of ref 9, and D D catechol in the UPS of ref 1. However, differences in detection setup and resolution between refs 9 and 1 mean an absolute attribution of the measured spectra to D D and D D catechol, respectively, may be excessive. Nevertheless, comparing the UPS catechol covered and difference spectra from ref 9 with the spectra, we find the following three fingerprints of the D D spectra. (1) A shoulder eV above the VBM is suggestive of the D D catechol overlayer’s HOMO. (2) A peak at eV is suggestive of HO interfacial levels. (3) A peak at eV is suggestive of intermolecular OH–O hydrogen bonds. Performing a similar comparison to the catechol covered UPS from ref 1, and the resulting difference spectra, we find the same three fingerprints, but of the D D spectra. (1) A well-separated peak eV above the VBM is suggestive of the D D catechol overlayer’s HOMO. (2) A more intense peak at eV is suggestive of HO interfacial levels. (3) A significant dip in the spectra at eV suggests fewer intermolecular OH–O hydrogen bonds. Note that, as HO levels are associated with the TiO2(110) surface, this peak is absent from the PDOS, as the O atom is part of the surface.
In Figure 4(c), we also compare catechol’s PBE and HSE DFT PDOS for D D, D D, and D D overlayers on TiO2(110). In each case, the HSE DFT PDOS for occupied levels yields eV weaker binding energies than PBE . This upshift of the occupied molecular levels with HSE DFT is consistent with our previous results for the localized CH3OH’s a and H2O’s 3a1 and 1b2 levels on TiO2(110) 16, 23. On the other hand, for the unoccupied levels, catechol’s PDOS from HSE DFT and PBE are consistent with each other, as the unoccupied molecular levels are highly hybridized with the substrate. This reinforces the finding that HSE fails to provide an accurate description of the interfacial level alignment for localized molecular levels16, 23.
4. CONCLUSIONS
The structure of catechol overlayers on TiO2(110) is characterized by a complex network of interfacial and intermolecular hydrogen bonds. It is difficult to precisely establish the detailed structure of the catechol overlayer based solely on STM experiments. This is because simply deprotonating catechol’s anchoring groups, while nearly isoenergetic, strongly affects the position of the HOMO in this type II interface. Hence, the extent of catechol’s deprotonation on the surface determines the interface’s photovoltaic efficiency.
We combine level alignment with UPS measurements to identify the fingerprints of half, mixed, or fully dissociated catechol overlayers on TiO2(110). Only QP techniques, such as , are sufficiently accurate to robustly predict an eV energy difference between catechol’s HOMO position in the half and fully dissociated catechol overlayers. Moreover, besides the HOMO position, which indicates the extent of deprotonation of catechol’s OH anchoring groups, the absence of a peak at eV is indicative of a lack of intermolecular OH–O bonds. Likewise, the presence of a peak at eV suggests the presence of HO groups on the surface, which are formed upon deprotonation of catechol’s OH anchoring groups.
This distinct peak has also been observed for H2O dissociated on bridging O vacancies, i.e., H2O@O, of a reduced TiO2-x(110) surface 18, 14, 19, 16. This peak has previously been considered a fingerprint of dissociated H2O@O. However, we have shown this HO peak at eV may also arise from deprotonation of hydroxylated molecules on Ti. Further, the position of the HO peak is rather insensitive to the degree of substrate reduction. In UPS experiments, one should find this peak moves to slightly weaker binding energies as the coverage of HO is increased.
While the energy of the unoccupied levels is rather insensitive to deprotonation of catechol’s anchoring groups, the overlap of these substrate levels with those of the catechol overlayer increases with deprotonation. Combined with the destabilization of catechol’s HOMO with deprotonation, this suggests fully deprotonated catechol overlayers should have the greatest photovoltaic efficiency. This work provides a road map for future studies of catechol’s optical absorption based on the Bethe-Salpeter equation36, 37, and catechol’s subsequent rate of charge transport through the TiO2 substrate using non-equilibrium Green’s function methods38, 39.
ASSOCIATED CONTENT
![[Uncaptioned image]](/html/1508.00786/assets/x4.png) Supporting Information
Supporting Information
The Supporting Information is available free of charge on the ACS Publications website at DOI: 10.1021/acs.jpcc.5605392.
Comparison of and line scans
(PDF)
AUTHOR INFORMATION
Corresponding Author
E-mail: duncan.mowbray@gmail.com (D.J.M.).
E-mail: annapaola.migani@icn2.cat (A.M.).
Notes
The authors declare no competing financial interest.
ACKNOWLEDGMENTS
We acknowledge financial support from Spanish Grants (FIS2012-37549-C05-02, FIS2013-46159-C3-1-P, RYC-2011-09582, JCI-2010-08156); Generalitat de Catalunya (2014SGR301, XRQTC); Grupos Consolidados UPV/EHU del Gobierno Vasco (IT-578-13).
REFERENCES
- Li et al. 2009 Li, S.-C.; Wang, J.-g.; Jacobson, P.; Gong, X.-Q.; Selloni, A.; Diebold, U. Correlation between Bonding Geometry and Band Gap States at Organic–Inorganic Interfaces: Catechol on Rutile TiO2(110). J. Am. Chem. Soc. 2009, 131, 980–984
- Li et al. 2010 Li, S.-C.; Chu, L.-N.; Gong, X.-Q.; Diebold, U. Hydrogen Bonding Controls the Dynamics of Catechol Adsorbed on a TiO2(110) Surface. Science 2010, 328, 882–884
- Calzolari et al. 2012 Calzolari, A.; Ruini, A.; Catellani, A. Surface Effects on Catechol/Semiconductor Interfaces. J. Phys. Chem. C 2012, 116, 17158–17163
- Risplendi et al. 2013 Risplendi, F.; Cicero, G.; Mallia, G.; Harrison, N. M. A Quantum-Mechanical Study of the Adsorption of Prototype Dye Molecules on Rutile-TiO2(110): A Comparison between Catechol and Isonicotinic Acid. Phys. Chem. Chem. Phys. 2013, 15, 235–243
- Marom et al. 2014 Marom, N.; Körzdörfer, T.; Ren, X.; Tkatchenko, A.; Chelikowsky, J. R. Size Effects in the Interface Level Alignment of Dye-Sensitized TiO2 Clusters. J. Phys. Chem. Lett. 2014, 5, 2395–2401
- Duncan and Prezhdo 2005 Duncan, W. R.; Prezhdo, O. V. Electronic Structure and Spectra of Catechol and Alizarin in the Gas Phase and Attached to Titanium. J. Phys. Chem. B 2005, 109, 365–373
- Duncan and Prezhdo 2007 Duncan, W. R.; Prezhdo, O. V. Theoretical Studies of Photoinduced Electron Transfer in Dye-Sensitized TiO2. Annu. Rev. Phys. Chem. 2007, 58, 143–184
- Calzolari et al. 2011 Calzolari, A.; Ruini, A.; Catellani, A. Anchor Group versus Conjugation: Toward the Gap-State Engineering of Functionalized ZnO(100) Surface for Optoelectronic Applications. J. Am. Chem. Soc. 2011, 133, 5893–5899
- Rangan et al. 2010 Rangan, S.; Theisen, J.-P.; Bersch, E.; Bartynski, R. Energy Level Alignment of Catechol Molecular Orbitals on ZnO(110) and TiO2(110) Surfaces. Appl. Surf. Sci. 2010, 256, 4829–4833
- Hedin 1965 Hedin, L. New Method for Calculating the One-Particle Green’s Function with Application to the Electron-Gas Problem. Phys. Rev. 1965, 139, A796–A823
- Onida et al. 2002 Onida, G.; Reining, L.; Rubio, A. Electronic Excitations: Density-Functional versus Many-Body Green’s-Function Approaches. Rev. Mod. Phys. 2002, 74, 601–659
- Shishkin and Kresse 2006 Shishkin, M.; Kresse, G. Implementation and Performance of the Frequency-Dependent Method within the PAW Framework. Phys. Rev. B 2006, 74, 035101
- Planells et al. 2011 Planells, M.; Pelleja, L.; Clifford, J. N.; Pastore, M.; De Angelis, F.; Lopez, N.; Marder, S. R.; Palomares, E. Energy Levels, Charge Injection, Charge Recombination and Dye Regeneration Dynamics for Donor-Acceptor -Conjugated Organic Dyes in Mesoscopic TiO2 Sensitized Solar Cells. Energy Environ. Sci. 2011, 4, 1820–1829
- Brookes et al. 2001 Brookes, I. M.; Muryn, C. A.; Thornton, G. Imaging Water Dissociation on . Phys. Rev. Lett. 2001, 87, 266103
- Migani et al. 2013 Migani, A.; Mowbray, D. J.; Iacomino, A.; Zhao, J.; Petek, H.; Rubio, A. Level Alignment of a Prototypical Photocatalytic System: Methanol on TiO2(110). J. Am. Chem. Soc. 2013, 135, 11429–11432
- Migani et al. 2015 Migani, A.; Mowbray, D. J.; Zhao, J.; Petek, H. Quasiparticle Interfacial Level Alignment of Highly Hybridized Frontier Levels: H2O on TiO2(110). J. Chem. Theory Comput. 2015, 11, 239–251
- Sun et al. 2015 Sun, H.; Mowbray, D. J.; Migani, A.; Zhao, J.; Petek, H.; Rubio, A. Comparing Quasiparticle H2O Level Alignment on Anatase and Rutile TiO2. ACS Catal. 2015, 5, 4242–4254
- Kurtz et al. 1989 Kurtz, R. L.; Stock-Bauer, R.; Madey, T. E.; Román, E.; De Segovia, J. L. Synchrotron Radiation Studies of H2O Adsorption on TiO2(110). Surf. Sci. 1989, 218, 178–200
- Krischok et al. 2001 Krischok, S.; Höfft, O.; Günster, J.; Stultz, J.; Goodman, D.; Kempter, V. H2O Interaction with Bare and Li-Precovered TiO2: Studies with Electron Spectroscopies (MIES and UPS(HeI and II)). Surf. Sci. 2001, 495, 8–18
- Migani and Mowbray 2014 Migani, A.; Mowbray, D. J. Coverage dependence of the level alignment for methanol on TiO2(110). Comput. Theor. Chem. 2014, 1040–1041, 259–265
- Perdew et al. 1996 Perdew, J. P.; Burke, K.; Ernzerhof, M. Generalized Gradient Approximation Made Simple. Phys. Rev. Lett. 1996, 77, 3865
- Krukau et al. 2006 Krukau, A. V.; Vydrov, O. A.; Izmaylov, A. F.; Scuseria, G. E. Influence of the Exchange Screening Parameter on the Performance of Screened Hybrid Functionals. J. Chem. Phys. 2006, 125, 224106
- Migani et al. 2014 Migani, A.; Mowbray, D. J.; Zhao, J.; Petek, H.; Rubio, A. Quasiparticle Level Alignment for Photocatalytic Interfaces. J. Chem. Theory Comput. 2014, 10, 2103–2114
- Marques et al. 2011 Marques, M. A. L.; Vidal, J.; Oliveira, M. J. T.; Reining, L.; Botti, S. Density-Based Mixing Parameter for Hybrid Functionals. Phys. Rev. B 2011, 83, 035119
- Freysoldt et al. 2008 Freysoldt, C.; Eggert, P.; Rinke, P.; Schindlmayr, A.; Scheffler, M. Screening in Two Dimensions: Calculations for Surfaces and Thin Films using the Repeated-Slab Approach. Phys. Rev. B 2008, 77, 235428
- Kresse and Joubert 1999 Kresse, G.; Joubert, D. From Ultrasoft Pseudopotentials to the Projector Augmented-Wave Method. Phys. Rev. B 1999, 59, 1758
- Burdett et al. 1987 Burdett, J. K.; Hughbanks, T.; Miller, G. J.; Richardson, J. W.; Smith, J. V. Structural-Electronic Relationships in Inorganic Solids: Powder Neutron Diffraction Studies of the Rutile and Anatase Polymorphs of Titanium Dioxide at 15 and 295 K. J. Am. Chem. Soc. 1987, 109, 3639–3646
- Tersoff and Hamann 1985 Tersoff, J.; Hamann, D. R. Theory of the Scanning Tunneling Microscope. Phys. Rev. B 1985, 31, 805–813
- Sato 1998 Sato, N. Electrochemistry at Metal and Semiconductor Electrodes; Elsivier Science & Technology: Oxford, 1998
- Aono and Hasiguti 1993 Aono, M.; Hasiguti, R. R. Interaction and Ordering of Lattice Defects in Oxygen-Deficient Rutile TiO. Phys. Rev. B 1993, 48, 12406–12414
- Yamakata et al. 2003 Yamakata, A.; Ishibashi, T.; Onishi, H. Kinetics of the Photocatalytic Water-Splitting Reaction on TiO2 and Pt/TiO2 Studied by Time-Resolved Infrared Absorption Spectroscopy. J. Mol. Catal. A: Chem. 2003, 199, 85–94
- Tezuka et al. 1994 Tezuka, Y.; Shin, S.; Ishii, T.; Ejima, T.; Suzuki, S.; Sato, S. Photoemission and Bremsstrahlung Isochromat Spectroscopy Studies of TiO2 (Rutile) and SrTiO3. J. Phys. Soc. Jpn. 1994, 63, 347–357
- Mortensen et al. 2005 Mortensen, J. J.; Hansen, L. B.; Jacobsen, K. W. Real-Space Grid Implementation of the Projector Augmented Wave Method. Phys. Rev. B 2005, 71, 035109
- Enkovaara et al. 2010 Enkovaara, J. et al. Electronic Structure Calculations with GPAW: a Real-Space Implementation of the Projector Augmented-Wave Method. J. Phys.: Condens. Matter 2010, 22, 253202
- Zhao et al. 2009 Zhao, J.; Yang, J.; Petek, H. Theoretical Study of the Molecular and Electronic Structure of Methanol on a TiO2(110) Surface. Phys. Rev. B 2009, 80, 235416
- Salpeter and Bethe 1951 Salpeter, E. E.; Bethe, H. A. A Relativistic Equation for Bound-State Problems. Phys. Rev. 1951, 84, 1232–1242
- van Setten et al. 2011 van Setten, M. J.; Gremaud, R.; Brocks, G.; Dam, B.; Kresse, G.; de Wijs, G. A. Optical Response of the Sodium Alanate System: -BSE Calculations and Thin Film Measurements. Phys. Rev. B 2011, 83, 035422
- Meir and Wingreen 1992 Meir, Y.; Wingreen, N. S. Landauer Formula for the Current Through an Interacting Electron Region. Phys. Rev. Lett. 1992, 68, 2512–2515
- Mowbray et al. 2009 Mowbray, D. J.; Morgan, C.; Thygesen, K. S. Influence of O and N on the Conductivity of Carbon Nanotube Networks. Phys. Rev. B 2009, 79, 195431