Optical and near-infrared observations of SN 2013dx associated with GRB 130702A
Abstract
We present optical and near-infrared light curves and optical spectra of SN 2013dx, associated with the nearby (redshift 0.145) gamma-ray burst GRB 130702A. The prompt isotropic gamma-ray energy released from GRB 130702A is measured to be erg (1 keV to 10 MeV in the rest frame), placing it intermediate between low-luminosity GRBs like GRB 980425/SN 1998bw and the broader cosmological population. We compare the observed light curves of SN 2013dx to a SN 1998bw template, finding that SN 2013dx evolves % faster (steeper rise time), with a comparable peak luminosity. Spectroscopically, SN 2013dx resembles other broad-lined Type Ic supernovae, both associated with (SN 2006aj and SN 1998bw) and lacking (SN 1997ef, SN 2007I, and SN 2010ah) gamma-ray emission, with photospheric velocities around peak of 21,000 km s-1. We construct a quasi-bolometric () light curve for SN 2013dx, only the fifth GRB-associated SN with extensive near-infrared coverage and the third with a bolometric light curve extending beyond d. Together with the measured photospheric velocity, we derive basic explosion parameters using simple analytic models. We infer a 56Ni mass of M⊙, an ejecta mass of M⊙, and a kinetic energy of erg (statistical uncertainties only), consistent with previous GRB-associated supernovae. When considering the ensemble population of GRB-associated supernovae, we find no correlation between the mass of synthesized 56Ni and high-energy properties, despite clear predictions from numerical simulations that should correlate with the degree of asymmetry. On the other hand, clearly correlates with the kinetic energy of the supernova ejecta across a wide range of core-collapse events.
Subject headings:
gamma-ray burst: individual (GRB 130702A) — supernovae: individual (SN 2013dx)I. Introduction
The evidence for the association between long-duration gamma-ray bursts (GRBs) and the death of massive stars has been steadily growing over the last two decades (see Woosley & Bloom 2006 and Hjorth & Bloom 2012 for reviews). The first direct evidence of this link was a spatially and temporally coincident supernova (SN), SN 1998bw, with GRB 980425 at redshift (Galama et al., 1998; Iwamoto et al., 1998; Kulkarni et al., 1998). Since SN 1998bw, there have been a number of spectroscopically confirmed supernovae (SNe) associated with GRBs (Table 1).
| GRB-SN | References |
|---|---|
| GRB 980425/SN 1998bw | Galama et al. (1998); Iwamoto et al. (1998); Kulkarni et al. (1998) |
| GRB 030329/SN 2003dh | Stanek et al. (2003); Matheson et al. (2003) |
| GRB 031203/SN 2003lw | Malesani et al. (2004); Gal-Yam et al. (2004); Thomsen et al. (2004) |
| GRB 060218/SN 2006aj | Campana et al. (2006); Modjaz et al. (2006); Mirabal et al. (2006); Ferrero et al. (2006) |
| Sollerman et al. (2006); Pian et al. (2006); Kocevski et al. (2007) | |
| GRB 091127/SN 2009nz | Cobb et al. (2010); Berger et al. (2011) |
| GRB 100316D/SN 2010bh | Starling et al. (2011); Bufano et al. (2012); Olivares E. et al. (2012) |
| Cano et al. (2011); Chornock et al. (2010) | |
| GRB 120422A/SN 2012bz | Melandri et al. (2012); Schulze et al. (2014) |
| GRB 130427A/SN 2013cq | Xu et al. (2013); Levan et al. (2014); Melandri et al. (2014); Perley et al. (2014) |
| GRB 130702A/SN 2013dx | This work; D’Elia et al. (2015) |
| GRB 140606B/iPTF14bfu | Cano et al. (2015) |
Note. — We do not include the recent detection of GRB 111209A/SN 2011kl associated with a superluminous SN (Greiner et al., 2015) because it is believed to be powered by a magnetar and not solely powered by 56Ni.
While most, if not all low- long-duration GRBs appear to be accompanied by SNe (the exceptions being GRB 060614 and GRB 060505; Fynbo et al. 2006; Gal-Yam et al. 2006; Della Valle et al. 2006), only a small fraction of core-collapse explosions are capable of generating relativistic ejecta (Berger et al., 2003; Soderberg et al., 2010; Bietenholz et al., 2014). Even when limited to the specific subtype of SNe associated with GRBs, the broad-lined Type Ic SNe, those with and without relativistic ejecta appear to be indistinguishable based on their light curves (e.g., Drout et al. 2011). However, spectra of the host galaxies reveal that GRB-SNe prefer more metal-poor environments than Type Ic-BL SNe without associated GRBs (Modjaz et al., 2008; Graham & Fruchter, 2013).
Furthermore, within the GRB population, there is a considerable diversity in the observed prompt gamma-ray energies spanning six orders of magnitude, – erg. It has been suggested that low-luminosity GRBs ( erg) have “failed” jets that cannot pierce their stellar envelope and instead dissipate energy into the star to create relativistic shock breakout (Bromberg et al., 2011; Margutti et al., 2014; Nakar, 2015). But despite their very different appearance at high energies, as of yet there is no clear distinction between SNe associated with low-luminosity GRBs (e.g., SN 1998bw) and the larger (observed) cosmological population (e.g., SN 2003dh, SN 2013cq).
With still only a handful of well-observed examples, each new nearby GRB affords a unique opportunity to understand the central engine powering these outflows. In particular, we can probe the progenitor from two different angles by studying the SN simultaneously with the GRB. Here we present observations of SN 2013dx associated with GRB 130702A. At , SN 2013dx is sufficiently nearby to enable a detailed photometric and spectroscopic study of the SN evolution. Furthermore, with erg (for 1 keV to 10 MeV in the rest frame), the prompt-emission properties place GRB 130702A between most low-luminosity GRBs and the more energetic cosmological population.
Throughout this paper we use the convention and photon index . We assume a CDM model with H, , and (Bennett et al. 2014). All photometry is in the AB system (Oke & Gunn, 1983), and quoted uncertainties are 1 (68%) confidence intervals unless otherwise noted. Dates and times are UT in all cases.
II. GRB 130702A/SN 2013dx
GRB 130702A was detected by the Gamma-Ray Burst Monitor (GBM; Meegan et al. 2009) on the Fermi satellite at 00:05:23.079 on 2013 July 2 (Collazzi & Connaughton, 2013). As observed by the GBM, the prompt-emission duration111 is defined as the time over which a burst emits from 5% of its total measured counts to 95%. was s (50–300 keV). High-energy emission was also detected by the Fermi Large Area Telescope (LAT; Atwood et al. 2009; Cheung et al. 2013), as well as by Konus-Wind (Golenetskii et al., 2013). We adopted the Konus-Wind 20–1200 keV fluence of erg cm-2 (assuming a power-law spectrum with photon index ).
Employing the wide-field imaging and rapid transient identification capabilities of the Intermediate Palomar Transient Factory (iPTF; Law et al. 2009; Rau et al. 2009), Singer et al. (2013b) discovered the optical afterglow of GRB 130702A. The source, also referred to as iPTF13bxl, is located at (J2000.0) coordinates , .
Subsequently, the redshift of GRB 130702A was determined to be based on the detection of narrow host-galaxy emission lines ([O III] and H) at the afterglow location (Mulchaey et al., 2013b, a; D’Avanzo et al., 2013). Several other galaxies at or near this redshift located in the field indicate that GRB 130702A occurred in a group or cluster environment, which is highly unusual for a GRB (Kelly et al., 2013; D’Elia et al., 2015). The GRB host galaxy may be a metal-poor satellite of an adjacent massive spiral (SDSSJ142914.57+154619.3), which has an offset of only kpc in projected distance and km s-1 in line-of-sight velocity (Kelly et al., 2013).
At , the observed Konus-Wind fluence corresponds to an isotropic energy release of erg (1 keV to 10 MeV in the rest frame). This places GRB 130702A securely between the low-luminosity class of events represented by GRB 980425 / SN 1998bw and typical cosmologically distant events with erg.
Butler et al. (2013) reported a flattening of the optical afterglow 5.26 d after the burst. A spectrum taken d after the burst showed broad features resembling those of SN 1998bw (Schulze et al., 2013). Cenko et al. (2013) and D’Elia et al. (2013) obtained spectra that confirmed the presence of an emerging SN, dubbed SN 2013dx, and identified similarities with SN 1998bw and SN 2006aj. D’Elia et al. (2015) (hereafter D15) reported GRB 130702A/SN 2013dx light curve, spectra, and SN energetics properties with which we will compare throughout this paper.
| Instrument | Exposure | Wavelength Range | Slit | Grating/Grism | Airmass | ||
|---|---|---|---|---|---|---|---|
| (d) | (s) | (nm) | (″) | ||||
| 1.17 | DBSP | 1800 | 340–1000 | 1.0 | 1200/5000 1200/7100 | 1.06 | |
| 3.25 | DBSP | 1800 | 340–1000 | 1.0 | 600/4000 316/7500 | 1.36 | |
| 6.22 | DBSP | 1800 | 340–890 | 2.0 | 600/4000 600/10000 | 1.25 | |
| 9.33 | DEIMOS | 600 | 450–950 | 1.0 | 600/7500 | 1.19 | |
| 11.34 | DEIMOS | 600 | 490–1010 | 1.0 | 600/7500 | 1.32 | |
| 14.21 | DBSP | 1200 | 350–1000 | 1.5 | 600/4000 316/7500 | 1.27 | |
| 31.28 | DEIMOS | 900 | 450–950 | 1.0 | 600/7500 | 1.30 | |
| 33.27 | LRIS | 1200 | 330–1020 | 1.0 | 400/3400 400/8500 | 1.30 | |
| 330.39 | LRIS | 1460 | 330–1020 | 1.0 | 400/3400 400/8500 | 1.04 |
Note. — t is the time from Fermi trigger in observer frame.
III. Observations and Data Reduction
III.1. Optical/Near-Infrared Imaging
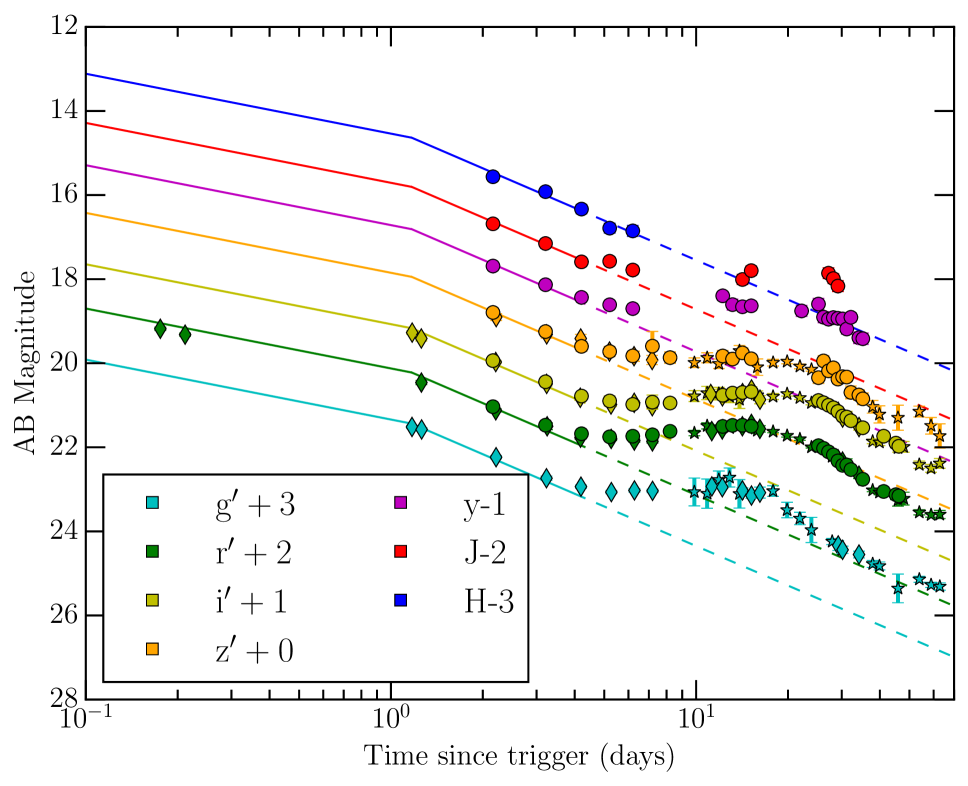
We obtained optical and near-infrared (NIR) images of the location of GRB 130702A / SN 2013dx with the robotic Palomar 60 inch telescope (P60; Cenko et al. 2006), the 2 m Liverpool Telescope (LT; Steele et al. 2004), the Reionization and Transients Infrared/Optical camera on the 1.5 m Harold L. Johnson Telescope (RATIR; Butler et al. 2012; Watson et al. 2012), the Large Monolithic Imager on the 4.2 m Discovery Channel Telescope (LMI/DCT), and the Low Resolution Imaging Spectrometer (LRIS; Oke et al. 1995) on the 10 m Keck-I telescope. Additionally, we included early-time Palomar 48-inch observations (0.17 d and 0.21 d after the GRB trigger) from Singer et al. (2013a). The reduction procedures for each individual facility are described below, while the resulting photometry is presented in Table 7 and plotted in Figure 1. Photometry from different telescopes is calibrated to same stars for uniform calibration. After removing extinction, afterglow, and host galaxy (see § IV.1), the cross-calibration errors are –0.05 mag (approximately 3–5% in flux).
III.1.1 P60 Photometry
P60 observed the location of GRB 130702A in the , , , and filters beginning 1.17 d after the Fermi GBM trigger. Basic CCD reductions are provided in real time by a custom IRAF222IRAF is distributed by the National Optical Astronomy Observatory, which is operated by the Association of Universities for Research in Astronomy (AURA), Inc. under cooperative agreement with the National Science Foundation (NSF)./PyRAF333See http://www.stsci.edu/institute/software_hardware/pyraf. pipeline. At later times ( d), images were stacked with SWarp (Bertin et al., 2002) on a nightly basis to increase the signal-to-noise ratio (SNR). We performed aperture photometry at the afterglow location, calibrating with respect to nearby point sources from the Sloan Digital Sky Survey (SDSS; Aihara et al. 2011).
III.1.2 LT Photometry
LT began observing the location of GRB 130702A with the IO:O CCD camera 9.87 d after the GBM trigger. Observations were obtained in the , , , and filters. Standard reduction techniques were applied to detrend the data, and photometry was performed in the same manner as for the P60 images (including the same SDSS reference stars for photometric calibration).
III.1.3 RATIR Photometry
RATIR obtained simultaneous multi-color () imaging of the location of GRB 130702A beginning 2.16 d after the GBM trigger. The RATIR data were reduced using an automatic python pipeline with bias subtraction and twilight-sky flat fielding. Given the lack of a cold shutter in RATIR’s design, IR dark frames were not available. Laboratory testing, however, confirmed that the dark current is negligible in both IR detectors (Fox et al., 2012). Astrometric solutions were calculated from astrometry.net (Lang et al., 2010) and the individual frames are stacked using SWarp.
We performed aperture photometry on the resulting stacked images using Sextractor (Bertin & Arnouts, 1996) with an inclusion radius determined from the median full width at half-maximum intensity (FWHM) of the images. The resulting instrumental magnitudes were compared to SDSS in the optical and 2MASS (Skrutskie et al., 2006) in the NIR to calculate zeropoints. For the band, we created a spectral energy distribution (SED) from the combination of optical and NIR catalog sources and interpolated to the appropriate wavelength. To place all photometry on the AB system, we used the - and -band offsets from Blanton & Roweis (2007).
III.1.4 Keck/LRIS Photometry
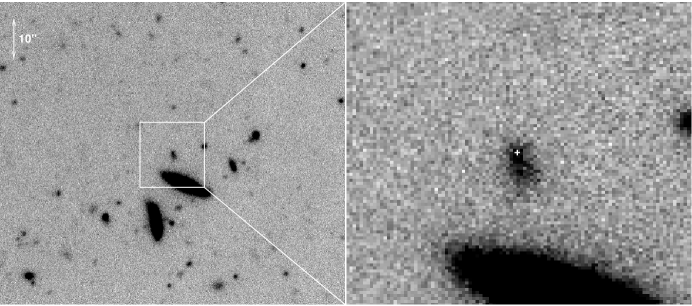
The location of GRB 130702A was observed with Keck/LRIS on 2014 May 28 ( d) in the , , and -band filters. The resulting images were reduced using the LPipe package444See http://www.astro.caltech.edu/~dperley/programs/lpipe.html for details.. Because the host galaxy was clearly resolved in some of the better-seeing images (FWHM = 075), we adopted an aperture radius of 15 to incorporate all of the flux from the visible extent of the galaxy (Figure 2). Photometric calibration was performed relative to point sources from SDSS.
III.1.5 Keck/MOSFIRE Photometry
We imaged the location of GRB 130702A with the Multi-Object Spectrometer For InfraRed Exploration (MOSFIRE; McLean et al. 2012) on the 10 m Keck I telescope on 2014 June 16. Images were obtained in the and filters and reduced using custom IDL scripts. We performed aperture photometry using a 15 inclusion radius (see § III.1.4), with photometric calibration relative to 2MASS.
III.1.6 LMI/DCT Photometry
The location of GRB 130702A was observed with LMI/DCT on 2015 March 27 ( d) in the , , , and filters. The resulting images were detrended with a custom IRAF pipeline. Individual frames were astrometrically aligned with Scamp (Bertin, 2006) and coadded using SWarp. Photometry was calculated in the manner described in § III.1.3.
III.2. Optical Spectroscopy
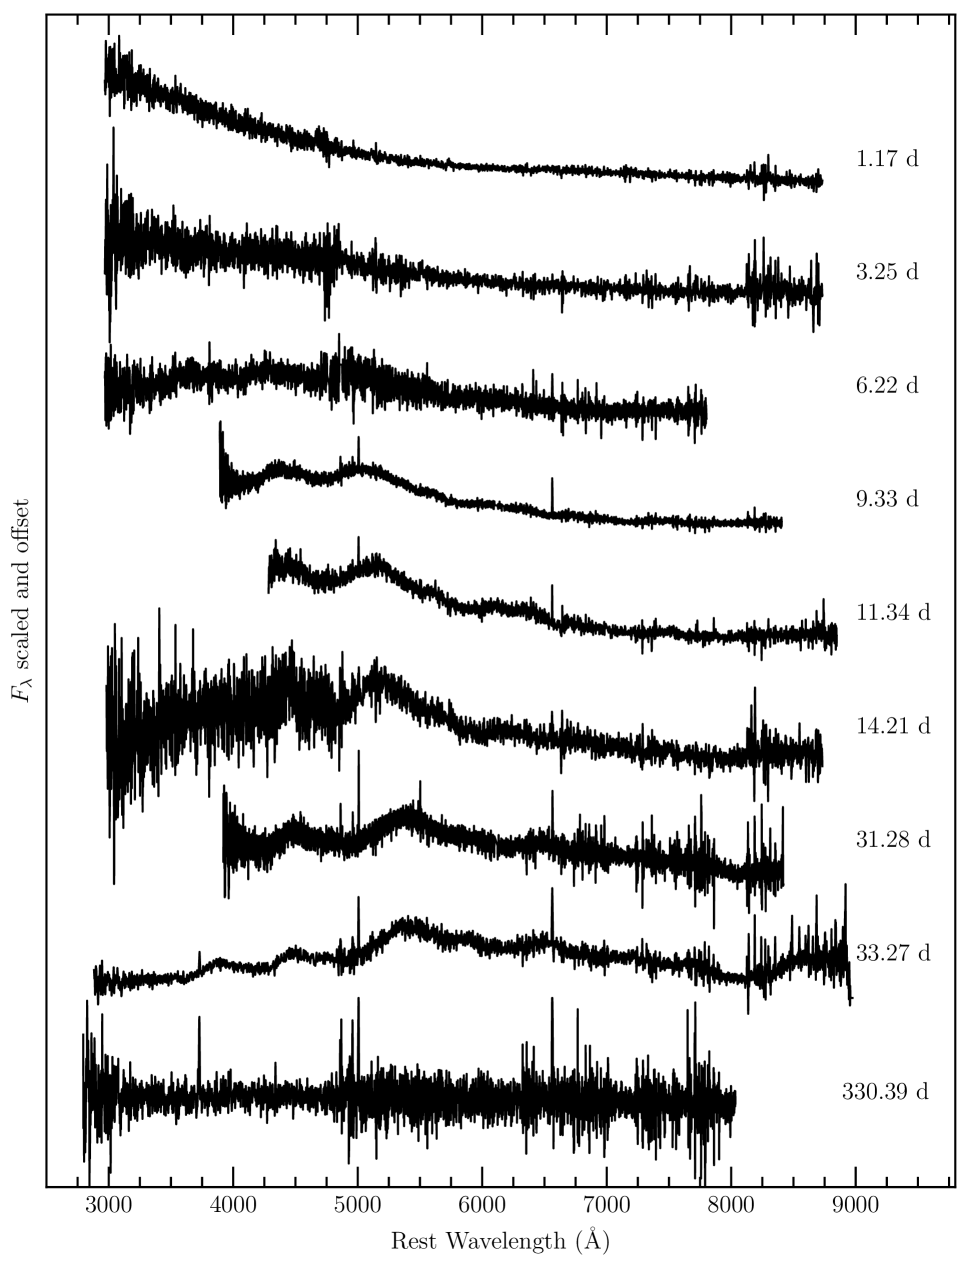
We obtained a series of optical spectra of GRB 130702A, beginning at d after the Fermi-GBM trigger, with the Double Spectrograph (DBSP; Oke & Gunn 1982) on the 5 m Palomar Hale telescope, Keck/LRIS on Keck-I, and the DEep Imaging Multi-Object Spectrograph (DEIMOS; Faber et al. 2003) on the 10 m Keck-II telescope. An observing log is presented in Table LABEL:tab:spec. All spectra were obtained with the slit oriented at the parallactic angle to minimize differential losses due to atmospheric dispersion (Filippenko 1982; though note also that LRIS employs an Atmospheric Dispersion Corrector to further mitigate against differential slit losses). The resulting reduced one-dimensional spectra are displayed in Figure 3.
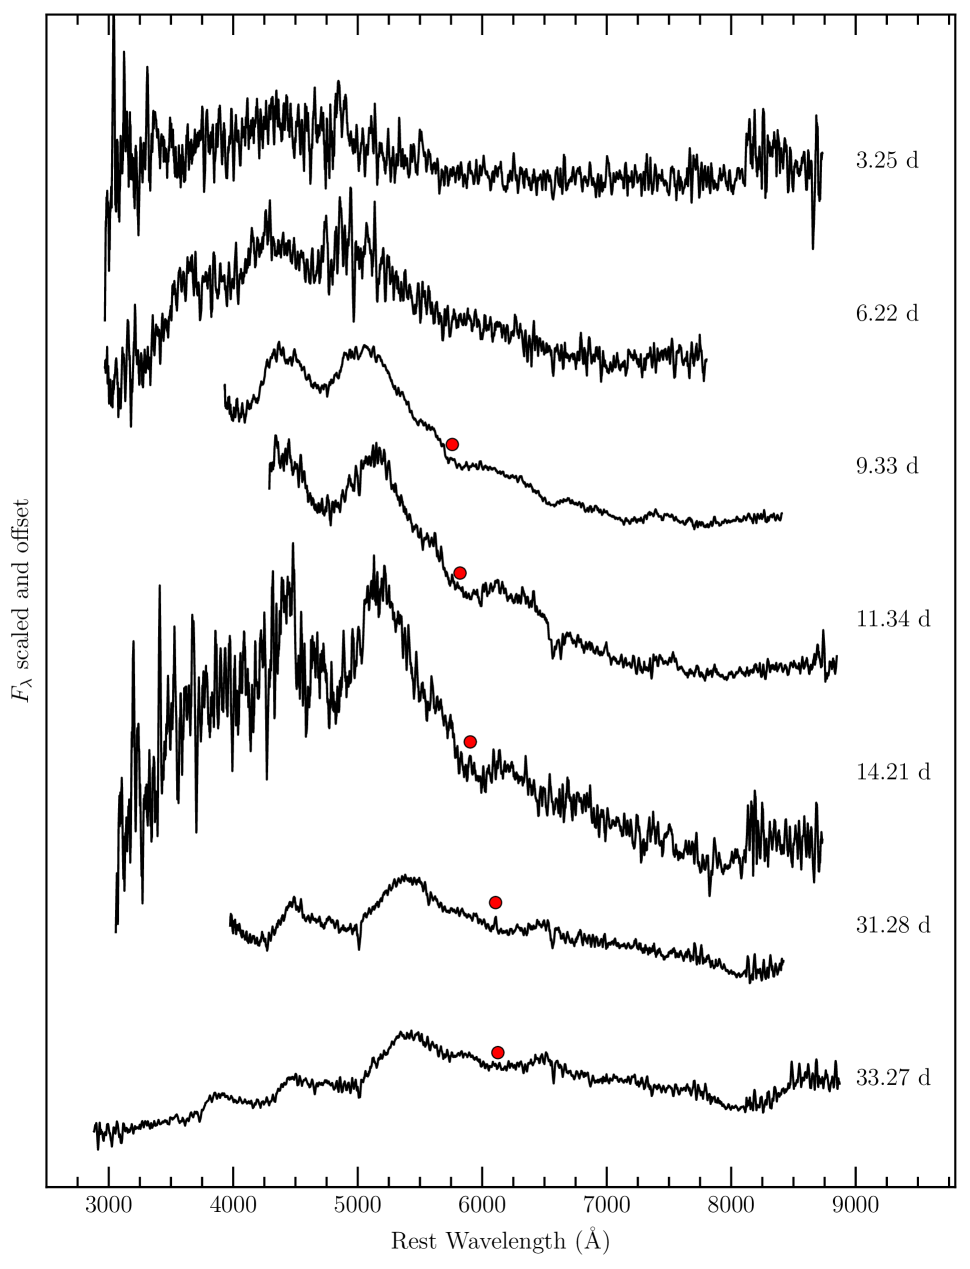
All spectra were reduced using standard routines and optimally extracted (Horne, 1986) within the IRAF environment (see, e.g., Cenko et al. 2008 for details). A dispersion solution was computed using calibration spectra of comparison lamps, and then adjusted for each individual exposure using night-sky emission lines. For the LRIS and DEIMOS spectra, sky background emission was subtracted using the algorithm described by Kelson (2003). Telluric atmospheric absorption features were removed using the continuum from spectrophotometric standard stars (Wade & Horne, 1988; Matheson et al., 2000). Finally, a sensitivity function was applied using observations of spectrophotometric standards at a comparable airmass. We caution that the final Keck/LRIS spectrum obtained at suffered from a failure of the blue shutter, which may impact the relative-flux calibration.
Upon publication of this manuscript, all one-dimensional spectra will be made publicly available via the Weizmann Interactive Supernova data REPository (WISeREP; Yaron & Gal-Yam 2012).
III.3. X-Ray Observations
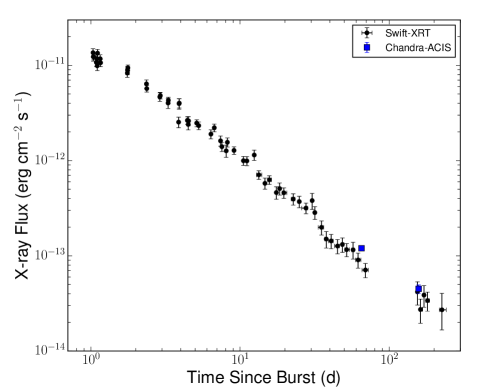
The afterglow of GRB 130702A was observed by the X-Ray Telescope (XRT; Burrows et al. 2005) onboard the Swift satellite (Gehrels et al., 2004) beginning at d after the Fermi-GBM trigger (e.g., Singer et al. 2013a). We downloaded the X-ray light curves from the XRT Light Curve Repository555See http://www.swift.ac.uk/xrt_curves and the associated description in Evans et al. (2009).. The time-averaged spectrum was well described (W-stat for 374 degrees of freedom) by a power-law model, , with no evidence for in excess of the Galactic value ( cm-2; Kalberla et al. 2005).
We initiated deep X-ray follow-up observations of GRB 130702A with the Chandra X-ray Observatory on 2013 September 5, corresponding to d since trigger (PI R. Margutti). The data were reduced with the CIAO software package (version 4.6) and corresponding calibration files. Standard ACIS data filtering has been applied. In 14.9 ks of observations we find clear evidence for X-ray emission at the location of GRB 130702A, with significance . The spectrum was well modeled by an absorbed power law with , consistent with the Swift-XRT time-averaged spectrum. We found no evidence for an intrinsic absorption component, with a limit of . Adopting these spectral parameters, the unabsorbed flux is (0.3–10 keV).
A second epoch of Chandra observations was obtained on 2013 December 6 ( d) with an exposure time of 34.6 ks. GRB 130702A was clearly detected with significance , which allows us to constrain the spectral evolution (or lack thereof) of GRB 130702A at very late times. Our spectral analysis reveals no evidence for spectral evolution. The best-fitting power-law index was , with at confidence level. The corresponding unabsorbed flux is (0.3–10 keV).
The X-ray light curve of GRB 130702A, comprising Swift-XRT and Chandra observations, is presented in Figure 4.
IV. Light-Curve Analysis
IV.1. Isolating the Supernova Component
Emission from the location of GRB 130702A results from three distinct components: the GRB afterglow, the associated SN, and the underlying host galaxy. Here we try to isolate the emission resulting from the associated SN, including a proper accounting for line-of-sight extinction, in order to study the properties of SN 2013dx.
First, we correct our broadband photometry for extinction, both in the Milky Way and in the host galaxy. For the Galactic component, we employ the dust-map calibration of Schlafly & Finkbeiner (2011), resulting in mag, and the Milky Way extinction law of Cardelli et al. (1989). In order to estimate the host extinction, , we create an SED at d from linear interpolation. We assume the observed emission at this stage will be dominated by the (synchrotron) afterglow, and thus we fit the SED to a simple power-law model of the form (e.g., Sari et al. 1998). We incorporate as a free parameter, assuming a Small Magellanic Cloud (SMC)-like extinction law (Pei, 1992). We find mag and with a reduced . Adopting Large Magellanic Cloud (LMC) and Milky Way (MW) dust extinction laws did not alter the derived parameters or fit quality. For the rest of this paper we assume mag. This is consistent with other GRB host-extinction values: 50% of GRBs have mag and 87% of GRBs have mag (Covino et al., 2013).
Next, we attempt to remove any contribution from the afterglow. Singer et al. (2013a) modeled the early-time optical emission ( d) as a broken power law with an initial decay index of up to the break time, d, after which the model followed a power-law decay index of . We repeat this analysis with our larger photometric dataset and find mostly consistent results. However, even as early as several days post-trigger, the observed emission will likely have some contribution from the emerging SN (e.g., the broad features becoming apparent in the d DBSP spectrum in Figure 5). Consequently, the true afterglow decay index may be steeper than indicated here.
Instead, we consider the decay of the corresponding X-ray emission, which is unlikely to be contaminated by the SN at d. We fit the X-ray light curve to a power-law model and find . Combining this with the measured X-ray spectral index from the Swift-XRT data, , we can use standard afterglow closure relations (e.g., Racusin et al. 2009, and references therein) to evaluate where the X-rays fall on the broadband synchrotron spectrum. The best fit is found for a constant-density circumburst medium with the X-rays falling below the synchrotron cooling frequency, .
As a result, the optical bandpass must fall below as well, which is consistent with the measured X-ray to optical spectral index of at d. Thus, since the optical emission falls on the same segment of the SED as the X-rays, it should decay with the same power-law index, . We further assume that both the optical afterglow spectral and temporal indices remain constant in time over the course of our observations. We use this model to calculate the afterglow contribution for all our photometric observations.
We note that this is a significantly shallower decay index than the adopted by D15, who did not incorporate multi-wavelength observations into their afterglow analysis. A steeper may overestimate the SN flux at early times, but is negligible at the peak and late times when the SN is significantly brighter than the afterglow.
Finally, we must remove the contribution from the underlying host galaxy. In our best-seeing images at late times (FWHM 075), the host is clearly resolved, with the afterglow/SN location falling on a blue “knot” to the north (Figure 2). This location is also responsible for the nebular emission lines seen in the final Keck/LRIS spectrum (Figure 3).
To remove the host contribution from our photometry, we adopt host flux values from our late-time DCT () and Keck/MOSFIRE () imaging and directly subtract these from the measured transient fluxes. While this does not account for the resolved nature of the host, since the typical seeing in our SN data ( 15) is comparable to the size of the extended emission, this should have minimal impact on the resulting photometry. We do not have host-galaxy detections in the y and H bands, but the host contribution is negligible compared to the afterglow and SN components.
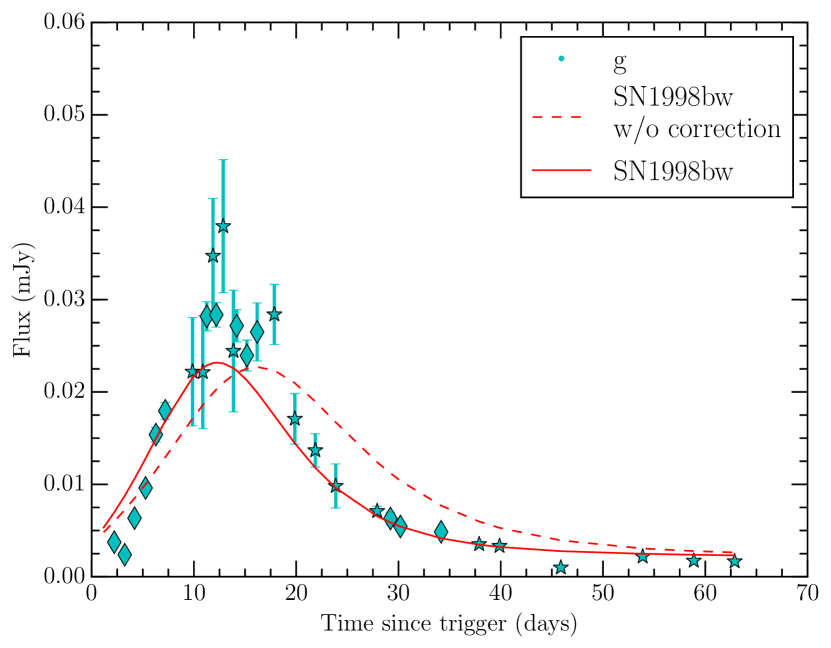
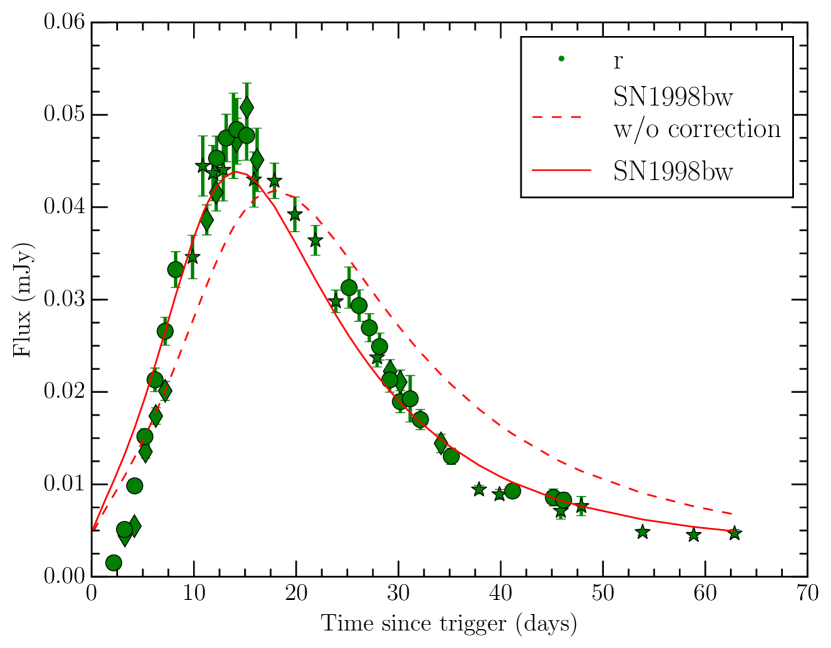
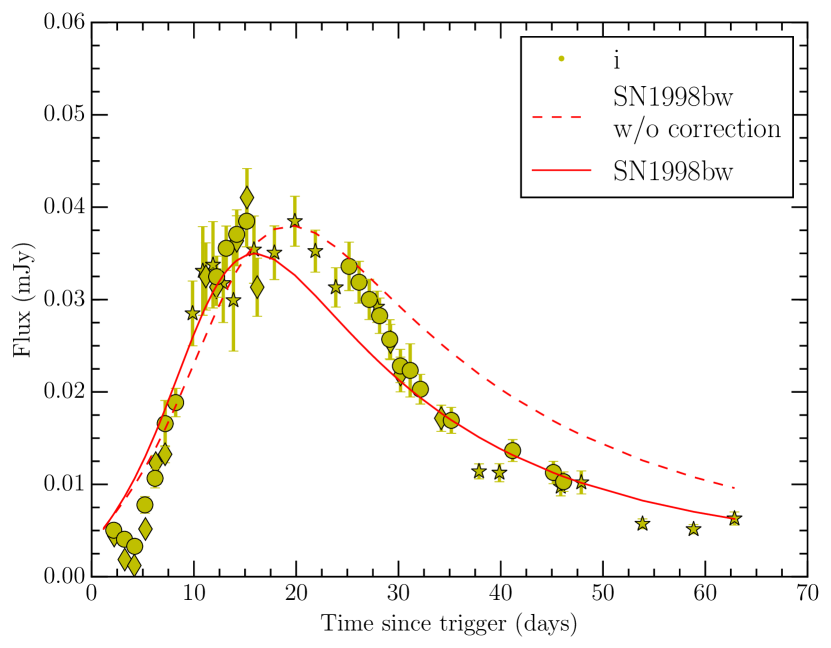
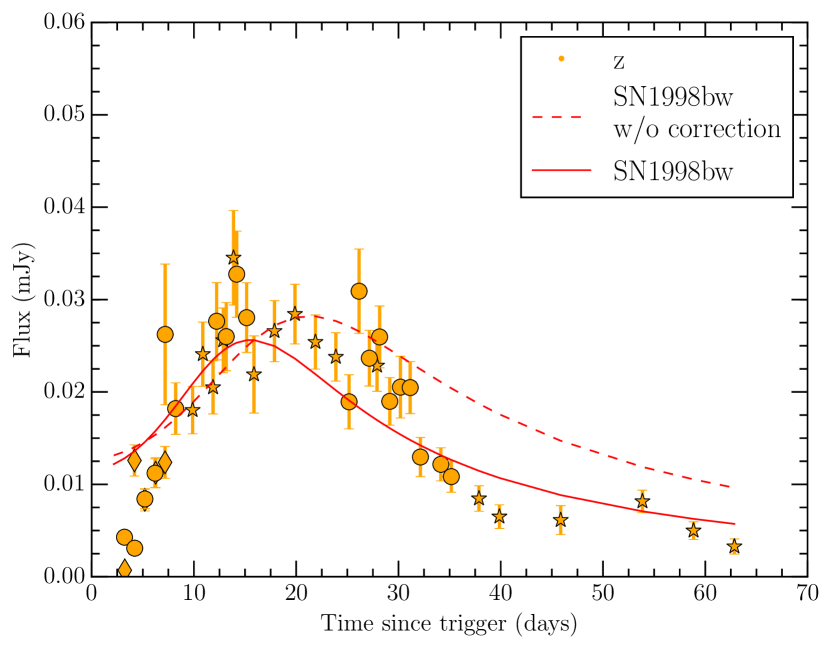
The resulting SN light curves are displayed in Figure 6. The peak times of the light curves are useful for constraining theoretical models, in particular the convolution of total ejected mass, kinetic energy, and opacity of the SN explosion (via the diffusion time). We measure the rest-frame peak times by fitting a second-order polynomial at d and find the following: d, d, d, and d (statistical uncertainties only). These values generally agree well with those reported by D15. We do not include peak times for because the data are not well sampled close to the peak.
There is marginal evidence in the -band light curve (Figure 6) of a decline in flux at early times ( d). This is consistent with early signatures of shock cooling (e.g., SN 2006aj, Campana et al. 2006; SN 2010bh, Cano et al. 2011). However, shock breakout should be significantly stronger in bluer bands and we see no indication of it in either the or bands. The relatively bright optical afterglow of GRB 130702A, compared to the optical afterglows of (for example) GRB 060218 and GRB 100316D, greatly complicates isolating the SN component at early times. Thus, it is difficult to reach firm conclusions regarding the presence or absence of a shock-breakout signature.
| Filter | |||
|---|---|---|---|
| 0.76 0.05 | 1.02 0.06 | 7.78 | |
| 0.79 0.01 | 1.05 0.02 | 4.67 | |
| 0.82 0.02 | 0.92 0.03 | 4.07 | |
| 0.74 0.04 | 0.91 0.05 | 2.85 |
IV.2. Comparison with SN 1998bw
Following past studies of GRB-associated SNe in the literature, we next attempt to compare SN 2013dx to the well-studied SN 1998bw (associated with GRB 980425). We create K-corrected synthetic SN 1998bw light curves in the filters at the redshift of SN 2013dx, , using methods described by Hogg et al. (2002). We utilize SN 1998bw photometry and spectra from Clocchiatti et al. (2011), Galama et al. (1998), Sollerman et al. (2002), and Patat et al. (2001). The K-corrected synthetic SN 1998bw light curves were also time dilated to match the observer frame of SN 2013dx.
Owing to gaps in the temporal coverage of SN 1998bw photometry, especially in the rising phase, we fit the synthetic SN 1998bw light curve in each filter with the empirical functional form from Cano et al. (2011),
| (1) |
allowing to vary. The resulting SN 1998bw synthetic light curves are plotted as dashed lines in Figure 6.
We then assume the light curves of SN 2013dx in each of our four filters can be modeled by simply varying the peak amplitude () and stretch factor ():
| (2) |
The resulting fits are plotted in Figure 6, while the measured stretch and amplitude values are displayed in Table 3. We find that SN 2013dx has a peak flux comparable to that of SN 1998bw in all four filters reported here (slightly more luminous in the bluer filters, and slightly less luminous in the redder filters). With a constant stretch value of in all four filters, the evolution of SN 2013dx (in particular the rise time) is noticeably faster than that of SN 1998bw.
However, it is also clear from the fits that SN 1998bw is not an ideal match to SN 2013dx, especially in the redder - and -band filters. Given these important differences, we refrain from drawing any physical inferences (e.g., , ) from these fits, and instead use the more model-independent bolometric light curve in § VI.
Cano (2014) and Lyman et al. (2014a) suggested that GRB-SNe can be used as standardizable candles. Cano (2014) proposed that and (measured relative to SN 1998bw) are analogous to the absolute peak SN magnitude and the amount the light curve fades from maximum light to 15 d later () used in the Phillips relation (Phillips, 1993) for SNe Ia. We add the uncertainties from our and fit in quadrature and find that our measurements of SN 2013dx deviate by from the Cano (2014) fits. The worst fits to Cano (2014) are for and at ; however, is within . This further supports the notion that SN 1998bw is not a perfect match for all GRB-associated SNe.
IV.3. Bolometric Light Curve
We construct the quasi-bolometric light curve of SN 2013dx using our photometry in the , , , , , and filters ( had only upper limits at d). We include synthetic photometry for d from our spectra (see § V.1) to supplement photometric coverage at these epochs. We assume a 10% flux error on all synthetic photometry data points. We convert the extinction, host-galaxy, and afterglow-corrected magnitudes to monochromatic fluxes and create SEDs from linear interpolation of the data for each epoch between 1 d and 70 d with 0.25 d spacing. Epochs that are d from observations are removed to mitigate linear-interpolation errors, which only affects observations in the and bands (see below). We assume that the flux is constant across the bandwidth of each filter and use trapezoidal integration to calculate the quasi-bolometric luminosity. We note that our photometry provides coverage over the observer-frame bandpass 0.4–1.35 m (rest-frame 0.35–1.18 m).
At –25 d and d, the - and -band data are relatively sparse. We therefore calculate the bolometric luminosity for the entire light curve both including and () and excluding them () to determine the NIR to integrated flux ratio. We find that the fraction of flux at these wavelengths increases monotonically as a function of time, from 13% at d to 23% at d. For epochs when only observations were available, we add a fractional NIR contribution for the - and -band from our linear fit. At late times we adopt the last NIR ratio measurement at d of % instead of extrapolating our linear fit. This may underestimate the NIR contribution at late times. Our NIR contribution measurements are consistent with an analogous measurement for SN 2008D (Modjaz et al., 2009), though slightly smaller than for SN 2009bb and SN 2010bh (Cano et al., 2011), which have maximum NIR contributions of 35–45% at d.
The resulting bolometric light curve is displayed in Figure 7. Our associated uncertainty measurements incorporate errors from the flux measurements, as well as bandpass uncertainties, but do not include errors introduced from linear interpolation.

Lyman et al. (2014b) have created a model for core-collapse SN bolometric corrections using two filters for nearby events. The corrections include ultraviolet and NIR contributions. Since SN 2013dx is at , we use our K-corrected spectra (see §V.1) to extract and synthetic photometry. We apply the methodology described by Lyman et al. (2014b) and find that this model leads to excellent agreement with our brute-force bolometric light curve. This confirms that we are not underestimating the ultraviolet and NIR contributions in our quasi-bolometric light curve.
V. Spectral Analysis
V.1. Isolating the SN Component
In a similar manner to that of § IV.1, we wish to isolate the SN component from our spectroscopic observations of GRB 130702A. First, for absolute-flux calibration, we normalize our spectra to (uncorrected) broadband photometry at the appropriate epoch. This accounts for slit losses caused by variable seeing.
We next deredden our spectra of SN 2013dx in an analogous manner to that of § IV.1. This includes contributions from both the Milky Way [ mag] and the host galaxy ( mag).
To remove the afterglow contribution, we assume that the spectrum can be described at all times (and frequencies) as a power law of the form , with and (§ IV.1). We normalize this function to our (extinction-corrected) broadband photometry, and subtract the appropriate power-law model at the epoch of each spectrum.
Finally, we fit the LMI/DCT late-time photometry to a variety of template galaxies from Kinney et al. (1996). Similar to D15, we find that the best-fit template is a starburst galaxy, and we adopted this (appropriately normalized) as the host contribution to the spectra. We take this approach instead of using our final Keck/LRIS spectrum because of the blue-shutter failure.
After these corrections, only the SN component remains. Figure 5 displays the resulting spectra of SN 2013dx after smoothing. We exclude the first spectrum ( d) because it is completely afterglow dominated. In addition, we manually excise nebular emission lines from the host galaxy of SN 2013dx.
V.2. Comparison with Other Type Ic-BL SNe
The early-time spectra of SN 2013dx are fairly featureless, but after a week, broad ( km s-1) features appear. Together with the lack of obvious H and He emission, this leads us to classify SN 2013dx as a broad-lined Type Ic SN (Ic-BL), as has been the case for essentially all well-studied GRB-associated SNe thus far (e.g., Woosley & Bloom 2006).
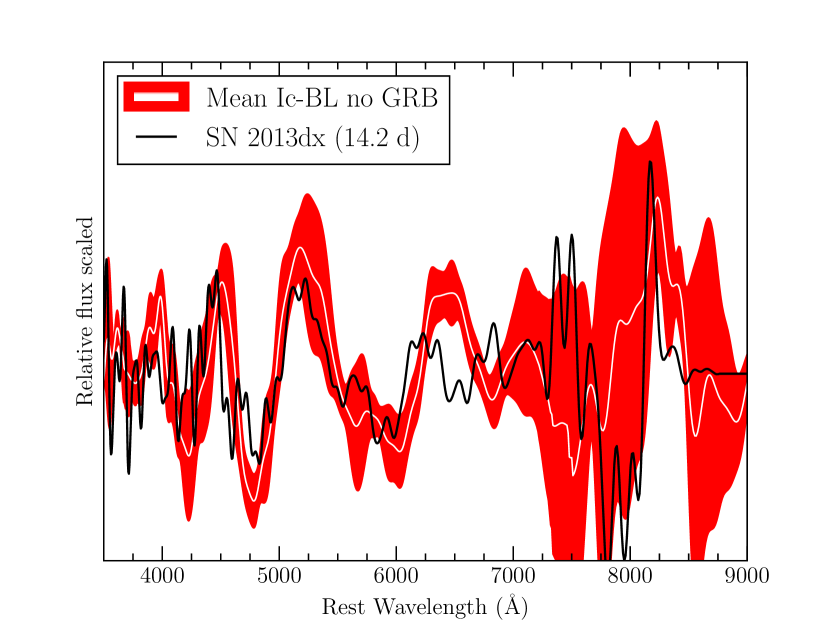
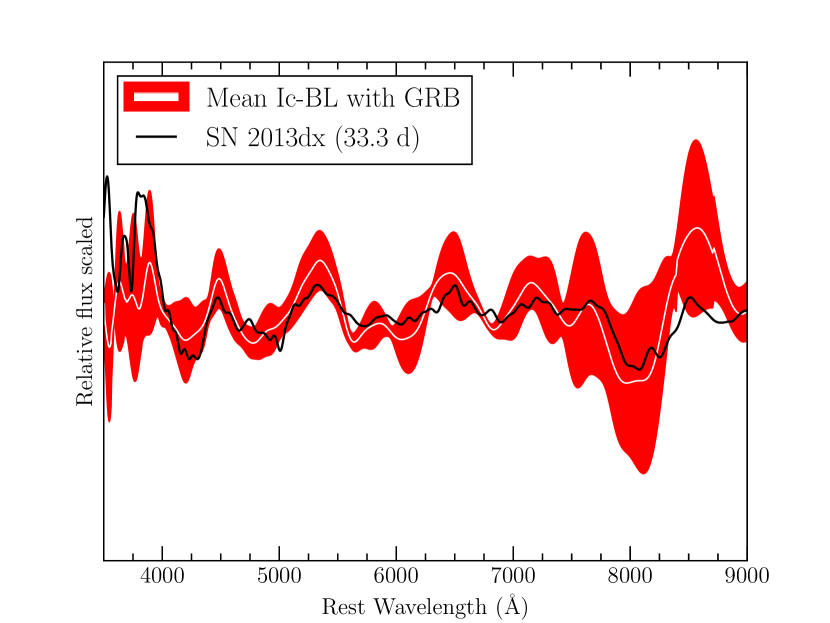
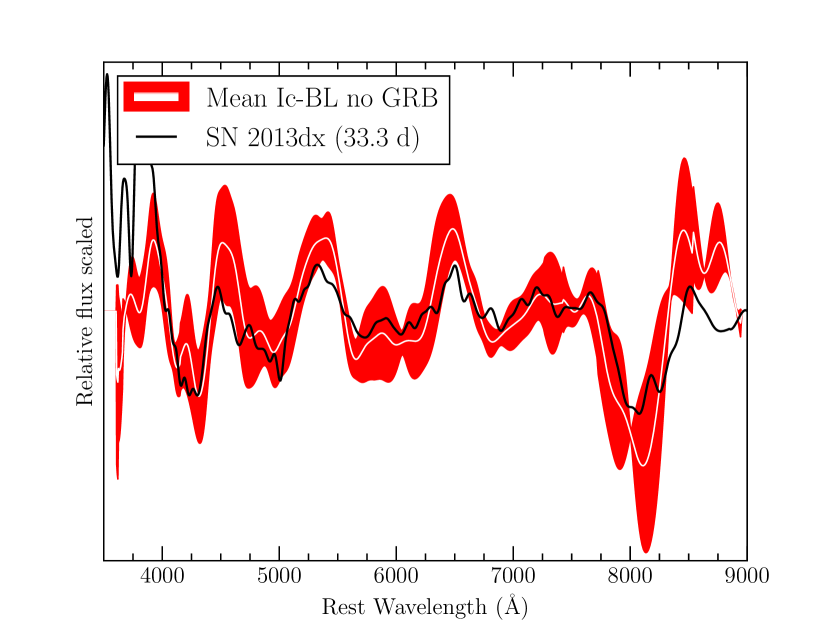
In Figure 8, we plot the spectrum of SN 2013dx obtained around maximum light ( d) and at late times ( d) with pseudocontinuum removed, bandpass filtered, scaled, and binned to a common logarithmic wavelength scale along with mean spectra of Type Ic-BL SNe both with and without GRBs from Modjaz et al. (2015). We note that the mean spectra include spectra of SN 2013dx from D15, but this is one of many objects. The absorption features from mean Type Ic-BL SNe both with and without GRBs align well with SN 2013dx absorption features. This indicates that SN 2013dx has similar photospheric velocities as other Type Ic-BL SNe.
At maximum light SN 2013dx has a similar blueshifted, broad Si II 6355 line as both SNe Ic-BL with and without GRBs. The blended Fe II absorption feature around a blueshifted wavelength of 4800 Å is similar to that of SNe Ic-BL with GRBs but is weaker than that of SNe Ic-BL without GRBs. SN 2013dx has a stronger Ca II absorption feature around 7900 Å and weaker O I absorption feature around 7200 Å than most SNe Ic-BL both with and without GRBs.
At later epochs, SN 2013dx does not deviate from the mean SN Ic-BL both with and without GRBs except beyond 8200 Å. However, the relative variation from the continuum seems weaker than the mean spectra of both SNe Ic-BL with and without GRBs. SN 2013dx has a similar Ca II absorption feature around 7900 Å as SNe Ic-BL with GRBs but weaker than that of SNe Ic-BL without GRBs.
To search for other similar objects in the literature, we use the cross-correlation tool SN Identification code (SNID; Blondin & Tonry 2007). Several SNe Ic-BL that were not associated with GRBs, such as SN 1997ef (Iwamoto et al., 2000) and SN 2007I (Blondin et al., 2007; Modjaz et al., 2014), also provide good matches to SN 2013dx. In addition, D15 highlight similarities to the energetic SN 2010ah (PTF10bzf; Corsi et al. 2011; Mazzali et al. 2013).
V.3. Photospheric Velocity Measurements
In order to estimate the photospheric velocity of SN 2013dx, we measure the velocity of the most prominent spectral feature, the Si II 6355 Å absorption line. We employ a fitting code in IDL that removes a linear pseudocontinuum and fits a Gaussian to the absorption line (see Silverman et al. 2012 and Silverman et al. 2015 for a detailed description of the code). Table 4 displays the inferred velocities for each spectrum. Our results are also consistent with those reported by D15. The first three spectra (, 3.25, and 6.22 d) are too noisy for reliable velocity measurements.
We note that Parrent et al. (2015) suggests the absorption feature at Å, normally identified as Si II 6355 Å, may be instead associated with H. Therefore, we compare mean SN Ic-BL photospheric velocities measured using Fe II 5169 Å (Modjaz et al., 2015) at maximum light. We find that our measurements are consistent with the measurements from the less-contaminated Fe II 5169 Å.
| Velocity | |
|---|---|
| (d) | (km s-1) |
| 9.3 | 28,100 1000 |
| 11.3 | 25,200 500 |
| 14.2 | 21,300 500 |
| 31.3 | 11,700 500 |
| 33.3 | 10,800 500 |
Note. — In observer frame. The reported uncertainties come from fitting the Si II 6355 absorption feature with a single Gaussian function and do not include errors from potential blending.
V.4. Line Identification
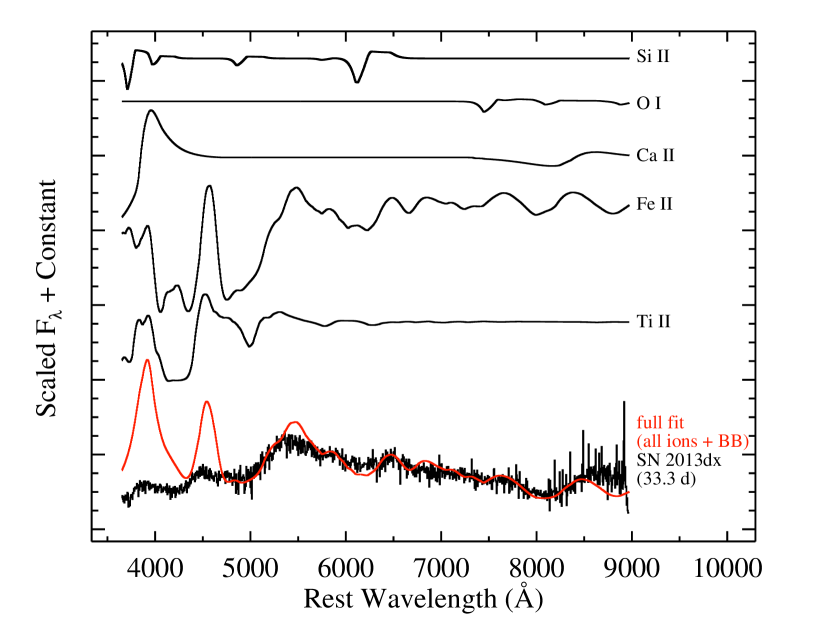
We use SYN++ (Thomas et al., 2011) to help identify the ions present in our spectra of SN 2013dx. SYN++ is derived from SYNOW (Fisher et al., 1997), which uses the Sobolev approximation (Sobolev, 1960; Castor, 1970; Jeffery, 1989) to produce synthetic spectra of SNe during the photospheric phase. SYN++ assumes that spectral lines are formed via resonance scattering above a sharp photosphere. The location of the photosphere is expressed in velocity coordinates as (in km s-1) and takes into account the homologous expansion of the ejecta.
The optical depths for each species must also be input and line strengths are computed assuming Boltzmann excitation (i.e., local thermodynamic equilibrium, LTE) using a specified excitation temperature (in K). Non-LTE effects are partially taken in account by allowing different values for each species, all of which can be different from the photospheric temperature . The latter is used only in computing the blackbody radiation emitted by the photosphere. All our SYN++ fits are computed with all ions turned on simultaneously with a blackbody.
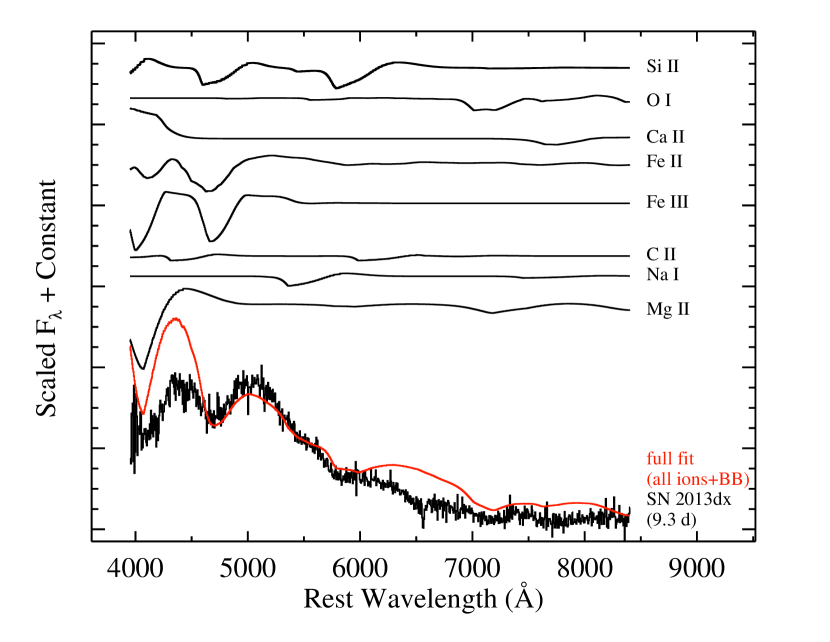
We attempt to model the major spectral features of SN 2013dx at and 33.3 d and look for evolution during the photospheric phase (see Figure 9). At 9.3 d after the burst, SYN++ indicates a photospheric velocity of 30,000 km s-1, an outer velocity of the line-forming region of about 90,000 km s-1, and an estimated photospheric temperature of 16,000 K. The spectrum contains absorption from O I, Si II, and Fe II, and possible absorption signatures of Fe III, Mg II, C II, Ca II, and Na I. We caution that because of the relatively uncertain line identifications, the derived velocities are robust indicators only for the lines of Fe II and Si II.
By 33.3 d after the burst, according to our second SYN++ fit, the SN ejecta have slowed down and cooled off significantly. This model indicates approximate values for the photospheric velocity, outer velocity, and photospheric temperature of 11,000 km s-1, 60,000 km s-1, and 9000 K, respectively. The majority of the absorption in this spectrum is likely produced by Fe II and Ti II, though there is some evidence of Si II, Ca II, and possibly O I as well. While the fit to this spectrum at wavelengths below Å is not perfect, the broad peaks and troughs roughly match. This part of the spectrum is notoriously difficult to model owing to hundreds of overlapping spectral features, mostly from iron-group elements.
VI. Supernova Explosion Parameters
VI.1. Derived Parameters
We model the basic explosion parameters of SN 2013dx by fitting its bolometric light curve with the Type I SN analytical model of Arnett (1982) and Valenti et al. (2008). This model assumes (1) homologous expansion of the ejecta, (2) spherical symmetry, (3) all 56Ni is located at the center of explosion and no mixing, (4) radiation-pressure dominated ejecta, (5) the initial radius before explosion is small, (6) the diffusion approximation is appropriate for photons (i.e., the ejecta are in the photospheric phase), and (7) a single opacity over the duration of the explosion.
The peak luminosity correlates with the mass of 56Ni (), while the light-curve shape is determined by the total ejecta mass () and the ejecta kinetic energy (). We can break the degeneracy between and with photospheric-velocity measurements from our optical spectra.
The timescale of the light curve is given by
| (3) |
where 13.8 is an integration constant. For a uniform density (Arnett, 1982)666Note there is a typo incorrectly stating in the original text that was corrected by Arnett (1996). This has been taken into account in Equations 3 and 4. This typo has been propagated throughout the literature.,
| (4) |
We assume cm2 g-1 to directly compare with the literature for other GRB-SNe (e.g., Cano et al. 2011).
We fit our quasi-bolometric light curve (§ IV.3) with the Arnett-Valenti relation,
| (5) |
with
| (6) |
The decay times of 56Ni and 56Co are d and d, and the energies produced in one second by one gram of 56Ni and 56Co were taken as erg s-1 g-1 and erg s-1 g-1 (Sutherland & Wheeler, 1984; Cappellaro et al., 1997).
From our spectra and light curves, the SN component was dominant starting at d (compare with SN 2010bh, where shock breakout was prominent out to 7 d; Cano et al. 2011). The Arnett-Valenti relation assumes that the material is in the photospheric phase, which is no longer valid at d. Therefore, our fit only includes d. We find M⊙ and d (statistical errors only). Using from our spectral fit near peak (§ V.3), we calculate M⊙ and erg.
| GRB-SN | Reference | ||||||
|---|---|---|---|---|---|---|---|
| (erg) | (km s-1) | (M⊙) | (M⊙) | ( erg) | |||
| GRB 980425/SN 1998bw | 0.0085 | 18,000 | a | (1), (2) | |||
| GRB 030329/SN 2003dh | 0.1685 | 20,000 | a | (1), (2) | |||
| GRB 031203/SN 2003lw | 0.105 | 18,000 | a | (1), (2) | |||
| GRB 060218/SN 2006aj | 0.0335 | 20,000 | a | (1), (2) | |||
| GRB 091127/SN 2009nz | 0.49 | 17,000 | a | (1), (3) | |||
| GRB 100316D/SN 2010bhb | 0.059 | 25,000 | a | (1), (4) | |||
| GRB 120422A/SN 2012bzb | 0.283 | 20,500 | a | (1), (5) | |||
| GRB 130427A/SN 2013cq | 0.3399 | 32,000 | (6) | ||||
| GRB 130702A/SN 2013dx | 0.145 | 21,300 | (7) | ||||
| GRB 140606B/iPTF14bfu | 0.384 | 19,820 | a | (8) |
Note. — a originally calculated as , scaled by a factor of 3/5 to directly compare with our values. All values calculated over 1 keV – 10 MeV, except those indicated by superscript “b” which are calculated over 15–150 keV or superscript “c” which are calculated over 20–1400 keV. (1) Cano (2013), (2) Kaneko et al. (2007), (3) Troja et al. (2012), (4) Starling et al. (2011), (5) Zhang et al. (2012), (6) Xu et al. (2013), (7) this work, (8) Cano et al. (2015).
VI.2. Comparison with Other GRB-SNe
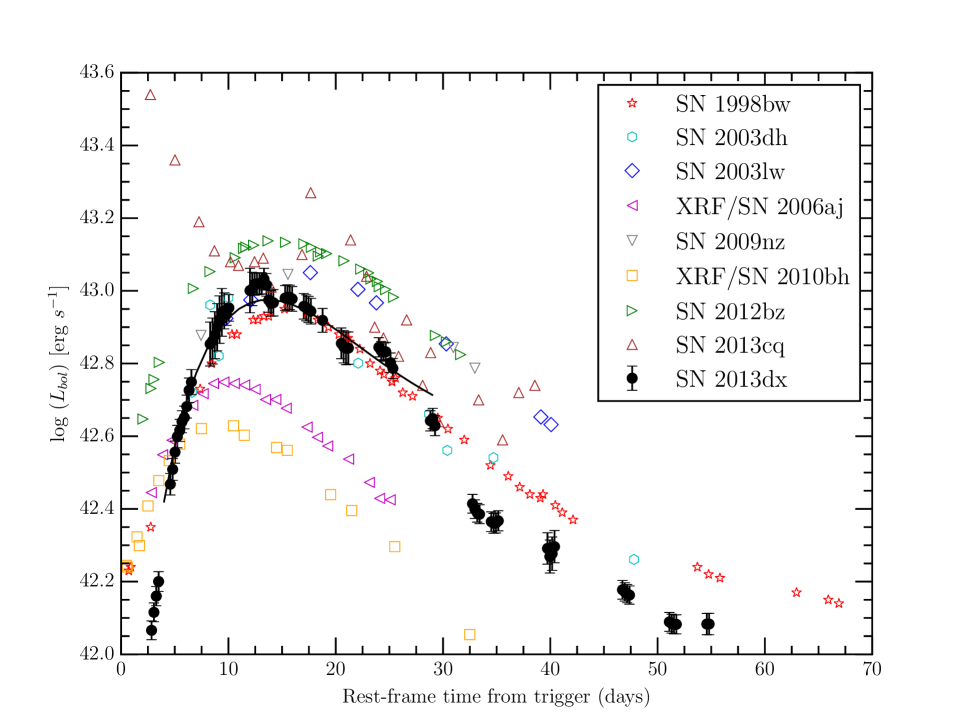
We compare our bolometric light curve of SN 2013dx with that of other spectroscopically confirmed GRB-SNe in Figure 7 (SN 1998bw, Galama et al. 1998; SN 2003lw, Mazzali et al. 2006; SN 2003dh, Deng et al. 2005; SN 2006aj, Pian et al. 2006; SN 2009nz, Olivares E. et al. 2015, SN 2010bh, Olivares E. et al. 2012; SN 2012bz: Melandri et al. 2012 and Schulze et al. 2014; SN 2013cq: Melandri et al. 2014; iPTF14bfu: Cano et al. 2015). We note that the NIR contribution to the bolometric luminosity for SN 2012bz is assumed to be the same as that observed for SN 2010bh. Although these GRB-SN bolometric light curves cover different wavelength ranges, we can get a sense of the light-curve evolution. SN 2013dx most closely matches the light-curve shape of SN 2012bz, but with the caveat that SN 2013dx has a steeper rise than SN 2012bz.
After 30 days, SN 2013dx appears to drop in luminosity rapidly. This is unlike the three bursts with late-time coverage – SN 2003lw, SN 2003dh, and SN 1998bw – seen particularly well juxtaposed against SN 1998bw, which has extensive observations out to hundreds of days. This drop in luminosity is not from underestimating the NIR contribution at late times; we still observe a rapid drop in luminosity at 30 d if we continue the monotonically increasing NIR ratio function from § IV.3 instead of adding a flat NIR contribution of 23% after 29 d.
In order to compare the derived properties of SN 2013dx with a broader sample of GRB-associated SNe, we use the derived values for , , and for all well-sampled events from Cano (2013). The authors fit a template of SN 1998bw to determine the appropriate stretch and scale parameters (e.g., § IV.2). Using average and values for each burst, the authors then fit a scaled version of the SN 1998bw light curve to the Arnett-Valenti model to derive the explosion parameters. This method has the benefit of (effectively) uniform wavelength coverage, even for events that were only observed in a few filters. However, the primary drawback is the assumption that all bolometric light curves are well fit by an appropriately scaled version of SN 1998bw. As evidenced by Figure 6, this assumption breaks down at the very least for the redder filters for SN 2013dx (see also Lyman et al. 2014a). Nonetheless, the explosion parameters for all well-studied GRB-associated SNe derived in this manner777We note that Cano (2013) and Cano et al. (2015) assume that , so we scaled their reported values by a factor of 3/5. are presented in Table 5.
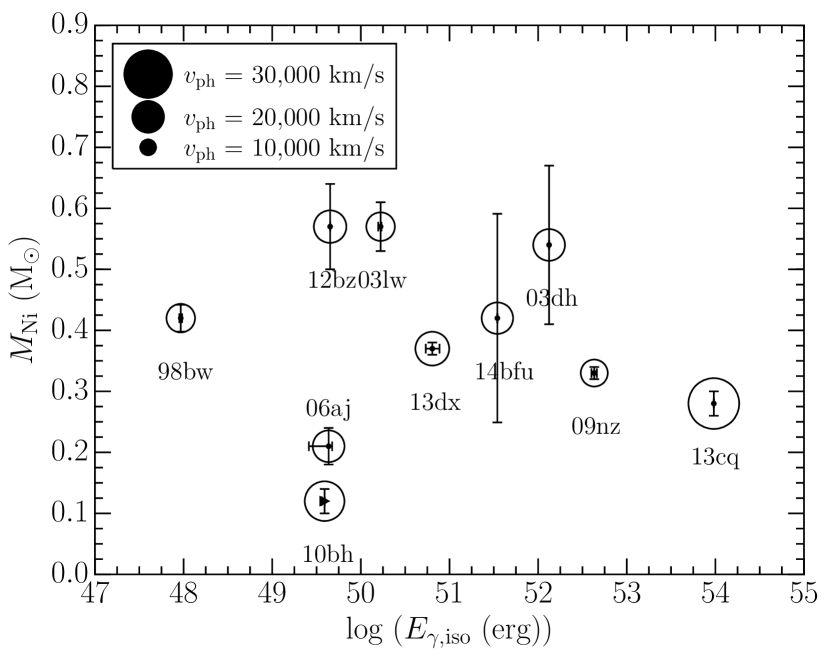
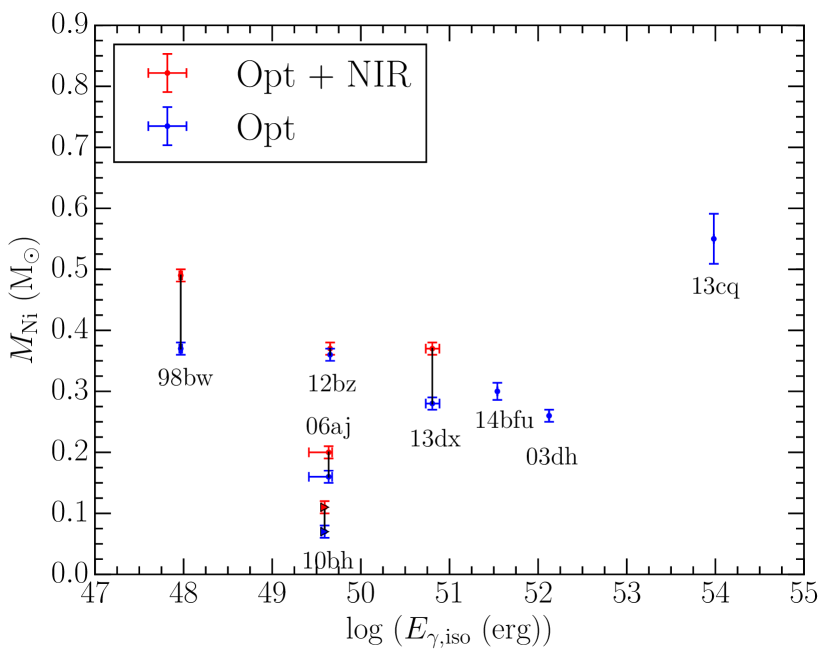
To avoid any biases introduced by GRB-SNe that are not well matched with SN 1998bw, we also create our own quasi-bolometric light curves by compiling photometry from the literature (Table 6). We fit these light curves with the Arnett-Valenti relation described in § VI.1 and break our results into those events with only optical datasets and those with optical and NIR photometry in Figure 10 (right panel). This provides an estimate of the fundamental explosion parameters that is independent of any assumed similarity with SN 1998bw.
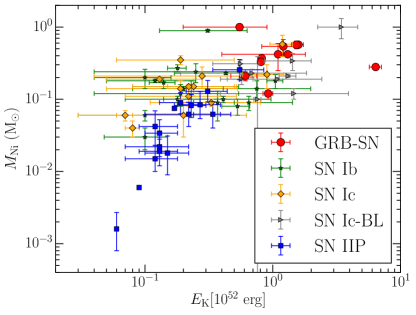
We plot the inferred as a function of both the isotropic prompt gamma-ray energy release (Figure 10) and the derived SN kinetic energy (; in Figure 11).
| GRB-SN | Filter Coverage | References |
|---|---|---|
| GRB 980425/SN 1998bw | Clocchiatti et al. (2011) | |
| GRB 030329/SN 2003dh | Deng et al. (2005) | |
| GRB 031203/SN 2003lwa | — | |
| GRB 060218/SN 2006aj | Ferrero et al. (2006); Kocevski et al. (2007) | |
| GRB 091127/SN 2009nza | — | |
| GRB 100316D/SN 2010bhb | Olivares E. et al. (2012) | |
| GRB 120422A/SN 2012bz | Schulze et al. (2014) | |
| GRB 130427A/SN 2013cqc | Melandri et al. (2014) | |
| GRB 130702A/SN 2013dx | This work | |
| GRB 140606B/iPTF14bfu | Cano et al. (2015) |
VI.3. Caveats and Conclusions
From Figure 10, it is clear that there is no correlation between and the prompt energy release using either method for calculating SN explosion parameters of other GRB-SNe. For example, SN 2013dx has a comparable mass of synthesized 56Ni as the subluminous GRB 980425 / SN 1998bw and the extremely luminous GRB 130427A / SN 2013cq (Levan et al., 2014; Melandri et al., 2014). Even if we were to apply a beaming correction, GRB 130427A would still have several orders of magnitude larger than GRB 980425 (Perley et al., 2014), but comparable . Similarly, there is no clear correlation between and photospheric velocity at peak. Numerical simulations unambiguously predict that the mass of synthesized 56Ni should be correlated with the degree of asymmetry in the explosion (González-Casanova et al., 2014; Umeda & Nomoto, 2008); to the extent that our models faithfully reproduce the relevant (global) SN explosion parameters, this result is clearly not borne out by the data.
On the other hand, the explosion energy of the SN ejecta is clearly correlated with , particularly when including other core-collapse events. As shown by previous authors (e.g., Cano 2013 and Lyman et al. 2014a for recent compilations), GRB-associated SNe on average have a higher mass of synthesized 56Ni and larger kinetic energies than any other class of core-collapse SNe (except perhaps the superluminous SNe; Gal-Yam 2012). That said, the SN explosion energies are typically narrowly clustered and do not appear to significantly exceed erg, consistent with (perhaps even indicative of) a magnetar origin for these events (Mazzali et al., 2014). SN 2013cq (associated with GRB 130427A) appears to be a significant outlier in terms of its inferred , however, which remains to be fully explained.
D15 created a bolometric light curve over the range 3000–10,000 Å extrapolated from and . We examined the bolometric light curve from D15 and found that our peak luminosity is consistent with theirs when accounting for our additional NIR coverage. D15 report , a factor of two lower than our quoted value. On the other hand, they derive a total ejecta mass ( M⊙) and a SN kinetic energy ( erg) approximately a factor of two and four (respectively) larger than those presented here. D15 scale numerical simulations of the similarly shaped SN 2003dh (Mazzali et al., 2006) to estimate SN explosion parameters, as opposed to using an analytical model (e.g., Arnett-Valenti) as adopted in this paper.
Since is closely related to the peak luminosity, we believe that our reported estimate is more accurate than the value D15 report. When NIR contributions are included, SN 2013dx has a similar peak luminosity as SN 1998bw. We therefore expect SN 2013dx to have a similar 56Ni mass as SN 1998bw. Both numerical simulations and analytical models produce for SN 1998bw (Mazzali et al., 2006; Cano, 2013).
The discrepancy in ejecta mass and kinetic energy is caused mainly by different opacity assumptions. Mazzali et al. (2006) assumed an opacity, cm2 g-1, where is the number of electrons per baryon. We assume the authors used for iron and recalculate our Arnett-Valenti fit. With an opacity of cm2 g-1, we report M⊙ and erg. We also note that from our fit of SN 1998bw in §IV.2, we can see that the light-curve evolution of SN 1998bw does not match that of SN 2013dx well (see Figure 6); hence, the different values of and are not unexpected.
We note that opacity greatly affects and , but does not affect . Wheeler et al. (2015) found that a conflict exists when comparing properties determined by fitting the peak (using Arnett-Valenti methods) to those determined from fitting the late-time tail (using methods from Clocchiatti & Wheeler 1997). This conflict is partially resolved by using a mean opacity determined from both peak and late-time tail parameters. Wheeler et al. (2015) find that in general, the opacity is often overestimated in the literature and the typical mean opacity is . In view of this potential discrepancy, we report values for (, erg) and (, erg) to draw attention to the spread in and from this variable.
We also caution that numerical simulations of jet-driven SNe (e.g., González-Casanova et al. 2014; Mazzali et al. 2013; Umeda & Nomoto 2008) imply that the distribution of 56Ni is likely to be highly asymmetric. The derived ejecta mass may therefore be biased by line-of-sight effects, and not representative of the total mass ejected in the explosion.
VII. Discussion and Summary
We present extensive optical and NIR photometry of GRB 130702A/SN 2013dx spanning 1–63 d after the gamma-ray trigger, and optical spectra covering 1–33 d after the trigger. At , GRB 130702A/SN 2013dx is sufficiently close to clearly detect and model the underlying SN component that emerged a week after the burst.
We isolate the SN component and present multi-band light curves, a quasi-bolometric () light curve, and spectra of SN 2013dx. Detection of the broad Si II absorption line at velocities approaching km s-1, combined with the absence of H and He features, indicates that SN 2013dx is a broad-lined SN Ic. We estimate the SN explosion parameters using the Arnett-Valenti analytical relation and infer M⊙, M⊙, and erg.
Our analysis allows us to compare SN 2013dx with other GRB-SNe, as well as other core-collapse SNe (those of identical spectral type and not). This is of particular interest because GRB 130702A is of intermediate , between low-luminosity and cosmological GRBs. There seems to be no clear relation between , , or with GRB isotropic energy (Figure 10), even when considering beaming corrections. The SN appears to not be imprinted with any information about the formation of the relativistic jet aside from the high photospheric velocity and lack of H and He that allows us to classify all GRB-SNe as Type Ic-BL. This is somewhat puzzling, given the predictions of a correlation between the degree of asymmetry and mass of synthesized 56Ni for jet-driven explosions. We caution that the Arnett-Valenti relations we use to derive assume spherical symmetry and this assumption may account for some but not all of the scatter in Figure 10. On the other hand, our observations do provide support for predictions that should be strongly correlated with the kinetic energy of the SN itself.
Spectroscopically, SN 2013dx resembles both other GRB-SNe like SN 2006aj and SN 1998bw, as well as non-GRB SNe Ic-BL such as SN 1997ef, SN 2007I, and SN 2010ah. In terms of light curves, SN 2013dx most closely matches the evolution of SN 2012bz, associated with an intermediate GRB, but has a similar peak luminosity as SN 1998bw, associated with a low-luminosity GRB. Direct comparison of the light-curve evolution between SN 2013dx and SN 1998bw indicates that SN 2013dx has a quicker rise time than SN 1998bw. The faster rise time may suggest that SN 2013dx has a steeper distribution of 56Ni in the outer layers of the star (i.e., less mixing) than SN 1998bw (Piro & Nakar 2013, Dessart et al. 2012).
Late-time observations several months after the burst can test asymmetry effectively both in photometry (Wheeler et al., 2015) and spectroscopy (Mazzali et al., 2005; Maeda et al., 2002; Milisavljevic et al., 2015). We do not have enough late-time observations of SN 2013dx to conduct these effective asymmetry tests, but we strongly encourage late-time follow-up data for GRB-SNe when possible.
Finally, we suggest two potential avenues for future study, especially with respect to GRB 130702A / SN 2013dx. Detailed numerical modeling of the SN ejecta (e.g., Mazzali et al. 2006 for SN 1998bw), specifically tailored to the light curves and spectra of SN 2013dx (instead of simply scaling results from previous simulations), should help to improve the accuracy of estimates of the fundamental SN explosions parameters. In addition, a broadband study of the afterglow emission, in particular incorporating radio wavelengths, would enable a much-improved estimate of the properties of the fastest-moving ejecta. This would greatly assist in placing GRB 130702A in the context of other relativistic explosions, specifically how the explosion energy is partitioned with respect to ejecta velocity (e.g., Margutti et al. 2014).
Acknowledgements
We gratefully acknowledge S. Schulze, F. Olivares E., A. Melandri, M. Modjaz, Y. Liu, and E. Pian for generously sharing their raw data, which significantly improved the analysis for this paper. We also thank J. Lyman, M. Modjaz, R. Thomas, and the anonymous referee for useful feedback on the manuscript.
This work was supported by the National Aeronautics and Space Administration (NASA) Headquarters under the NASA Earth and Space Science Fellowship Program (Grant NNX12AL70H to V.T.). V.T. and S.V. were partially supported by NSF/ATI grant 1207785. The research of A.V.F.’s group at UC Berkeley has been funded by NSF grant AST-1211916, Gary and Cynthia Bengier, the Richard and Rhoda Goldman Fund, the TABASGO Foundation, and the Christopher R. Redlich Fund. J.M.S. is supported by an NSF Astronomy and Astrophysics Postdoctoral Fellowship under award AST-1302771. A.G.Y. is supported by the EU/FP7 via ERC grant no. 307260, the Quantum Universe I-Core program by the Israeli Committee for planning and budgeting and the ISF; by Minerva and ISF grants; by the Weizmann-UK “making connections” program; and by Kimmel and ARCHES awards. A.C. acknowledges support from the NASA-Swift GI program via grants 13-SWIFT13-0030 and 14-SWIFT14-0024. E.T. acknowledges support for this project under the Fermi Guest Investigator Program. The work of D.S. was carried out at the Jet Propulsion Laboratory, California Institute of Technology, under a contract with NASA. We also acknowledge the help of K. Markey, E. Alduena, A. Alduena, and S. Kuo from Walden School for their help with the Palomar observations on 2013 July 8.
We thank the RATIR project team and the staff of the Observatorio Astronómico Nacional on Sierra San Pedro Mártir. RATIR is a collaboration between the University of California, the Universidad Nacional Autonóma de México, NASA Goddard Space Flight Center, and Arizona State University, benefiting from the loan of an H2RG detector and hardware and software support from Teledyne Scientific and Imaging. RATIR, the automation of the Harold L. Johnson Telescope of the Observatorio Astronómico Nacional on Sierra San Pedro Mártir, and the operation of both are funded through NASA grants NNX09AH71G, NNX09AT02G, NNX10AI27G, and NNX12AE66G, CONACyT grants INFR-2009-01-122785 and CB-2008-101958 , UNAM PAPIIT grant IG100414, and UC MEXUS-CONACyT grant CN 09-283.
These results made use of Lowell Observatory’s Discovery Channel Telescope. Lowell operates the DCT in partnership with Boston University, Northern Arizona University, the University of Maryland, and the University of Toledo. Partial support of the DCT was provided by Discovery Communications. LMI was built by Lowell Observatory using funds from the NSF (AST-1005313). The Liverpool Telescope is operated on the island of La Palma by Liverpool John Moores University in the Spanish Observatorio del Roque de los Muchachos of the Instituto de Astrofisica de Canarias with financial support from the UK Science and Technology Facilities Council. Some of the data presented herein were obtained at the W. M. Keck Observatory, which is operated as a scientific partnership among the California Institute of Technology, the University of California, and NASA; the observatory was made possible by the generous financial support of the W. M. Keck Foundation.
This research has made use of the VizieR catalogue access tool, CDS, Strasbourg, France. This publication also uses data products from the Two Micron All Sky Survey, which is a joint project of the University of Massachusetts and the Infrared Processing and Analysis Center/California Institute of Technology, funded by NASA and the NSF. Funding for SDSS-III has been provided by the Alfred P. Sloan Foundation, the Participating Institutions, the NSF, and the U.S. Department of Energy Office of Science. The SDSS-III website is http://www.sdss3.org/. SDSS-III is managed by the Astrophysical Research Consortium for the Participating Institutions of the SDSS-III Collaboration including the University of Arizona, the Brazilian Participation Group, Brookhaven National Laboratory, Carnegie Mellon University, University of Florida, the French Participation Group, the German Participation Group, Harvard University, the Instituto de Astrofisica de Canarias, the Michigan State/Notre Dame/JINA Participation Group, Johns Hopkins University, Lawrence Berkeley National Laboratory, Max Planck Institute for Astrophysics, Max Planck Institute for Extraterrestrial Physics, New Mexico State University, New York University, Ohio State University, Pennsylvania State University, University of Portsmouth, Princeton University, the Spanish Participation Group, University of Tokyo, University of Utah, Vanderbilt University, University of Virginia, University of Washington, and Yale University.
References
- Aihara et al. (2011) Aihara, H., Allende Prieto, C., An, D., et al. 2011, ApJS, 193, 29
- Arnett (1996) Arnett, D. 1996, Supernovae and Nucleosynthesis: An Investigation of the History of Matter from the Big Bang to the Present (Princeton: Princeton University Press.)
- Arnett (1982) Arnett, W. D. 1982, ApJ, 253, 785
- Atwood et al. (2009) Atwood, W. B., Abdo, A. A., Ackermann, M., et al. 2009, ApJ, 697, 1071
- Bennett et al. (2014) Bennett, C. L., Larson, D., Weiland, J. L., & Hinshaw, G. 2014, ApJ, 794, 135
- Berger et al. (2003) Berger, E., Kulkarni, S. R., Frail, D. A., & Soderberg, A. M. 2003, ApJ, 599, 408
- Berger et al. (2011) Berger, E., Chornock, R., Holmes, T. R., et al. 2011, ApJ, 743, 204
- Bertin (2006) Bertin, E. 2006, in Astronomical Society of the Pacific Conference Series, Vol. 351, Astronomical Data Analysis Software and Systems XV, ed. C. Gabriel, C. Arviset, D. Ponz, & S. Enrique, 112
- Bertin & Arnouts (1996) Bertin, E., & Arnouts, S. 1996, A&AS, 117, 393
- Bertin et al. (2002) Bertin, E., Mellier, Y., Radovich, M., et al. 2002, in Astronomical Society of the Pacific Conference Series, Vol. 281, Astronomical Data Analysis Software and Systems XI, ed. D. A. Bohlender, D. Durand, & T. H. Handley, 228
- Bietenholz et al. (2014) Bietenholz, M. F., De Colle, F., Granot, J., Bartel, N., & Soderberg, A. M. 2014, MNRAS, 440, 821
- Blanton & Roweis (2007) Blanton, M. R., & Roweis, S. 2007, AJ, 133, 734
- Blondin et al. (2007) Blondin, S., Modjaz, M., Kirshner, R., Challis, P., & Calkins, M. 2007, Central Bureau Electronic Telegrams, 808, 1
- Blondin & Tonry (2007) Blondin, S., & Tonry, J. L. 2007, ApJ, 666, 1024
- Bromberg et al. (2011) Bromberg, O., Nakar, E., & Piran, T. 2011, ApJ, 739, L55
- Bufano et al. (2012) Bufano, F., Pian, E., Sollerman, J., et al. 2012, ApJ, 753, 67
- Burrows et al. (2005) Burrows, D. N., Hill, J. E., Nousek, J. A., et al. 2005, Space Sci. Rev., 120, 165
- Butler et al. (2012) Butler, N., Klein, C., Fox, O., et al. 2012, in Society of Photo-Optical Instrumentation Engineers (SPIE) Conference Series, Vol. 8446, 10
- Butler et al. (2013) Butler, N., Watson, A. M., Kutyrev, A., et al. 2013, GRB Coordinates Network, 14993, 1
- Campana et al. (2006) Campana, S., Mangano, V., Blustin, A. J., et al. 2006, Nature, 442, 1008
- Cano (2013) Cano, Z. 2013, MNRAS, 434, 1098
- Cano (2014) —. 2014, ApJ, 794, 121
- Cano et al. (2011) Cano, Z., Bersier, D., Guidorzi, C., et al. 2011, ApJ, 740, 41
- Cano et al. (2015) Cano, Z., de Ugarte Postigo, A., Perley, D., et al. 2015, arXiv e-prints (astro-ph/1505.03522), arXiv:1505.03522
- Cappellaro et al. (1997) Cappellaro, E., Mazzali, P. A., Benetti, S., et al. 1997, A&A, 328, 203
- Cardelli et al. (1989) Cardelli, J. A., Clayton, G. C., & Mathis, J. S. 1989, ApJ, 345, 245
- Castor (1970) Castor, J. I. 1970, MNRAS, 149, 111
- Cenko et al. (2013) Cenko, S. B., Gal-Yam, A., Kasliwal, M. M., et al. 2013, GRB Coordinates Network, 14998, 1
- Cenko et al. (2006) Cenko, S. B., Fox, D. B., Moon, D.-S., et al. 2006, PASP, 118, 1396
- Cenko et al. (2008) Cenko, S. B., Fox, D. B., Penprase, B. E., et al. 2008, ApJ, 677, 441
- Cheung et al. (2013) Cheung, T., Vianello, G., Zhu, S., et al. 2013, GRB Coordinates Network, 14971, 1
- Chornock et al. (2010) Chornock, R., Berger, E., Levesque, E. M., et al. 2010, ArXiv e-prints, arXiv:1004.2262
- Clocchiatti et al. (2011) Clocchiatti, A., Suntzeff, N. B., Covarrubias, R., & Candia, P. 2011, AJ, 141, 163
- Clocchiatti & Wheeler (1997) Clocchiatti, A., & Wheeler, J. C. 1997, ApJ, 491, 375
- Cobb et al. (2010) Cobb, B. E., Bloom, J. S., Perley, D. A., et al. 2010, ApJ, 718, L150
- Collazzi & Connaughton (2013) Collazzi, A. C., & Connaughton, V. 2013, GRB Coordinates Network, 14972, 1
- Corsi et al. (2011) Corsi, A., Ofek, E. O., Frail, D. A., et al. 2011, ApJ, 741, 76
- Covino et al. (2013) Covino, S., Melandri, A., Salvaterra, R., et al. 2013, MNRAS, 432, 1231
- D’Avanzo et al. (2013) D’Avanzo, P., D’Elia, V., Tagliaferri, G., et al. 2013, GRB Coordinates Network, 14984, 1
- D’Elia et al. (2013) D’Elia, V., D’Avanzo, P., Melandri, A., et al. 2013, GRB Coordinates Network, 15000, 1
- D’Elia et al. (2015) D’Elia, V., Pian, E., Melandri, A., et al. 2015, A&A, 577, A116
- Della Valle et al. (2006) Della Valle, M., Chincarini, G., Panagia, N., et al. 2006, Nature, 444, 1050
- Deng et al. (2005) Deng, J., Tominaga, N., Mazzali, P. A., Maeda, K., & Nomoto, K. 2005, ApJ, 624, 898
- Dessart et al. (2012) Dessart, L., Hillier, D. J., Li, C., & Woosley, S. 2012, MNRAS, 424, 2139
- Drout et al. (2011) Drout, M. R., Soderberg, A. M., Gal-Yam, A., et al. 2011, ApJ, 741, 97
- Evans et al. (2009) Evans, P. A., Beardmore, A. P., Page, K. L., et al. 2009, MNRAS, 397, 1177
- Faber et al. (2003) Faber, S. M., Phillips, A. C., Kibrick, R. I., et al. 2003, in Society of Photo-Optical Instrumentation Engineers (SPIE) Conference Series, Vol. 4841, Instrument Design and Performance for Optical/Infrared Ground-based Telescopes, ed. M. Iye & A. F. M. Moorwood, 1657–1669
- Ferrero et al. (2006) Ferrero, P., Kann, D. A., Zeh, A., et al. 2006, A&A, 457, 857
- Filippenko (1982) Filippenko, A. V. 1982, PASP, 94, 715
- Filippenko (1997) —. 1997, ARA&A, 35, 309
- Fisher et al. (1997) Fisher, A., Branch, D., Nugent, P., & Baron, E. 1997, ApJ, 481, L89
- Fox et al. (2012) Fox, O. D., Kutyrev, A. S., Rapchun, D. A., et al. 2012, in Society of Photo-Optical Instrumentation Engineers (SPIE) Conference Series, Vol. 8453, 1
- Fynbo et al. (2006) Fynbo, J. P. U., Watson, D., Thöne, C. C., et al. 2006, Nature, 444, 1047
- Gal-Yam (2012) Gal-Yam, A. 2012, Science, 337, 927
- Gal-Yam et al. (2004) Gal-Yam, A., Moon, D.-S., Fox, D. B., et al. 2004, ApJ, 609, L59
- Gal-Yam et al. (2006) Gal-Yam, A., Fox, D. B., Price, P. A., et al. 2006, Nature, 444, 1053
- Galama et al. (1998) Galama, T. J., Vreeswijk, P. M., van Paradijs, J., et al. 1998, Nature, 395, 670
- Gehrels et al. (2004) Gehrels, N., Chincarini, G., Giommi, P., et al. 2004, ApJ, 611, 1005
- Golenetskii et al. (2013) Golenetskii, S., Aptekar, R., Pal’Shin, V., et al. 2013, GRB Coordinates Network, 14986, 1
- González-Casanova et al. (2014) González-Casanova, D. F., De Colle, F., Ramirez-Ruiz, E., & Lopez, L. A. 2014, ApJ, 781, L26
- Graham & Fruchter (2013) Graham, J. F., & Fruchter, A. S. 2013, ApJ, 774, 119
- Greiner et al. (2015) Greiner, J., Mazzali, P. A., Kann, D. A., et al. 2015, Nature, 523, 189
- Hamuy (2003) Hamuy, M. 2003, ApJ, 582, 905
- Hjorth & Bloom (2012) Hjorth, J., & Bloom, J. S. 2012, The Gamma-Ray Burst - Supernova Connection (Cambridge University Press: Cambridge), 169–190
- Hogg et al. (2002) Hogg, D. W., Baldry, I. K., Blanton, M. R., & Eisenstein, D. J. 2002, arXiV e-prints (astro-ph/0210394), astro-ph/0210394
- Horne (1986) Horne, K. 1986, PASP, 98, 609
- Iwamoto et al. (1998) Iwamoto, K., Mazzali, P. A., Nomoto, K., et al. 1998, Nature, 395, 672
- Iwamoto et al. (2000) Iwamoto, K., Nakamura, T., Nomoto, K., et al. 2000, ApJ, 534, 660
- Jeffery (1989) Jeffery, D. J. 1989, ApJS, 71, 951
- Kalberla et al. (2005) Kalberla, P. M. W., Burton, W. B., Hartmann, D., et al. 2005, A&A, 440, 775
- Kaneko et al. (2007) Kaneko, Y., Ramirez-Ruiz, E., Granot, J., et al. 2007, ApJ, 654, 385
- Kelly et al. (2013) Kelly, P. L., Filippenko, A. V., Fox, O. D., Zheng, W., & Clubb, K. I. 2013, ApJ, 775, L5
- Kelson (2003) Kelson, D. D. 2003, PASP, 115, 688
- Kinney et al. (1996) Kinney, A. L., Calzetti, D., Bohlin, R. C., et al. 1996, ApJ, 467, 38
- Kocevski et al. (2007) Kocevski, D., Modjaz, M., Bloom, J. S., et al. 2007, ApJ, 663, 1180
- Kulkarni et al. (1998) Kulkarni, S. R., Frail, D. A., Wieringa, M. H., et al. 1998, Nature, 395, 663
- Lang et al. (2010) Lang, D., Hogg, D. W., Mierle, K., Blanton, M., & Roweis, S. 2010, AJ, 139, 1782
- Law et al. (2009) Law, N. M., Kulkarni, S. R., Dekany, R. G., et al. 2009, PASP, 121, 1395
- Levan et al. (2014) Levan, A. J., Tanvir, N. R., Fruchter, A. S., et al. 2014, ApJ, 792, 115
- Lyman et al. (2014a) Lyman, J., Bersier, D., James, P., et al. 2014a, ArXiv e-prints, arXiv:1406.3667
- Lyman et al. (2014b) Lyman, J. D., Bersier, D., & James, P. A. 2014b, MNRAS, 437, 3848
- Maeda et al. (2002) Maeda, K., Nakamura, T., Nomoto, K., et al. 2002, ApJ, 565, 405
- Malesani et al. (2004) Malesani, D., Tagliaferri, G., Chincarini, G., et al. 2004, ApJ, 609, L5
- Margutti et al. (2014) Margutti, R., Milisavljevic, D., Soderberg, A. M., et al. 2014, ApJ, 797, 107
- Matheson et al. (2000) Matheson, T., Filippenko, A. V., Ho, L. C., Barth, A. J., & Leonard, D. C. 2000, AJ, 120, 1499
- Matheson et al. (2003) Matheson, T., Garnavich, P. M., Stanek, K. Z., et al. 2003, ApJ, 599, 394
- Mazzali et al. (2014) Mazzali, P. A., McFadyen, A. I., Woosley, S. E., Pian, E., & Tanaka, M. 2014, MNRAS, 443, 67
- Mazzali et al. (2013) Mazzali, P. A., Walker, E. S., Pian, E., et al. 2013, MNRAS, 432, 2463
- Mazzali et al. (2005) Mazzali, P. A., Kawabata, K. S., Maeda, K., et al. 2005, Science, 308, 1284
- Mazzali et al. (2006) Mazzali, P. A., Deng, J., Pian, E., et al. 2006, ApJ, 645, 1323
- McLean et al. (2012) McLean, I. S., Steidel, C. C., Epps, H. W., et al. 2012, in Society of Photo-Optical Instrumentation Engineers (SPIE) Conference Series, Vol. 8446, 0
- Meegan et al. (2009) Meegan, C., Lichti, G., Bhat, P. N., et al. 2009, ApJ, 702, 791
- Melandri et al. (2012) Melandri, A., Pian, E., Ferrero, P., et al. 2012, A&A, 547, A82
- Melandri et al. (2014) Melandri, A., Pian, E., D’Elia, V., et al. 2014, A&A, 567, A29
- Milisavljevic et al. (2015) Milisavljevic, D., Margutti, R., Parrent, J. T., et al. 2015, ApJ, 799, 51
- Mirabal et al. (2006) Mirabal, N., Halpern, J. P., An, D., Thorstensen, J. R., & Terndrup, D. M. 2006, ApJ, 643, L99
- Modjaz et al. (2015) Modjaz, M., Liu, Y. Q., Bianco, F. B., & Graur, O. 2015, ArXiv e-prints, arXiv:1509.07124
- Modjaz et al. (2006) Modjaz, M., Stanek, K. Z., Garnavich, P. M., et al. 2006, ApJ, 645, L21
- Modjaz et al. (2008) Modjaz, M., Kewley, L., Kirshner, R. P., et al. 2008, AJ, 135, 1136
- Modjaz et al. (2009) Modjaz, M., Li, W., Butler, N., et al. 2009, ApJ, 702, 226
- Modjaz et al. (2014) Modjaz, M., Blondin, S., Kirshner, R. P., et al. 2014, AJ, 147, 99
- Mulchaey et al. (2013a) Mulchaey, J., Kasliwal, M. M., Arcavi, I., Bellm, E., & Kelson, D. 2013a, GRB Coordinates Network, 14985, 1
- Mulchaey et al. (2013b) —. 2013b, The Astronomer’s Telegram, 5191, 1
- Nakar (2015) Nakar, E. 2015, arXiv e-prints (astro-ph/1503.00441), arXiv:1503.00441
- Oke & Gunn (1982) Oke, J. B., & Gunn, J. E. 1982, PASP, 94, 586
- Oke & Gunn (1983) —. 1983, ApJ, 266, 713
- Oke et al. (1995) Oke, J. B., Cohen, J. G., Carr, M., et al. 1995, PASP, 107, 375
- Olivares E. et al. (2012) Olivares E., F., Greiner, J., Schady, P., et al. 2012, A&A, 539, A76
- Olivares E. et al. (2015) —. 2015, A&A, 577, A44
- Parrent et al. (2015) Parrent, J. T., Milisavljevic, D., Soderberg, A. M., & Parthasarathy, M. 2015, ArXiv e-prints, arXiv:1505.06645
- Patat et al. (2001) Patat, F., Cappellaro, E., Danziger, J., et al. 2001, ApJ, 555, 900
- Pei (1992) Pei, Y. C. 1992, ApJ, 395, 130
- Perley et al. (2014) Perley, D. A., Cenko, S. B., Corsi, A., et al. 2014, ApJ, 781, 37
- Phillips (1993) Phillips, M. M. 1993, ApJ, 413, L105
- Pian et al. (2006) Pian, E., Mazzali, P. A., Masetti, N., et al. 2006, Nature, 442, 1011
- Piro & Nakar (2013) Piro, A. L., & Nakar, E. 2013, ApJ, 769, 67
- Racusin et al. (2009) Racusin, J. L., Liang, E. W., Burrows, D. N., et al. 2009, ApJ, 698, 43
- Rau et al. (2009) Rau, A., Kulkarni, S. R., Law, N. M., et al. 2009, PASP, 121, 1334
- Sari et al. (1998) Sari, R., Piran, T., & Narayan, R. 1998, ApJ, 497, L17
- Schlafly & Finkbeiner (2011) Schlafly, E. F., & Finkbeiner, D. P. 2011, ApJ, 737, 103
- Schulze et al. (2013) Schulze, S., Leloudas, G., Xu, D., et al. 2013, GRB Coordinates Network, 14994, 1
- Schulze et al. (2014) Schulze, S., Malesani, D., Cucchiara, A., et al. 2014, A&A, 566, A102
- Silverman et al. (2012) Silverman, J. M., Kong, J. J., & Filippenko, A. V. 2012, MNRAS, 425, 1819
- Silverman et al. (2015) Silverman, J. M., Vinko, J., Marion, G. H., et al. 2015, MNRAS, 451, 1973
- Singer et al. (2013a) Singer, L. P., Cenko, S. B., Kasliwal, M. M., et al. 2013a, ApJ, 776, L34
- Singer et al. (2013b) —. 2013b, GRB Coordinates Network, 14967, 1
- Skrutskie et al. (2006) Skrutskie, M. F., Cutri, R. M., Stiening, R., et al. 2006, AJ, 131, 1163
- Sobolev (1960) Sobolev, V. V. 1960, Moving envelopes of stars (Cambridge: Harvard University Press)
- Soderberg et al. (2010) Soderberg, A. M., Chakraborti, S., Pignata, G., et al. 2010, Nature, 463, 513
- Sollerman et al. (2002) Sollerman, J., Holland, S. T., Challis, P., et al. 2002, A&A, 386, 944
- Sollerman et al. (2006) Sollerman, J., Jaunsen, A. O., Fynbo, J. P. U., et al. 2006, A&A, 454, 503
- Stanek et al. (2003) Stanek, K. Z., Matheson, T., Garnavich, P. M., et al. 2003, ApJ, 591, L17
- Starling et al. (2011) Starling, R. L. C., Wiersema, K., Levan, A. J., et al. 2011, MNRAS, 411, 2792
- Steele et al. (2004) Steele, I. A., Smith, R. J., Rees, P. C., et al. 2004, in Society of Photo-Optical Instrumentation Engineers (SPIE) Conference Series, Vol. 5489, Ground-based Telescopes, ed. J. M. Oschmann, Jr., 679–692
- Sutherland & Wheeler (1984) Sutherland, P. G., & Wheeler, J. C. 1984, ApJ, 280, 282
- Thomas et al. (2011) Thomas, R. C., Nugent, P. E., & Meza, J. C. 2011, PASP, 123, 237
- Thomsen et al. (2004) Thomsen, B., Hjorth, J., Watson, D., et al. 2004, A&A, 419, L21
- Troja et al. (2012) Troja, E., Sakamoto, T., Guidorzi, C., et al. 2012, ApJ, 761, 50
- Umeda & Nomoto (2008) Umeda, H., & Nomoto, K. 2008, ApJ, 673, 1014
- Valenti et al. (2008) Valenti, S., Benetti, S., Cappellaro, E., et al. 2008, MNRAS, 383, 1485
- Wade & Horne (1988) Wade, R. A., & Horne, K. 1988, ApJ, 324, 411
- Watson et al. (2012) Watson, A. M., Richer, M. G., Bloom, J. S., et al. 2012, in Society of Photo-Optical Instrumentation Engineers (SPIE) Conference Series, Vol. 8444, 5
- Wheeler et al. (2015) Wheeler, J. C., Johnson, V., & Clocchiatti, A. 2015, MNRAS, 450, 1295
- Woosley & Bloom (2006) Woosley, S. E., & Bloom, J. S. 2006, ARA&A, 44, 507
- Xu et al. (2013) Xu, D., de Ugarte Postigo, A., Leloudas, G., et al. 2013, ApJ, 776, 98
- Yaron & Gal-Yam (2012) Yaron, O., & Gal-Yam, A. 2012, PASP, 124, 668
- Zhang et al. (2012) Zhang, B.-B., Fan, Y.-Z., Shen, R.-F., et al. 2012, ApJ, 756, 190
| Filter | Epoch | Telescope | Exp. | AB mag |
|---|---|---|---|---|
| (days) | (s) | |||
| 330.49 | Keck/LRIS | 203 | 24.50 0.14 | |
| 1.17 | P60 | 120 | 18.80 0.04 | |
| 1.26 | P60 | 120 | 18.86 0.04 | |
| 2.21 | P60 | 270 | 19.52 0.04 | |
| 3.23 | P60 | 450 | 20.02 0.05 | |
| 4.19 | P60 | 1260 | 20.22 0.04 | |
| 5.27 | P60 | 540 | 20.35 0.04 | |
| 6.28 | P60 | 540 | 20.31 0.04 | |
| 7.20 | P60 | 720 | 20.32 0.04 | |
| 9.87 | Liverpool | 130 | 20.35 0.33 | |
| 10.87 | Liverpool | 130 | 20.39 0.35 | |
| 11.26 | P60 | 720 | 20.22 0.05 | |
| 11.87 | Liverpool | 130 | 20.06 0.21 | |
| 12.18 | P60 | 660 | 20.23 0.03 | |
| 12.86 | Liverpool | 130 | 20.00 0.23 | |
| 13.86 | Liverpool | 130 | 20.39 0.34 | |
| 14.18 | P60 | 720 | 20.31 0.06 | |
| 15.18 | P60 | 720 | 20.43 0.07 | |
| 16.18 | P60 | 720 | 20.36 0.13 | |
| 17.87 | Liverpool | 150 | 20.32 0.13 | |
| 19.87 | Liverpool | 150 | 20.78 0.19 | |
| 21.87 | Liverpool | 150 | 20.98 0.15 | |
| 23.87 | Liverpool | 150 | 21.25 0.30 | |
| 27.92 | Liverpool | 150 | 21.53 0.07 | |
| 29.21 | P60 | 540 | 21.62 0.12 | |
| 30.19 | P60 | 1080 | 21.72 0.09 | |
| 34.17 | P60 | 1080 | 21.84 0.08 | |
| 37.89 | Liverpool | 450 | 22.06 0.08 | |
| 39.88 | Liverpool | 450 | 22.11 0.09 | |
| 45.88 | Liverpool | 450 | 22.64 0.34 | |
| 53.88 | Liverpool | 150 | 22.42 0.07 | |
| 58.88 | Liverpool | 150 | 22.56 0.06 | |
| 62.87 | Liverpool | 150 | 22.60 0.09 | |
| 330.48 | Keck/LRIS | 203 | 23.51 0.03 | |
| 632.37 | DCT | 1200 | 23.66 0.04 | |
| 0.18 | P48 | 60 | 17.38 0.04 | |
| 0.21 | P48 | 60 | 17.52 0.04 | |
| 1.26 | P60 | 360 | 18.66 0.05 | |
| 2.16 | RATIR | 7600 | 19.23 0.06 | |
| 2.21 | P60 | 420 | 19.32 0.04 | |
| 3.21 | RATIR | 5040 | 19.67 0.04 | |
| 3.25 | P60 | 120 | 19.70 0.08 | |
| 4.18 | P60 | 1320 | 19.97 0.04 | |
| 4.21 | RATIR | 5360 | 19.88 0.05 | |
| 5.21 | RATIR | 4960 | 19.95 0.05 | |
| 5.27 | P60 | 540 | 20.00 0.04 | |
| 6.20 | RATIR | 4880 | 19.94 0.05 | |
| 6.27 | P60 | 540 | 20.04 0.04 | |
| 7.19 | RATIR | 2640 | 19.90 0.05 | |
| 7.19 | P60 | 720 | 20.06 0.04 | |
| 8.22 | RATIR | 3920 | 19.82 0.05 | |
| 9.87 | Liverpool | 130 | 19.86 0.07 | |
| 10.87 | Liverpool | 130 | 19.69 0.07 | |
| 11.25 | P60 | 660 | 19.82 0.02 | |
| 11.87 | Liverpool | 130 | 19.73 0.07 | |
| 12.18 | P60 | 660 | 19.78 0.04 | |
| 12.22 | RATIR | 2880 | 19.70 0.04 | |
| 12.87 | Liverpool | 130 | 19.74 0.08 | |
| 13.16 | RATIR | 1280 | 19.68 0.05 | |
| 13.87 | Liverpool | 130 | 19.68 0.10 | |
| 14.18 | P60 | 660 | 19.70 0.04 | |
| 14.18 | RATIR | 3760 | 19.68 0.07 | |
| 15.16 | RATIR | 5280 | 19.70 0.05 | |
| 15.17 | P60 | 660 | 19.64 0.04 | |
| 15.87 | Liverpool | 150 | 19.80 0.07 | |
| 16.17 | P60 | 660 | 19.76 0.08 | |
| 17.87 | Liverpool | 150 | 19.83 0.03 | |
| 19.87 | Liverpool | 150 | 19.92 0.04 | |
| 21.88 | Liverpool | 150 | 20.00 0.03 | |
| 23.87 | Liverpool | 150 | 20.20 0.02 | |
| 25.17 | RATIR | 4560 | 20.16 0.07 | |
| 26.15 | RATIR | 2160 | 20.22 0.05 | |
| 27.15 | RATIR | 5200 | 20.31 0.05 | |
| 27.91 | Liverpool | 150 | 20.42 0.03 | |
| 28.16 | RATIR | 5120 | 20.38 0.05 | |
| 29.15 | RATIR | 5200 | 20.52 0.06 | |
| 29.19 | P60 | 540 | 20.49 0.05 | |
| 30.18 | P60 | 540 | 20.54 0.06 | |
| 30.19 | RATIR | 3120 | 20.63 0.06 | |
| 31.15 | RATIR | 3920 | 20.62 0.15 | |
| 32.15 | RATIR | 4960 | 20.73 0.06 | |
| 34.16 | P60 | 540 | 20.87 0.07 | |
| 35.17 | RATIR | 3680 | 20.96 0.06 | |
| 37.88 | Liverpool | 150 | 21.22 0.04 | |
| 39.88 | Liverpool | 150 | 21.27 0.06 | |
| 41.16 | RATIR | 3840 | 21.25 0.08 | |
| 45.15 | RATIR | 2080 | 21.33 0.12 | |
| 45.87 | Liverpool | 150 | 21.46 0.14 | |
| 46.15 | RATIR | 3120 | 21.36 0.11 | |
| 47.88 | Liverpool | 150 | 21.42 0.15 | |
| 53.87 | Liverpool | 150 | 21.75 0.06 | |
| 58.87 | Liverpool | 150 | 21.81 0.06 | |
| 62.86 | Liverpool | 150 | 21.80 0.10 | |
| 330.48 | Keck/LRIS | 200 | 23.26 0.06 | |
| 632.39 | DCT | 1200 | 23.15 0.04 | |
| 1.17 | P60 | 120 | 18.42 0.04 | |
| 1.26 | P60 | 120 | 18.56 0.06 | |
| 2.16 | RATIR | 7600 | 19.09 0.07 | |
| 2.21 | P60 | 420 | 19.12 0.04 | |
| 3.21 | RATIR | 5040 | 19.59 0.06 | |
| 3.24 | P60 | 450 | 19.64 0.05 | |
| 4.17 | P60 | 1320 | 19.97 0.06 | |
| 4.21 | RATIR | 5360 | 19.93 0.06 | |
| 5.21 | RATIR | 4960 | 20.05 0.12 | |
| 5.26 | P60 | 540 | 20.13 0.05 | |
| 6.20 | RATIR | 4880 | 20.13 0.09 | |
| 6.27 | P60 | 660 | 20.09 0.05 | |
| 7.18 | P60 | 660 | 20.17 0.05 | |
| 7.19 | RATIR | 3280 | 20.07 0.17 | |
| 8.22 | RATIR | 3920 | 20.10 0.07 | |
| 9.87 | Liverpool | 130 | 19.93 0.13 | |
| 10.87 | Liverpool | 130 | 19.86 0.16 | |
| 11.17 | P60 | 180 | 19.88 0.11 | |
| 11.87 | Liverpool | 130 | 19.87 0.15 | |
| 12.19 | P60 | 660 | 19.94 0.04 | |
| 12.22 | RATIR | 2880 | 19.91 0.05 | |
| 12.87 | Liverpool | 130 | 19.94 0.14 | |
| 13.16 | RATIR | 1280 | 19.86 0.05 | |
| 13.87 | Liverpool | 130 | 20.01 0.21 | |
| 14.18 | RATIR | 3760 | 19.84 0.05 | |
| 14.19 | P60 | 660 | 19.86 0.06 | |
| 15.16 | RATIR | 5280 | 19.83 0.05 | |
| 15.19 | P60 | 660 | 19.77 0.06 | |
| 15.87 | Liverpool | 150 | 19.91 0.10 | |
| 16.19 | P60 | 660 | 20.02 0.10 | |
| 17.87 | Liverpool | 150 | 19.94 0.07 | |
| 19.87 | Liverpool | 150 | 19.88 0.05 | |
| 21.87 | Liverpool | 150 | 19.97 0.04 | |
| 23.87 | Liverpool | 150 | 20.09 0.05 | |
| 25.17 | RATIR | 4560 | 20.04 0.06 | |
| 26.15 | RATIR | 2160 | 20.09 0.05 | |
| 27.15 | RATIR | 5200 | 20.15 0.06 | |
| 27.91 | Liverpool | 150 | 20.18 0.02 | |
| 28.16 | RATIR | 5120 | 20.21 0.05 | |
| 29.15 | RATIR | 5200 | 20.30 0.07 | |
| 29.22 | P60 | 540 | 20.31 0.06 | |
| 30.19 | RATIR | 3120 | 20.41 0.07 | |
| 30.20 | P60 | 540 | 20.44 0.08 | |
| 31.15 | RATIR | 4000 | 20.43 0.14 | |
| 32.15 | RATIR | 5440 | 20.52 0.07 | |
| 34.18 | P60 | 540 | 20.67 0.07 | |
| 35.17 | RATIR | 3680 | 20.68 0.07 | |
| 37.88 | Liverpool | 150 | 21.01 0.05 | |
| 39.87 | Liverpool | 150 | 21.03 0.08 | |
| 41.16 | RATIR | 3840 | 20.88 0.08 | |
| 45.15 | RATIR | 2080 | 21.05 0.11 | |
| 45.87 | Liverpool | 150 | 21.16 0.10 | |
| 46.15 | RATIR | 3120 | 21.12 0.10 | |
| 47.88 | Liverpool | 150 | 21.14 0.13 | |
| 53.86 | Liverpool | 150 | 21.56 0.09 | |
| 58.86 | Liverpool | 150 | 21.65 0.09 | |
| 62.86 | Liverpool | 150 | 21.53 0.12 | |
| 632.39 | DCT | 1200 | 23.03 0.06 | |
| 2.16 | RATIR | 5700 | 18.91 0.09 | |
| 2.21 | P60 | 870 | 19.02 0.08 | |
| 3.21 | RATIR | 3780 | 19.36 0.07 | |
| 3.24 | P60 | 840 | 19.43 0.09 | |
| 4.19 | P60 | 1320 | 19.53 0.10 | |
| 4.21 | RATIR | 4020 | 19.72 0.12 | |
| 5.20 | P60 | 1020 | 19.84 0.12 | |
| 5.21 | RATIR | 3720 | 19.84 0.08 | |
| 6.20 | RATIR | 3660 | 19.94 0.11 | |
| 6.26 | P60 | 540 | 19.95 0.12 | |
| 7.18 | P60 | 540 | 20.04 0.11 | |
| 7.19 | RATIR | 2820 | 19.71 0.35 | |
| 8.22 | RATIR | 2940 | 19.98 0.13 | |
| 9.87 | Liverpool | 150 | 20.11 0.12 | |
| 10.87 | Liverpool | 150 | 19.99 0.12 | |
| 11.87 | Liverpool | 150 | 20.13 0.11 | |
| 12.22 | RATIR | 2160 | 19.94 0.13 | |
| 12.87 | Liverpool | 150 | 20.02 0.11 | |
| 13.16 | RATIR | 960 | 20.02 0.12 | |
| 13.87 | Liverpool | 150 | 19.82 0.13 | |
| 14.18 | RATIR | 2820 | 19.87 0.12 | |
| 15.16 | RATIR | 3960 | 20.01 0.10 | |
| 15.87 | Liverpool | 150 | 20.21 0.20 | |
| 17.88 | Liverpool | 150 | 20.10 0.08 | |
| 19.88 | Liverpool | 150 | 20.08 0.05 | |
| 21.88 | Liverpool | 150 | 20.19 0.06 | |
| 23.88 | Liverpool | 150 | 20.27 0.04 | |
| 25.17 | RATIR | 3300 | 20.46 0.14 | |
| 26.15 | RATIR | 1560 | 20.06 0.13 | |
| 27.15 | RATIR | 3900 | 20.30 0.09 | |
| 27.90 | Liverpool | 150 | 20.33 0.07 | |
| 28.16 | RATIR | 3780 | 20.23 0.09 | |
| 29.15 | RATIR | 3900 | 20.49 0.10 | |
| 30.19 | RATIR | 2340 | 20.44 0.15 | |
| 31.15 | RATIR | 2940 | 20.45 0.11 | |
| 32.15 | RATIR | 4080 | 20.81 0.15 | |
| 34.15 | RATIR | 3660 | 20.87 0.12 | |
| 35.17 | RATIR | 2820 | 20.96 0.14 | |
| 37.87 | Liverpool | 150 | 21.15 0.15 | |
| 39.87 | Liverpool | 150 | 21.33 0.20 | |
| 45.86 | Liverpool | 150 | 21.41 0.30 | |
| 53.85 | Liverpool | 150 | 21.27 0.13 | |
| 58.85 | Liverpool | 150 | 21.60 0.20 | |
| 62.85 | Liverpool | 150 | 21.85 0.29 | |
| 632.41 | DCT | 1200 | 23.02 0.12 | |
| 2.16 | RATIR | 5700 | 18.78 0.08 | |
| 3.21 | RATIR | 3780 | 19.23 0.08 | |
| 4.21 | RATIR | 4020 | 19.53 0.09 | |
| 5.21 | RATIR | 3720 | 19.70 0.09 | |
| 6.20 | RATIR | 3660 | 19.79 0.07 | |
| 12.22 | RATIR | 2160 | 19.49 0.10 | |
| 13.16 | RATIR | 960 | 19.70 0.13 | |
| 14.18 | RATIR | 2820 | 19.75 0.09 | |
| 15.16 | RATIR | 3960 | 19.73 0.11 | |
| 22.16 | RATIR | 2340 | 19.85 0.13 | |
| 25.17 | RATIR | 3300 | 19.69 0.14 | |
| 26.15 | RATIR | 1560 | 20.00 0.13 | |
| 27.15 | RATIR | 3900 | 20.05 0.09 | |
| 28.16 | RATIR | 3780 | 20.01 0.09 | |
| 29.15 | RATIR | 3900 | 20.03 0.10 | |
| 30.19 | RATIR | 2340 | 20.04 0.11 | |
| 31.15 | RATIR | 2940 | 20.28 0.12 | |
| 32.15 | RATIR | 4080 | 20.00 0.11 | |
| 34.15 | RATIR | 3660 | 20.49 0.14 | |
| 35.17 | RATIR | 2820 | 20.51 0.14 | |
| 2.16 | RATIR | 6380 | 18.75 0.09 | |
| 3.21 | RATIR | 4230 | 19.22 0.07 | |
| 4.21 | RATIR | 4500 | 19.65 0.09 | |
| 5.21 | RATIR | 4160 | 19.64 0.10 | |
| 6.20 | RATIR | 4090 | 19.85 0.10 | |
| 14.18 | RATIR | 3150 | 20.07 0.12 | |
| 15.16 | RATIR | 4430 | 19.86 0.11 | |
| 27.15 | RATIR | 4360 | 19.92 0.13 | |
| 28.16 | RATIR | 4230 | 20.05 0.12 | |
| 29.15 | RATIR | 4360 | 20.23 0.13 | |
| 349.45 | Keck/MOSFIRE | 132 | 23.18 0.32 | |
| 2.16 | RATIR | 6380 | 18.60 0.09 | |
| 3.21 | RATIR | 4230 | 18.96 0.08 | |
| 4.21 | RATIR | 4500 | 19.37 0.11 | |
| 5.21 | RATIR | 4160 | 19.83 0.12 | |
| 6.20 | RATIR | 4090 | 19.89 0.13 | |
| 349.44 | Keck/MOSFIRE | 79 |
Note. — AB magnitudes, not corrected for Galactic extinction.