Divergent Horizontal Sub-surface Flows
within Active Region 11158
Abstract
We measure the horizontal subsurface flow in a fast emerging active region (NOAA 11158) using the ring-diagram technique and the HMI high-spatial resolution Dopplergrams. This active region had a complex magnetic structure and displayed significant changes in the morphology during its disk passage. Over the period of six days from 2011 February 11 to 16, the temporal variation in the magnitude of total velocity is found to follow the trend of magnetic field strength. We further analyze regions of individual magnetic polarity within AR 11158 and find that the horizontal velocity components in these sub-regions have significant variation with time and depth. The leading and trailing polarity regions move faster than the mixed-polarity region. Further, both zonal and meridional components have opposite signs for trailing and leading polarity regions at all depths showing divergent flows within the active region. We also find a sharp decrease in the magnitude of total horizontal velocity in deeper layer around major flares. It is suggested that the re-organization of magnetic fields during flares combined with the sunspot rotation decreases the magnitude of horizontal flows or that the flow kinetic energy has been converted into the energy released by flares. After the decline in flare activity and the sunspot rotation, the flows tend to follow the pattern of the magnetic activity. We also observe less variation in the velocity components near the surface but these tend to increase with depth, further demonstrating that the deeper layers are more affected by the topology of active regions.
1 Introduction
The launch of Solar Dynamics Observatory (SDO; Pesnell et al., 2012) by NASA in February 2010 initiated new interest in studying the dynamic nature of the Sun and its consequences. The unprecedented high-spatial and high-temporal resolution simultaneous/ continuous observations, for the first time, at several wavelengths ranging from photosphere to corona provided new details of various layers in the solar atmosphere as well as in the solar interior for both quiet and active Sun. As this was the time when the Sun was recovering from a relatively extended phase of the solar minimum, changes in the activity level were being monitored very closely by several instruments in space and on the ground. The solar activity level is generally measured by the number of sunspots and/or active regions (ARs) visible on the solar disk. These are the regions of high magnetic field and also the main source regions of eruptive events like flares and coronal mass ejections (CMEs), hence they serve as best examples for understanding the dynamics of the Sun.
The X2.2 flare on 2011 February 15 was the first flare of its class observed by the SDO. It originated from a strong bi-polar active region, NOAA 11158, that emerged on the Earth-facing side of the Sun’s surface on 2011 February 11 and continued to evolve for several days until it produced an X-class flare. This region was also the source of tens of C-class and several M-class flares, and many CMEs were observed during its disk passage. The evolution of AR 11158 as measured by number of sunspots, sunspot area and associated flares is given in Table 1. In addition to its eruptive nature, the active region had several rotating sunspots, i.e. rotating around their umbral center or another sunspot(s) within the same active region (e.g. Brown et al., 2003). Now, with improved observational capabilities, many more sunspots of these kind are being identified and used to understand the physical reasons for such rotation. Although the cause and effect of rotating sunspots are not yet fully understood, it has been argued that the twist and shear in the magnetic field may be responsible for this phenomenon and may lead to the buildup of energy, which might be later released by the flare (Stenflo, 1969). It is also suggested that the magnetic twist may result from the disturbance in large-scale flows in the solar convection zone and the photosphere or sub-photospheric layers (López Fuentes et al., 2003).
While most studies on AR 11158 are confined to exploring conditions in the photosphere and higher atmosphere (e.g. Schrijver et al., 2011; Petrie, 2013; Wang et al., 2014; Malanushenko et al., 2014; Zhao et al., 2014; Sorriso-Valvo et al., 2015), a very few are available for those below the surface (e.g. Gao et al., 2012, 2014). The former investigations cover a large variety of studies including sudden/rapid photospheric motion within the active region, magnetic topology, evolution of helicity by shearing motion of flux tubes, and reconstruction of various events associated with this region. However, the conditions below the surface were not examined in detail. Gao et al. (2012) investigated the correlation between photospheric current helicity and subsurface kinetic helicity by analyzing vector magnetograms and subsurface velocities. The velocities were computed using the time-distance pipeline of HMI and analysis was carried out only for a shallow depth, i.e. 0 – 1 Mm. In this paper, we investigate the changes in deeper layers (down to 12 Mm) by exploring velocity fields and their temporal evolution. The analysis is carried out for the active region as whole and also for the leading, trailing and mixed-polarity flux regions separately.
The paper is organized as follows; in Section 2, we describe the data and technique used in the analysis and the data reduction. The results are presented in Section 3 followed by the discussion in Section 4. Finally, we summarize our findings in Section 5.
2 Analysis
2.1 Data and Technique
High-spatial resolution Doppler images from the Helioseismic and Magnetic Imager (HMI; Scherrer et al., 2012) on board SDO were used in this study. The Dopplergrams were constructed using measurements taken in the 6173.3 Å absorption line in the photosphere with pixel size of 0.5 arcsec and cadence of 45 s. We applied one of the techniques of local helioseismology, known as ring-diagram analysis, to calculate flows in the thin layer below the solar surface. In this technique, high-degree acoustic modes are used to infer the characteristics of the propagating waves in localized areas (Hill, 1988). This method has been extensively used to study long-term variations in sub-surface flows (Komm et al., 2013, 2014) as well as short-term variations in subsurface properties of both active and quiet regions (Baldner et al., 2011; Basu et al., 2004; Bogart et al., 2008; Jain et al., 2008, 2012; Komm et al., 2011; Rajaguru et al., 2001; Rabello-Soares et al., 2013; Tripathy et al., 2008, 2013).
In this study, we track the regions of interest for 1440 min using the surface rotation rate (Snodgrass, 1984) and apodize each tracked area with a circular function. Then a three-dimensional FFT is applied in both spatial and temporal directions to obtain a three-dimensional power spectrum that is fitted using a Lorentzian profile model (Haber et al., 2000),
| (1) |
where is the oscillation power for a wave with a temporal frequency () and the total wave number . There are six parameters to be fitted: two Doppler shifts ( and ) for waves propagating in the orthogonal zonal and meridional directions, the background power (), the mode central frequency (), the mode width (), and the amplitude (). Finally, the fitted velocities ( and ) are inverted using a regularized least square (RLS) method to estimate depth dependence of various components of the horizontal velocity ( and ).
2.2 Data Reduction and Systematics
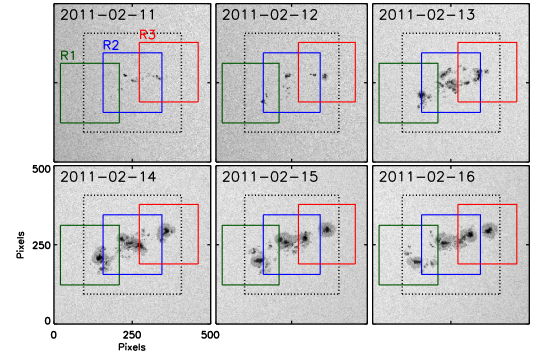
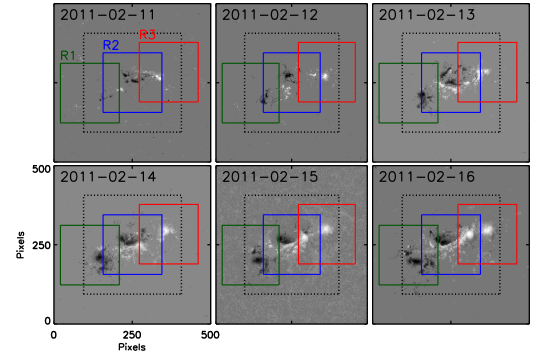
We analyze Dopplergrams using two sets of regions; the first set comprises regions of 1212o while the second set contains regions of 7.5o7.5o. These regions are chosen in such a way that the entire active region is covered in set 1 and three smaller regions are considered in set 2 which are dominated by (i) trailing magnetic polarity - R1, (ii) mixed polarity - R2, and (iii) leading polarity - R3. The evolution of AR 11158 in six consecutive days is shown in continuum intensity and magnetograms in Figures 1 and 2, respectively. The areas covered by 7.5o7.5o regions in these figures are marked with solid lines while 1212o regions are shown by dotted lines. Details of each region are given in Table 2 where locations are tabulated for reference images (i.e. the image at the center of each time series). It should be noted that the Carrington longitude and latitude of each region remain unchanged which ensures that the areas studied here do not change with time or the rotation of the Sun.
In order to investigate the temporal evolution of velocity fields in various time samples, it is necessary to address the influence of systematics. It has been shown in previous studies that the helioseismic measurements suffer from a variety of systematic errors. One of the potential source of errors is the center to limb effect (for example, Jain et al., 2013). This effect becomes more prominent when we compare properties of various regions at different disk positions as it increases with the angle from the disk center. Another systematic effect is the annual variation in the solar inclination towards Earth, known as angle (for example, Zaatri et al., 2006). In both cases, we lose the spatial resolution and increase the errors in measurements. Thus, these systematics need to be corrected in order to infer the true properties of sub-surface layers, e.g., the evolution of flows in active regions. Several theoretical as well as empirical explanations have been suggested to remove these effects from flows (Komm et al., 2015, and references therein).
In a different approach to reduce these effects and infer residuals in active regions, we use quiet regions from the neighboring Carrington rotations and subtract their values from those active regions (Jain et al., 2012). In this study, we select quiet days from the previous Carrington rotation at same heliographic locations as in the case of active region. The quiet days corresponding to each active region are also listed in Table 2. This analysis is further constrained by the selection of tile sizes. While selection of large tiles leads to a larger population of fitted mode available for inversion that penetrate the deeper layers, it dilutes the effect of strong magnetic field due to the inclusion of neighboring quiet regions. In this paper, we present analysis for two depth ranges; down to 12 Mm for the 12o tiles and down to 7 Mm for 7.5o tiles.
3 Results
3.1 Evolution of magnetic field in analysis windows
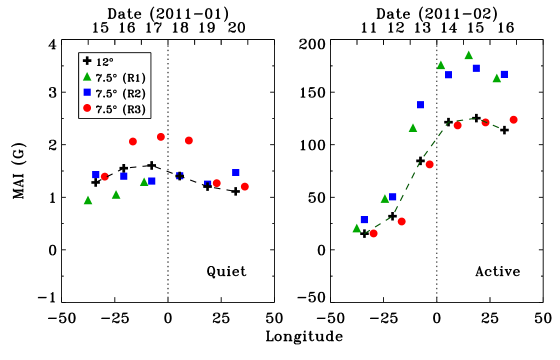
AR 11158 had a complex magnetic field structure with four major concentrations. The magnetic flux distribution was tilted with respect to the equator. The leading polarity flux, which was positive, was the most equatorward and the trailing polarity flux, which was negative, was the most poleward. The distribution of flux was well aligned with the Hale-Nicholson law. In order to parameterize the evolution of AR 11158 in different analysis windows, we plot the magnetic active index (MAI) in Figure 3, and provide the mean MAI and standard deviation in Table 3. Values for corresponding quiet regions from the previous Carrington rotation are also included here. The MAI is a proxy for magnetic activity that is calculated by converting line-of-sight magnetogram data into the absolute value (Basu et al., 2004). The averages are computed using the HMI magnetograms over the same length of time as in the Dopplergram tiles. It is noted that the AR 11158 was a fast emerging active region and its morphology changed significantly during the course of its disk passage. In contrast to AR 11158, there is less variation in MAIs in quiet areas with time, hence the standard deviations are smaller.
3.2 Sub-surface flows in selected quiet regions
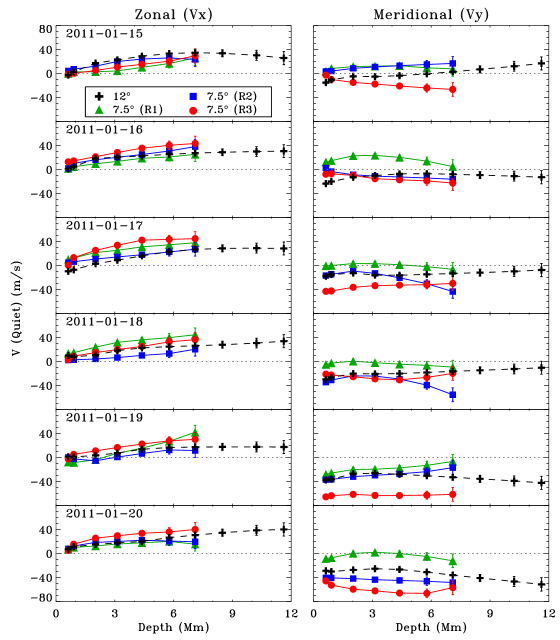
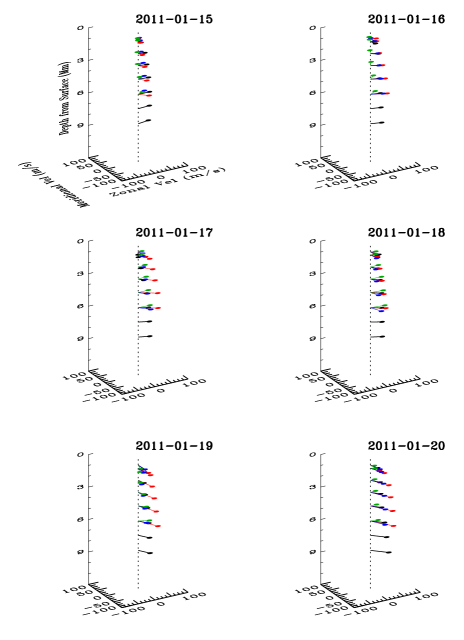
We display zonal and meridional components of the horizontal velocity, and , in different quiet regions as a function of depth in Figure 4. As the presence of strong magnetic field modifies the flow of plasma in the solar interior, the small variation of the MAI values in quiet regions, as illustrated in Figure 3, leads to the lower temporal variation in flows of these regions. The for different regions are within 1, however, the magnitude of is seen to increase with depth which is in agreement with the observations where rotation rate is found to increase with depth in the outer 5% of the Sun. The visible differences in the values of component may be attributed to the different locations of regions on the solar surface, hence the center-to-limb effect. However, in most cases, the meridional component is negative, i.e. poleward in southern hemisphere. As one may assume similar geometric effect on parameters computed at same locations, we use these quiet region values to eliminate the systematics and contribution of the background magnetic field (quiet Sun) from the active region values. The depth dependence of total horizontal velocity is plotted in Figure 5 for all six days where . It is clearly visible that the variation in is small with time and also between different regions.
3.3 Sub-surface flows in AR 11158
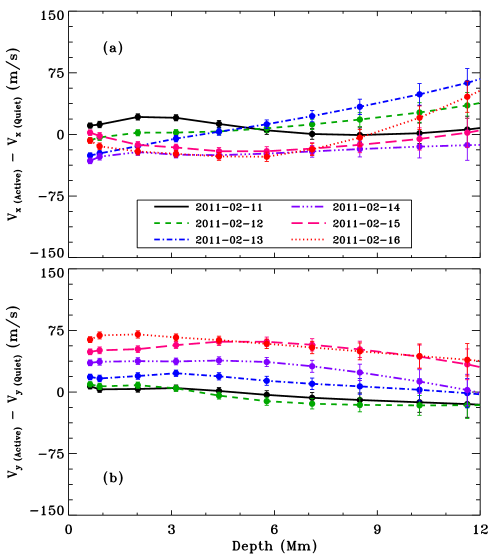
The velocity components, and , in AR 11158 for 1212o regions are shown in Figure 6. These are the residual velocities which are obtained by subtracting quiet region values from those of the active regions. Although the active region went through a rapid growth during the period of this study, as shown in Figure 3, it is interesting to note that the daily variations in depth profiles were less affected. In six days of the evolution, the morphology of this active region changed from a simple bi-polar region to a complex region having intermingled polarities within the single penumbra. There are some changes in the maagnitude of individual velocity components in deeper layers, however these are within 2–3. These results are in agreement with Gao et al. (2012) where authors found the magnitudes of - and -components of the velocity remained stable in upper 1 Mm, and there were no coherent and sudden changes. However they did not explore deeper layers where changes are more visible. Since these velocities represent average values for 1440 min, the changes on shorter time scales can not be described. Figure 7 illustrates the depth variation of total horizontal velocity where each panel represents an individual day. Though a small magnitude is visible for the first two days at all depths, a change in direction was noticed on the second in shallow layers. With the increase in magnetic field and other morphological changes within the active region, a twist in horizontal flow was developed around 6 Mm; the horizontal velocity in shallow layers was in westward direction and the opposite was seen below this depth down to 12 Mm, the lower-depth limit in this study. This twist disappears after the third day and there was no significant change in velocity for next three days.
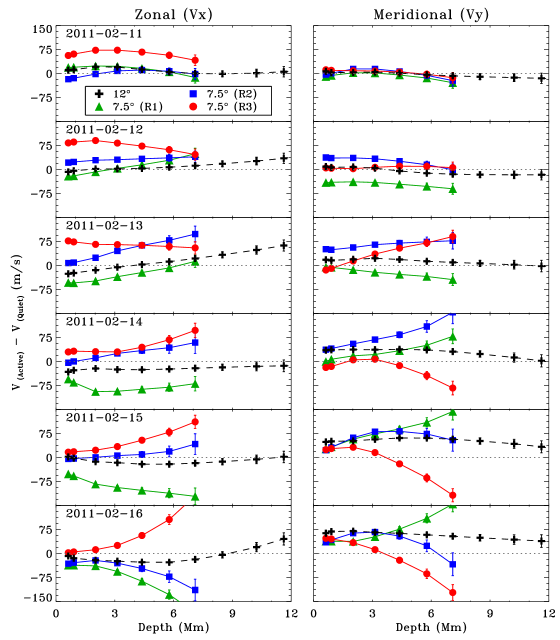
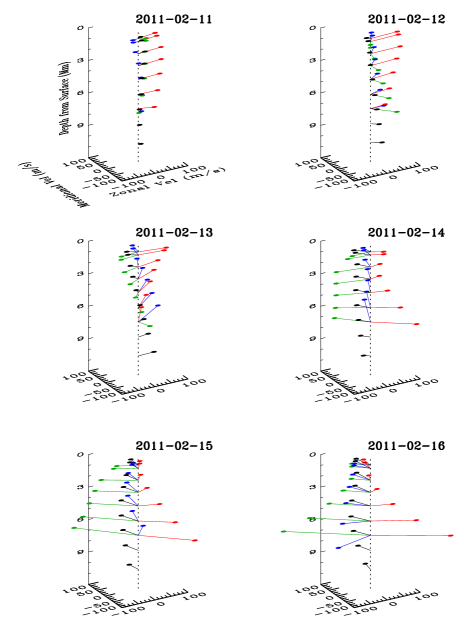
We further investigate flow patterns within the active region by analyzing three major sub-regions as described in Section 2.2; the leading polarity, the trailing polarity and the mixed polarity regions. The depth variations of the resultant and in these sub-regions are displayed in Figure 8, and the total horizontal velocity in Figure 9. We also include values for 1212o tiles for comparison. There are several distinct features in these plots; (i) there is significant variation in velocity components in 7.5o tiles as compared to 12o tiles, (ii) the leading and trailing polarity regions move faster than the mixed-polarity region, (iii) the region-to-region variation is small when there is no major change in the morphology of active region or sub-regions, (iv) both zonal and meridional components have opposite signs for trailing and leading polarity region at all depths. While and are positive and negative, respectively, in the leading polarity region, the opposite is obtained for the trailing polarity region, (v) these velocity components also change sign in mixed-polarity region after the X2.2 class flare on Feb 15, and in the trailing-polarity region after the M6.6 flare on Feb 13 and continue to increase their magnitudes until January 16, (vi) the velocity components have less variation near the surface but these tend to increase with depth demonstrating that the deeper layers are more affected by the topology of regions. These findings, in context of the possible scenario, are discussed in the following section.
4 Discussion
Several authors have attempted to explain the temporal variation of horizontal flows, the origin of sunspot rotation and their connection with flares in AR 11158. Beauregard et al. (2012) measured horizontal motion with the local correlation tracking (LCT) around the time of X2.2 flare on 2001 February 15 using continuum images and magnetograms from HMI. They computed horizontal motion averaged over the 1-hour pre- and post-flare periods, and found elevated horizontal flow values near the polarity-inversion line (located in region R2 of this paper) in the post-flare period. Jiang et al. (2012) also tracked the evolution of AR 11158 for five days and found that the preceeding polarity regions moved faster in westward direction towards equator whereas following polarity regions moved slowly in eastward direction. More recently, Wang et al. (2014) investigated the temporal evolution of the photospheric velocity around an X2.2 flare and reported a sudden change in shear flows around the flaring magnetic polarity inversion line. Although the major focus of these studies was on exploring changes in flow patterns at the major flaring site, they do not provide a complete picture of the entire active region. Also, all these studies use the motion of surface features to determine velocities, hence describe horizontal velocities at or above the solar surface.
The conditions below the surface can only be measured using the helioseismic techniques. There have been studies in the past to investigate flows in the layers very close to the surface within the active regions. It is now accepted that the flows around active regions are dominated by inflows into these regions. Using near-surface horizontal velocities inferred from the time-distance helioseismology covering a few Carrington rotations in Solar Cycle 23, Zhao et al. (2004) suggested that the residual rotational velocity of magnetic elements depends on their magnetic field strength: the stronger the magnetic field strength, the faster the magnetic elements rotate relative to the quiet regions. They also found that magnetic elements of the following polarity rotate faster than the leading polarity elements of the same magnetic strength. Later, Švanda et al. (2008) confirmed asymmetry between the flows around leading and following polarities of active regions. However, studies using the ring-diagram technique were restricted to analyzing active regions as a whole typically for 1515o tiles, mainly due to the availability of Dopplergrams with moderate spatial resolution. Using this technique, we have analyzed isolated active regions using tiles as small as 1111o to study the temporal variation of sub-surface horizontal velocity in three consecutive Carrington rotations (Jain et al., 2012). Hindman et al. (2009) also used the ring-diagram method to determine flows in smaller areas of active regions by exploiting surface gravity waves ( modes). This approach provided direct measurement of flow velocity in the layers where the mode has significant amplitude, i.e. the layer spanning about 2 Mm below the surface. All these studies confirmed that the magnetic regions move at considerably higher velocities as compared to the quiet regions and the velocities depend on the magnetic field strength. In the present study of AR 11158, we also observe a link between magnetic field strength and computed velocities. However, in addition to the magnetic field changes, the active region has an associated characteristic, i.e. the sunspot rotation that developed at the time of increased magnetic field strength. Thus, the resultant elevated flow values are a combination of both effects, i.e., the strong magnetic field and sunspot rotation.
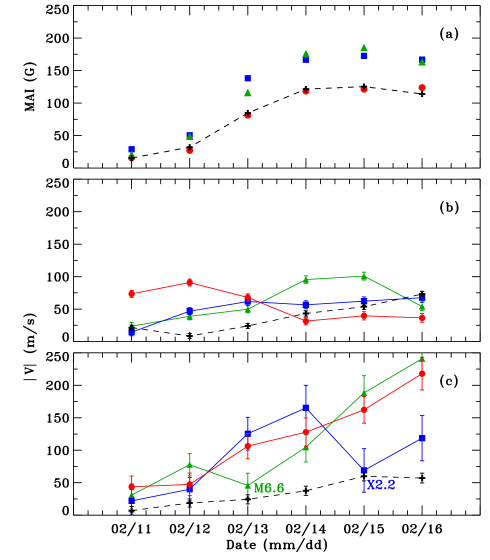
We further show, in Figure 10, examples of the temporal variation of average horizontal velocity, , in different polarity regions at two depths; one near the surface around 2.0 Mm and other at a deeper layer around 7.0 Mm. The variation of MAIs in all three regions is also shown in the top panel. Regions R1 (trailing polarity) and R2 (mixed polarity) have similar variations in MAIs while region R3 (leading polarity) has consistently lower values than the other two regions. As evident from panels (b) and (c), the velocity magnitude and errors are larger at 7 Mm as compared to the 2 Mm layer. Although there is less variation in the near surface layers (panel b), we notice two major dips in panel (c); one on February 13 for R1 and another on February 15 for R2. These dips interestingly coincide with two major flares; the M6.6 flare on February 13 from R1 and X2.2 flare on February 15 from R2. We assume the re-organization of magnetic fields during flares combined with the sunspot rotation decreased the magnitude of horizontal flows at the time of flares. After the decline in flare activity and the sunspot rotation, the flows tend to follow the pattern of the magnetic activity. This is supported by the study of Sudol & Harvey (2005) where they provided strong evidence for the re-organization of magnetic field during major flares. These findings need to be confirmed with a larger set of active regions of similar kind. With the ongoing operations of SDO/HMI, we anticipate identifying more cases where we can apply the helioseismic techniques to infer properties/flow fields in the regions of different polarities within active regions.
5 Summary
In summary, we measure the horizontal subsurface flow in the fast emerging AR 11158 from the HMI high-spatial resolution Dopplergrams using the ring-diagram technique. This active region was developed on the Earth-side of solar disk; had a complex magnetic structure and displayed significant changes in morphology with time, including several rotating sunspots and large flares. Over the period of six days, the temporal variation in the magnitude of the total velocity is found to be related to the changes in magnetic field strength as measured by the magnetic activity index. With the rise in magnetic activity, we see an increase in the magnitude of sub-surface flow. However, the analysis of individual polarity regions provides several interesting results. The horizontal velocity components in individual polarity regions, which are sub-regions of the active region, have significant variation with time and depth. In the case of AR 11158, the leading and trailing polarity regions move faster than the mixed-polarity region. However, the region-to-region variation is small when there is no major change in the morphology of these regions. Further, both zonal and meridional components have opposite signs for trailing and leading polarity regions at all depths. These velocity components change sign in the mixed-polarity region after the X2.2 class flare on Feb 15, and in the trailing-polarity region after the M6.6 flare on Feb 13 that produced twists in flow fields of these regions. We also find sharp dips in the total velocity in deeper layers around the time of flares. It is suggested that the re-organization of magnetic fields during flares combined with the sunspot rotation may have reduced the magnitude of horizontal flows or that the flow kinetic energy has been converted into the energy released by flares. After the decline in flare activity and the sunspot rotation, the flows tend to follow the pattern of the magnetic activity. Finally, the velocity components have less variation near the surface but these variation tend to increase with depth demonstrating that the deeper layers are more affected by the topology of active regions. We plan to identify more active regions with/without different characteristics and perform a statistical study to develop a better picture of the horizontal flows in the sub-surface layers of complex active regions.

| Date | AR TypebbMagnetic configuration of the spots in the Mt. Wilson system | Sunspot | Number of | |
|---|---|---|---|---|
| AreaccArea of spots in millionths of the visible hemisphere | Count | Flares | ||
| 2011-02-11 | 40 | 5 | - | |
| 2011-02-12 | 40 | 12 | - | |
| 2011-02-13 | 120 | 31 | 1 M(6.6), 2 C | |
| 2011-02-14 | 450 | 360 | 1 M (2.2), 10 C | |
| 2011-02-15 | 600 | 36 | 1 X(2.2), 4 C | |
| 2011-02-16 | 620 | 19 | 2 M(1.0, 1.6), 9 C | |
| 2011-02-17 | 290 | 17 | 11 C | |
| 2011-02-18 | 310 | 25 | 5 C, 2 M(6.6, 1.4) | |
| 2011-02-19 | 280 | 10 | 7 C | |
| 2011-02-20 | 200 | 10 | - | |
| Region | Region | Day | Date | Location | CR | ||
|---|---|---|---|---|---|---|---|
| Size | Number | number | Quietaa03:44:15 UT | Activebb11:59:15 UT | Long | Lat | Long |
| 12o | – | 1 | 15-Jan-11 | 11-Feb-11 | -34.00o | -20.0o | 35.07o |
| 2 | 16-Jan-11 | 12-Feb-11 | -20.80o | -20.0o | 35.07o | ||
| 3 | 17-Jan-11 | 13-Feb-11 | -7.66o | -20.0o | 35.07o | ||
| 4 | 18-Jan-11 | 14-Feb-11 | 5.50o | -20.0o | 35.07o | ||
| 5 | 19-Jan-11 | 15-Feb-11 | 18.60o | -20.0o | 35.07o | ||
| 6 | 20-Jan-11 | 16-Feb-11 | 31.80o | -20.0o | 35.07o | ||
| 7.5o | R1 | 1 | 15-Jan-11 | 11-Feb-11 | -37.60o | -20.5o | 31.47o |
| 2 | 16-Jan-11 | 12-Feb-11 | -24.40o | -20.5o | 31.47o | ||
| 3 | 17-Jan-11 | 13-Feb-11 | -11.20o | -20.5o | 31.47o | ||
| 4 | 18-Jan-11 | 14-Feb-11 | 1.90o | -20.5o | 31.47o | ||
| 5 | 19-Jan-11 | 15-Feb-11 | 15.00o | -20.5o | 31.47o | ||
| 6 | 20-Jan-11 | 16-Feb-11 | 28.20o | -20.5o | 31.47o | ||
| 7.5o | R2 | 1 | 15-Jan-11 | 11-Feb-11 | -34.00o | -20.0o | 35.07o |
| 2 | 16-Jan-11 | 12-Feb-11 | -20.80o | -20.0o | 35.07o | ||
| 3 | 17-Jan-11 | 13-Feb-11 | -7.66o | -20.0o | 35.07o | ||
| 4 | 18-Jan-11 | 14-Feb-11 | 5.50o | -20.0o | 35.07o | ||
| 5 | 19-Jan-11 | 15-Feb-11 | 18.60o | -20.0o | 35.07o | ||
| 6 | 20-Jan-11 | 16-Feb-11 | 31.80o | -20.0o | 35.07o | ||
| 7.5o | R3 | 1 | 15-Jan-11 | 11-Feb-11 | -29.70o | -19.5o | 39.37o |
| 2 | 16-Jan-11 | 12-Feb-11 | -16.50o | -19.5o | 39.37o | ||
| 3 | 17-Jan-11 | 13-Feb-11 | -3.36o | -19.5o | 39.37o | ||
| 4 | 18-Jan-11 | 14-Feb-11 | 9.80o | -19.5o | 39.37o | ||
| 5 | 19-Jan-11 | 15-Feb-11 | 22.90o | -19.5o | 39.37o | ||
| 6 | 20-Jan-11 | 16-Feb-11 | 36.10o | -19.5o | 39.37o | ||
| Region | Region | Quiet Region | Active Region | ||
|---|---|---|---|---|---|
| Size | Number | Mean (G) | STDDEV (%) | Mean (G) | STDDEV (%) |
| 12o | – | 1.4 | 14 | 82.1 | 57 |
| 7.5o | R1 | 1.4 | 24 | 118.4 | 58 |
| 7.5o | R2 | 1.4 | 6 | 120.6 | 53 |
| 7.5o | R3 | 1.7 | 26 | 81.2 | 60 |
References
- Baldner et al. (2011) Baldner, C. S., Bogart, R. S., & Basu, S. 2011, ApJ, 733, L5
- Basu et al. (2004) Basu, S., Antia, H. M., & Bogart, R. S. 2004, ApJ, 610, 1157
- Beauregard et al. (2012) Beauregard, L., Verma, M., & Denker, C. 2012, Astronomische Nachrichten, 333, 125
- Bogart et al. (2008) Bogart, R. S., Basu, S., Rabello-Soares, M. C., & Antia, H. M. 2008, Sol. Phys., 251, 439
- Brown et al. (2003) Brown, D. S., Nightingale, R. W., Alexander, D., et al. 2003, Sol. Phys., 216, 79
- Gao et al. (2012) Gao, Y., Zhao, J., & Zhang, H. 2012, ApJ, 761, L9
- Gao et al. (2014) —. 2014, Sol. Phys., 289, 493
- Haber et al. (2000) Haber, D. A., Hindman, B. W., Toomre, J., et al. 2000, Sol. Phys., 192, 335
- Hill (1988) Hill, F. 1988, ApJ, 333, 996
- Hindman et al. (2009) Hindman, B. W., Haber, D. A., & Toomre, J. 2009, ApJ, 698, 1749
- Jain et al. (2008) Jain, K., Hill, F., Tripathy, S. C., et al. 2008, in Astronomical Society of the Pacific Conference Series, Vol. 383, Subsurface and Atmospheric Influences on Solar Activity, ed. R. Howe, R. W. Komm, K. S. Balasubramaniam, & G. J. D. Petrie , 389
- Jain et al. (2012) Jain, K., Komm, R. W., González Hernández, I., Tripathy, S. C., & Hill, F. 2012, Sol. Phys., 279, 349
- Jain et al. (2013) Jain, K., Tripathy, S. C., Basu, S., et al. 2013, in Astronomical Society of the Pacific Conference Series, Vol. 478, Fifty Years of Seismology of the Sun and Stars, ed. K. Jain, S. C. Tripathy, F. Hill, J. W. Leibacher, & A. A. Pevtsov, 193
- Jiang et al. (2012) Jiang, Y., Zheng, R., Yang, J., et al. 2012, ApJ, 744, 50
- Komm et al. (2013) Komm, R., González Hernández, I., Hill, F., et al. 2013, Sol. Phys., 287, 85
- Komm et al. (2015) Komm, R., González Hernández, I., Howe, R., & Hill, F. 2015, Sol. Phys., 290, 1081
- Komm et al. (2014) Komm, R., Howe, R., González Hernández, I., & Hill, F. 2014, Sol. Phys., 289, 3435
- Komm et al. (2011) Komm, R., Howe, R., & Hill, F. 2011, Sol. Phys., 268, 407
- López Fuentes et al. (2003) López Fuentes, M. C., Démoulin, P., Mandrini, C. H., Pevtsov, A. A., & van Driel-Gesztelyi, L. 2003, A&A, 397, 305
- Malanushenko et al. (2014) Malanushenko, A., Schrijver, C. J., DeRosa, M. L., & Wheatland, M. S. 2014, ApJ, 783, 102
- Pesnell et al. (2012) Pesnell, W. D., Thompson, B. J., & Chamberlin, P. C. 2012, Sol. Phys., 275, 3
- Petrie (2013) Petrie, G. J. D. 2013, Sol. Phys., 287, 415
- Rabello-Soares et al. (2013) Rabello-Soares, M. C., Bogart, R. S., & Scherrer, P. H. 2013, Journal of Physics Conference Series, 440, 012008
- Rajaguru et al. (2001) Rajaguru, S. P., Basu, S., & Antia, H. M. 2001, ApJ, 563, 410
- Scherrer et al. (2012) Scherrer, P. H., Schou, J., Bush, R. I., et al. 2012, Sol. Phys., 275, 207
- Schrijver et al. (2011) Schrijver, C. J., Aulanier, G., Title, A. M., Pariat, E., & Delannée, C. 2011, ApJ, 738, 167
- Snodgrass (1984) Snodgrass, H. B. 1984, Sol. Phys., 94, 13
- Sorriso-Valvo et al. (2015) Sorriso-Valvo, L., De Vita, G., Kazachenko, M. D., et al. 2015, ApJ, 801, 36
- Stenflo (1969) Stenflo, J. O. 1969, Sol. Phys., 8, 115
- Sudol & Harvey (2005) Sudol, J. J., & Harvey, J. W. 2005, ApJ, 635, 647
- Tripathy et al. (2013) Tripathy, S. C., Jain, K., Howe, R., et al. 2013, Journal of Physics Conference Series, 440, 012026
- Tripathy et al. (2008) Tripathy, S. C., Wet, S., Jain, K., Clark, R., & Hill, F. 2008, Journal of Astrophysics and Astronomy, 29, 207
- Švanda et al. (2008) Švanda, M., Kosovichev, A. G., & Zhao, J. 2008, ApJ, 680, L161
- Wang et al. (2014) Wang, S., Liu, C., Deng, N., & Wang, H. 2014, ApJ, 782, L31
- Zaatri et al. (2006) Zaatri, A., Komm, R., González Hernández, I., Howe, R., & Corbard, T. 2006, Sol. Phys., 236, 227
- Zhao et al. (2004) Zhao, J., Kosovichev, A. G., & Duvall, Jr., T. L. 2004, ApJ, 607, L135
- Zhao et al. (2014) Zhao, J., Li, H., Pariat, E., et al. 2014, ApJ, 787, 88