Unsupervised Learning in Genome Informatics
With different genomes available, unsupervised learning algorithms are essential in learning genome-wide biological insights. Especially, the functional characterization of different genomes is essential for us to understand lives. In this book chapter, we review the state-of-the-art unsupervised learning algorithms for genome informatics from DNA to MicroRNA.
DNA (DeoxyriboNucleic Acid) is the basic component of genomes. A significant fraction of DNA regions (transcription factor binding sites) are bound by proteins (transcription factors) to regulate gene expression at different development stages in different tissues. To fully understand genetics, it is necessary of us to apply unsupervised learning algorithms to learn and infer those DNA regions. Here we review several unsupervised learning methods for deciphering the genome-wide patterns of those DNA regions.
MicroRNA (miRNA), a class of small endogenous non-coding RNA (RiboNucleic acid) species, regulate gene expression post-transcriptionally by forming imperfect base-pair with the target sites primarily at the 3′ untranslated regions of the messenger RNAs. Since the 1993 discovery of the first miRNA let-7 in worms, a vast amount of studies have been dedicated to functionally characterizing the functional impacts of miRNA in a network context to understand complex diseases such as cancer. Here we review several representative unsupervised learning frameworks on inferring miRNA regulatory network by exploiting the static sequence-based information pertinent to the prior knowledge of miRNA targeting and the dynamic information of miRNA activities implicated by the recently available large data compendia, which interrogate genome-wide expression profiles of miRNAs and/or mRNAs across various cell conditions.
1 Introduction
Since the 1990s, the whole genomes of a large number of species have been sequenced by their corresponding genome sequencing projects. In 1995, the first free-living organism Haemophilus influenzae was sequenced by the Institute for Genomic Research pmid7542800 . In 1996, the first eukaryotic genome (Saccharomyces cerevisiase) was completely sequenced yeastGenome . In 2000, the first plant genome, Arabidopsis thaliana, was also sequenced by Arabidopsis Genome Initiative plantGenome . In 2004, the Human Genome Project (HGP) announced its completion pmid15496913 . Following the HGP, the Encyclopedia of DNA Elements (ENCODE) project was started, revealing massive functional putative elements on the human genome in 2011 pmid22955616 . The drastically decreasing cost of sequencing enables the 1000 Genomes Project to be carried out, resulting in an integrated map of genetic variation from 1,092 human genomes published in 2012 pmid23128226 . The massive genomic data generated by those projects impose an unforeseen challenge for large-scale data analysis at the scale of gigabytes or even terabytes.
Computational methods are essential in analyzing the massive genomic data. They are collectively known as bioinformatics or computational biology; for instance, motif discovery compSurvey helps us distinguish real signal subsequence patterns from background sequences. Multiple sequence alignment blast can be used to study the similarity between multiple sequences. Protein structure prediction proteinstructurepredictoin ; wong2010protein can be applied to predict the 3D tertiary structure from an amino acid sequence. Gene network inference geneNetwork are the statistical methods to infer gene networks from correlated data (e.g. microarray data). Promoter prediction promoterPrediction help us annotate the promoter regions on a genome. Phylogenetic tree inference phylogeneticInference can be used to study the hierarchical evolution relationship between different species. Drug scheduling drugScheduling ; wong2012evolutionary can help solve the clinical scheduling problems in an effective manner. Although the precision of those computational methods is usually lower than the existing wet-lab technology, they can still serve as useful preprocessing tools to significantly narrow search spaces. Thus prioritized candidates can be selected for further validation by wet-lab experiments, saving time and funding. In particular, unsupervised learning methods are essential in analyzing the massive genomic data where the ground truth is limited for model training. Therefore, we describe and review several unsupervised learning methods for genome informatics in this chapter.
2 Unsupervised Learning for DNA
In human and other eukaryotes, gene expression is primarily regulated by the DNA binding of various modulatory transcription factors (TF) onto cis-regulatory DNA elements near genes. Binding of different combinations of TFs may result in a gene being expressed in different tissues or at different developmental stages. To fully understand a gene’s function, it is essential to identify the TFs that regulate the gene and the corresponding TF binding sites (TFBS). Traditionally, these regulatory sites were determined by labor-intensive experiments such as DNA footprinting or gel-shift assays. Various computational approaches have been developed to predict TF binding sites in silico. Detailed comparisons can be found in the survey by Tompa et al. Tompa . TFBS are relatively short (10-20 bp) and highly degenerate sequence motifs, which makes their effective identification a computationally challenging task. A number of high-throughput experimental technologies were developed recently to determine protein-DNA binding such as protein binding microarray (PBM) pmid16998473 , chromatin immunoprecipitation (ChIP) followed by microarray or sequencing (ChIP-Chip or ChIP-Seq) chipchip ; chipseq , microfluidic affinity analysis pmid20802496 , and protein microarray assays pmid19879846 ; pmid16785442 .
On the other hand, it is expensive and laborious to experimentally identify TF-TFBS sequence pairs, for example, using DNA footprinting Footprint , gel electrophoresis Gel_shift , and SELEX pmid2200121 . The technology of Chromatin immunoprecipitation (ChIP) chipchip ; chipseq measures the binding of a particular TF to the nucleotide sequences of co-regulated genes on a genome-wide scale in vivo, but at low resolution. Further processing are needed to extract precise TFBSs pmid12101404 . Protein Binding Microarray (PBM) was developed to measure the binding preference of a protein to a complete set of k-mers in vitro pmid16998473 . The PBM data resolution is unprecedentedly high, comparing with the other traditional techniques. The DNA k-mer binding specificities of proteins can even be determined in a single day. It has also been shown to be largely consistent with those generated by in vivo genome-wide location analysis (ChIP-chip and ChIP-seq) pmid16998473 .
To store and organize the precious data, databases have been created. TRANSFAC is one of the largest databases for regulatory elements including TFs, TFBSs, weight matrices of the TFBSs, and regulated genes TRANSFAC06 . JASPAR is a comprehensive collection of TF DNA-binding preferences JASPAR2010 . Other annotation databases are also available (e.g. Pfam Pfam2004 , UniProbe pmid21037262 , ScerTF ScerTF , FlyTF FlyTF , YeTFaSCo pmid22102575 , and TFcat TFcat ). Notably, with the open-source and open-access atmosphere wide-spreads on the Internet in recent years, a database called ORegAnno appeared in 2008 ORegAnno . It is an open-access community-driven database and literature curation system for regulatory annotation. The ENCODE consortium has also released a considerable amount of ChIP-Seq data for different DNA-binding proteins pmid22955616 .
In contrast, unfortunately, it is still difficult and time-consuming to extract the high-resolution 3D protein-DNA (e.g. TF-TFBS ) complex structures with X-Ray Crystallography xray or Nuclear Magnetic Resonance (NMR) spectroscopic analysis NMR . As a result, there is strong motivation to have unsupervised learningl methods based on existing abundant sequence data, to provide testable candidates with high confidence to guide and accelerate wet-lab experiments. Thus unsupervised learning methods are proposed to provide insights into the DNA binding specificities of transcription factors from the existing abundant sequence data.
2.1 DNA Motif Discovery and Search
Transcription Factor Binding Sites (TFBSs) are represented in DNA motif models to capture its sequence degeneracy Wong:2011:GLP:2093590.2093604 . They are described in the following sections.
Representation (DNA Motif Model)
There are several motif models proposed. For example, consensus string representation, a set of motif instance strings, count matrix, position frequency matrix (PFM), and position weight matrix (PWM). Among them, the most popular motif models are the matrix ones. They are the count matrix, PFM, and PWM. In particular, the most common motif model is the zero-order PWM which has been shown to be related to the average protein-DNA binding energy in the experimental and statistical mechanics study pmid3612791 . Nonetheless, it assumes independence between different motif positions. A recent attempt has been made to generalize PWM but the indel operations between different nucleotide positions are still challenging alllevelcomplexity . Although the column dependence and indel operations could be modeled by Hidden Markov Model (HMM) simultaneously, the number of training parameters is increased quadratically. There is a dilemma between accuracy and model complexity.
Count Matrix
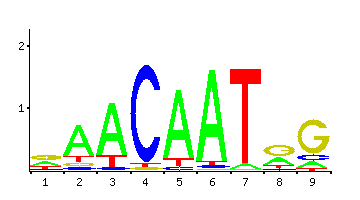
The count matrix representation is the de facto standard adopted in databases. In the count matrix representation, a DNA motif of width is represented as a -by- matrix . The th column of corresponds to the th position of the motif, whereas the th row of correspond to the th biological character. In the context of DNA sequence, we have 4 characters A,C,G,T. is the occurring frequency of the biological character at the th position. For example, the count matrix of the SOX9 protein (JASPAR ID:MA0077.1 and UniProt ID:P48436) is tabulated in the following matrix form. The motif width is 9 so we have a matrix here. The corresponding sequence logo is also depicted in Figure 1.
Notably, adenine has not been found at the 4th position, resulting in a zero value. It leads to an interesting scenario. Is adenine really not found at that position or the sample size (the number of binding sites we have found so far for SOX9) is too small that the sites having adenine at that position have not been verified experimentally yet ? To circumvent the problem, people usually add pseudo counts to the matrix which is justified from the use of prior probability in statistics citeulike:163532 ; pmid19106141 . Such techniques are also found in natural language computing and machine learning.
Position Frequency Matrix (PFM)
In practice, a count matrix is usually converted to PFM, and thus a zero-order PWM for scanning a long sequence. The dimension and layout of count matrix is exactly the same as those of the corresponding PFM and zero-order PWM. Their main difference is the element type. For count matrix, each element is simply a count. For PFM, each element is a Maximum Likelihood Estimate (MLE) parameter. For zero-order PWM, each element is a weight.
To derive a PFM from a count matrix, , maximum likelihood estimation (MLE) is used mosesSurvey . Mathematically, we aim at maximizing the likelihood function . In addition, we impose a parameter normalization constraint for each position. It is added to the likelihood function with a Lagrange multiplier , resulting in a new log likelihood function:
By taking its partial derivatives to zero, it has been shown that . The MLE parameter definition is quite intuitive. It is simply the occurring fraction of a nucleotide at the same position. For example, given the previous SOX9 count matrix , we can convert it to a PFM as follows:
where a pseudocount = 1 is added to each element of .
We can observe that the most invariant positions of the SOX9 motif are the 4th and 6th position. At the 4th position, cytosines have been found most of the times while guanines and thymines have just been found few times.
Position Weight Matrix (PWM)
To scan a long sequence for motif matches using a PFM , we need to derive a PWM first so that the background distribution can be taken into account. As aforementioned, each element of PWM is a weight. Each weight can be viewed as a preference score. In practice, it is usually defined as the log likelihood ratio between the motif model and background model. Mathematically, where is the occurring fraction of the th nucleotide in all the background sequences such that, given a subsequence of the same width as the PWM (width ), we can compute a score by summation only:
| (1) | |||||
| (2) | |||||
| (3) | |||||
| (4) | |||||
| (5) |
where is the numeric index for the nucleotide at th position of the subsequence . For example, given the previous SOX9 PFM , we can convert it to a PWM as follows:
where we have assumed that the background distribution is uniform (i.e. for ) for illustration purposes.
Learning (Motif Discovery)
In general, motif discovery aims at building motif models (e.g. PFM) from related sequences. Nonetheless, there is a variety of motif discovery methods in different biological settings. From a computing perspective, they can be classified into several paradigms by its input data types:
-
1.
A Set of Sequences
-
2.
A Set of Sequences with Quantitative Measurements
-
3.
A Set of Orthologous Sequences
Motif Discovery for A Set of Sequences
The most classical one is de novo motif discovery which just takes a set of sequences as the inputs. The set of sequences is extracted such that a common transcription factor is believed to bind to them, assuming that motif models (e.g. consensus substrings) can be found from those sequences. For example, the promoter and enhancer sequences of the genes co-regulated by a common transcription factor or the sequence regions around the next generation parallel sequencing peaks called for a common transcription factor. Theoretically, Zia and Moses have proved a theoretical upper bound on the p-value which at least one motif with a specific information content occur by chance from background distribution (false positive) for the one-occurrence per sequence motif discovery problem pmid22738169 .
Chan et al. applied evolutionary computation techniques to the problem pmid18065426 ; kcwong:EASE . Hughes et al. proposed a Gibbs sampling algorithm called AlignACE, to sample and evaluate different possible motif models using a priori log likelihood scores pmid10698627 . Workman et al. have proposed a machine learning approach using artificial neural networks (ANN-Spec) pmid10902194 . Hertz et al. utilized the maximal information content principle to greedily search for a set of candidate sequences for building motif models (Consensus) pmid10487864 . Frith et al. have adopted simulated annealing approaches to perform multiple local alignment for motif model building (GLAM) pmid14704356 . Ao et al. have used expectation maximization to determine DNA motif position weight matrices (Improbizer) pmid15375261 . Bailey et al. have proposed MEME to optimize the expected value of a statistic related to the information content of motif models pmid7584439 . A parameter enumeration pipeline wrapping MEME (MUSI) was proposed for elucidating multiple specificity binding modes pmid22210894 . Eskin et al. employed a tree data structure to find composite weak motifs (MITRA) pmid12169566 . Thijs et al. have further improved the classic Gibbs sampling method and called it MotifSampler pmid11751219 . Van Helden et al. have proposed a counting algorithm to detect statistically significant motifs pmid9719638 . Regnier and Denise have proposed an exhaustive search algorithm (QuickScore) regnier04:_rare . Favorov et al. have utilized Markov Chain Monte Carlo to solve the problem in a Bayesian manner (SeSiMCMC) pmid15728117 . Pavesi et al. have proposed an exhaustively enumerated and consensus-based method (Weeder) pmid15215380 . Another exhaustive search algorithm to optimize z-scores (YMF) has been proposed by Sinha and Tompa pmid12824371 .
Although different statistical techniques have been developed for the motif discovery problem, most of the existing methods aim at building motif models in the form of either a set of strings or a zero-order PWM. Nonetheless, it is well known that nucleotide dependencies and indel operations exist within some TFBSs (a.k.a. motifs) pmid17308339 ; pmid18184687 . It is desirable to develop new methods which can capture and model such information.
Motif Discovery for A Set of Sequences with Quantitative Affinity Measurements
It has been pointed out that a fundamental bottleneck in TFBS identification is the lack of quantitative binding affinity data for a large portion of transcription factors. The advancement of new high-throughput technologies such as ChIP-Chip, ChIP-Seq, and Protein Binding Microarray (PBM) has made it possible to determine the binding affinity of these TFs (i.e. each sequence can be associated with a binding intensity value) pmid19443739 . In particular, the PBM technology can enable us to enumerate all the possible k-mers, providing an unprecedentedly high resolution binding site affinity landscape for each TF. In light of this deluge of quantitative affinity data, robust probabilistic methods were developed to take into account those quantitative affinity data. Seed and Wobble has been proposed as a seed-based approach using rank statistics pmid16998473 . RankMotif++ was proposed to maximize the log likelihood of their probabilistic model of binding preferences pmid17646348 . MatrixREDUCE was proposed to perform forward variable selections to minimize the sum of squared deviations pmid16317069 . MDScan was proposed to combine two search strategies together, namely word enumeration and position-specific weight matrix updating pmid12101404 . PREGO was proposed to maximize the Spearman rank correlation between the predicted and the actual binding intensities pmid16809671 . Notably, Wong et al. have proposed and developed a hidden Markov model approach to learn the dependence between adjacent nucleotide positions rigorously; they also show that their method (kmerHMM) can deduce multiple binding modes for a given TF pmid23814189 .
Note that this paradigm is a generalization from the motif discovery for a set of sequences with binary measurements. For example, SeedSearch Barash:2001:SHA:645906.673098 and DME pmid15668401 . In other words, it also includes the discriminative motif discovery method in which a set of motif-containing sequences and a set of background sequences are given as the input since we can assign a value of 1 to each motif-containing sequence and 0 to each background sequence.
Motif Discovery for A Set of Orthologous Sequences
It is generally acknowledged that by comparing evolutionarily related DNA or protein sequences, functionally important sequences or motifs can be revealed by such comparison. A functional motif is assumed to be more conserved across different species than the background sequences 15534694 . By incorporating the evolutionary conservation with sequence-specific DNA binding affinity, different methods have been proposed. Moses et al. have proposed an extension of MEME to take the sequence evolution into account probabilistically pmid14992514 . Kellis et al. have proposed a spaced hexamer enumeration approach to identify conserved motifs pmid15285895 . FootPrinter has been proposed as a substring-parsimony based approach using dynamic programming to find statistically enriched motif substrings pmid12015878 . A Gibbs sampling approach named PhyloGibbs has also been proposed pmid16477324 .
Prediction (Motif Search)
After a motif model has been found, it is always desirable to apply it to search for motif instances over a given sequence (e.g. ChIP-Seq peak sequences). Some basic search methods have been developed to search motif instances over a sequence. Nonetheless, those methods do not have sufficient motif model complexity to distinguish false positives from true positives over a long sequence (e.g. 100k bp) pmid15131651 . To cope with that, some improvements have been made. In general, most of them utilize the biological information beyond the motif sequence specificity to augment the motif model complexity insufficiency. In particular, multiple motif information and evolutionary conservation have been readily adopted to improve the discovery accuracy mosesSurvey .
Basic Searches
Likelihood Ratio
Given a sequence of length and a PWM of the motif of width , we scan with a window of width such that the subsequences which likelihood ratio score is higher than a pre-specified threshold are considered the instances (hits) of the motif . Mathematically, a subsequence is considered as a motif instance (hit) if and only if the following condition is satisfied:
where is the th nucleotide among {A,C,G,T} and is the Iverson bracket. Nonetheless, different motifs may have different likelihood score distributions. It is difficult to set a single and fixed threshold which can work for all the motifs. To solve the problem, one can normalize the score to the interval [0,1] based on the maximal and minimal scores as follows:
Posterior Ratio
If we know the prior probability of motif occurrence , it can also be incorporated into the scoring function in a posterior manner mosesSurvey . Mathematically, given a sequence , motif model (including PFM and PWM ), and background distribution , we can compute the posterior ratio as follows:
| (6) | |||||
| (7) | |||||
| (8) | |||||
| (9) | |||||
| (10) | |||||
| (11) |
It can be observed that the posterior ratio can be computed from the likelihood ratio by simply adding the logarithm of the prior probability ratio.
P-value
Given the previous scoring functions, it is not easy to set a threshold since they are just ratios. For example, if in the above example, it just means the likelihood that the sequence is generated by the motif model is higher than the background and vice versa. To justify it in a meaningful way, P-value distribution can be calculated from a motif model. Given a motif PWM of width , an exhaustive search can be applied to traverse all the possible sequences of width . Nonetheless, it takes time complexity for the DNA alphabet . Interestingly, if the PWM is of zero-order, we can exploit the column independence assumption and apply dynamic programming to calculate the exact P-value distribution in time complexity pmid2720468 . In practice, the empirical P-value distribution may also be used.
Nonetheless, the specificity of a PWM of width is still not high if it is applied to a very long sequence of length . Mathematically, even if we just assign the best match as the hit, hits are still expected (e.g. If and , hits are expected), assuming that the sequence is uniform in background nucleotide distribution. To solve the problem, people have spent efforts on incorporating more biological information to improve the motif search.
Incorporating Multiple Motif Information
To improve motif search, multiple motif information can be incorporated. Multiple motif sites are usually clustered together, resulting in higher signal-to-noise ratios which can be easier to be detected than alone. If multiple sites of the same motif are clustered together within a short distance, it is called homotypic clustering pmid12670999 . On the other hand, if multiple sites of different motifs are clustered together within a short distance, it is called heterotypic clustering.
To exploit the additional clustering signals beyond sequence specificity, MAST was proposed to multiply the P-values of multiple motif matches (hits) together, which has demonstrated superior performance in sequence homology search than the other two methods proposed in the same study pmid9672829 . CIS-ANALYST was proposed as a sliding window approach to predict the windows which have at least motif matches (hits) with pvalues pmid11805330 . Sinha et al. have proposed a probabilistic model, Stubb, to efficiently detect clusters of binding sites (i.e. cis-regulatory modules) over genomic scales using maximum likelihood estimation pmid16845069 . To determine the window size parameter, a window size adjustment procedure has been used in ClusterBuster to find clusters of motif matches pmid12824389 . Segal et al. have also derived an expectation maximization algorithm to model the clusters of motif matches as probabilistic graphical models pmid12855470 . Recently, Hermann et al. have proposed an integrative system (i-cisTarget) to combine the high-throughput next generation sequencing data with motif matches to provide accurate motif cluster search pmid22718975 . Notably, Zhou and Wong have shown that it is possible to search for clusters of motifs in a de novo way (i.e. without any given motif model and information) pmid15297614 .
Incorporating Evolutionary Conservation
Another approach to improve motif search is to incorporate evolutionary conservation. The rationale behind that is similar to that behind phylogenetic motif discovery which we have described in a previous section. Deleterious mutations will be removed from population by negative selection. To make use of that fact, we could imply that a true motif match should be more conserved across closely related species (For example, chimpanzee and mouse) than background sequences 15534694 . For instance, a windowing approach with several thresholds for motif matches and conservation, ConSite, was proposed by Sandelin et al. pmid15215389 . Nonetheless, it is limited to pair-wise analysis. rVISTA is a similar approach pmid16888351 using the Match program for motif matching in TRANSFAC TRANSFAC06 . Bayesian Branch Length Score (BBLS) was proposed as a evolutionary conservation score without relying on any multiple sequence alignment pmid19017655 . A parsimonious method for finding statistically significant k-mers with dynamic programming was proposed (FoorPrinter) pmid11997340 . Notably, Moses et al. proposed a comprehensive probabilistic model to search for motif instances with efficient p-value estimation (MONKEY) pmid15575972 .
To search for novel motif instances, there are programs aimed at searching for motif matches without any given motif model and information. For instance, Ovcharenko et al. have used likelihood ratio tests to distinguish conserved regions from the background pmid15173121 . Siepel et al. have demonstrated an approach in identifying conserved regions using hidden Markov models called PhastCons pmid16024819 .
Incorporating Both Approaches
Both motif clustering information and evolutionary conservation were demonstrated beneficial to motif search. Since they are independent of each other, it is straightforward to combine them. Philippakis et al. have proposed a method to combine both types of information (i.e. motif clustering and evolutionary conservation), achieving good performance on experimentally verified datasets pmid15759656 . MONKEY has been extended by Warner et al. to exploit the motif clustering information to predict motif clusters (PhylCRM) pmid18311145 . It has been reported that the misalignment errors of the input reference sequences from other species could affect the quality of phylogenetic footprinting for motif search. Thus statistical alignments have been used to assist motif search in EMMA pmid19293946 . Stub has also been extended to StubMS to take multiple species conservation into account using a HMM phylogenetic model pmid12855472 . Notably, a unified probabilistic framework which integrates multiple sequence alignment with binding site predictions, MORPH, was proposed by the same group pmid17997594 . Its effectiveness has been demonstrated and verified in an independent comparison study pmid21152003 .
2.2 Genome-wide DNA Binding Pattern Discovery
Chromatin immunoprecipitation (ChIP) followed by high-throughput sequencing (ChIP-Seq) measures the genome-wide occupancy of transcription factors in vivo. In a typical ChIP-Seq study, the first step is to call the peaks, i.e. determining the precise location in the genome where the TF binds. A number of peak calling tools have been developed; for instance, model-based analysis of ChIP-Seq data (MACS) was proposed to model the shift size of ChIP-Seq tags and local biases to improve its peak-calling accuracy pmid18798982 . Spp is another method with a strong focus on background signal correction pmid19029915 . PeakSeq is a two-pass strategy method. The first pass accounts for the sequence mappability while the second pass is to filter out statistically insignificant regions comparing to controls pmid19122651 . CisGenome refines peak boundaries and uses a conditional binomial model to identify peak regions pmid18978777 . However, recent benchmark studies suggest that their predicted peaks are distinct from each other pmid20628599 ; pmid20017957 .
Different combinations of DNA-binding protein occupancies may result in a gene being expressed in different tissues or at different developmental stages. To fully understand a gene’s function, it is essential to develop unsupervised learning models on multiple ChIP-Seq profiles to decipher the combinatorial regulatory mechanisms by multiple transcription factors.
Since multiple transcription factors often work in cis regulatory modules to confer complex gene regulatory programs, it is necessary to develop models on multiple ChIP-Seq datasets to decipher the combinatorial DNA-binding mechanism. In the following, we briefly review some of the previous works in this area. Gerstein et al. used pair-wise peak overlapping patterns to construct a human regulatory network pmid22955619 . Xie et al. proposed self organizing map methods to visualize the co-localization of DNA-binding proteins pmid24243024 . Giannopoulou et al. proposed a non-negative matrix factorization to elucidate the clustering of DNA-binding proteins pmid23554462 . Zeng and colleagues proposed jMOSAiCS to discover histone modification patterns across multiple ChIP-Seq datasets pmid23844871 . Ferguson et al. have described a hierarchical Bayes approach to integrate multiple ChIP-Seq libraries to improve DNA binding event predictions. In particular, they have applied the method to histone ChIP-Seq libraries and predicted the gene locations associated with the expected pathways ferguson2012new . Mahony et al. also proposed a mixture model (MultiGPS) to detect differential binding enrichment of a DNA-binding protein in different cell lines, which can improve the protein’s DNA binding location predictions (i.e. Cdx2 protein in their study) mahony2014integrated . On the other hand, Chen et al. proposed a statistical framework (MM-ChIP) based on MACS to perform an integrative analysis of multiple ChIP datasets to predict ChIP-enriched regions with known motifs for a given DNA-binding protein (i.e. ER and CTCF proteins in their study) chen2011mm . On the other hand, Ji et al. proposed a differential principal component analysis method on ChIP-Seq to perform unsupervised pattern discovery and statistical inference to identify differential protein-DNA interactions between two biological conditions ji2013differential . Guo et al. described a generative probabilistic model (GEM) for high resolution DNA binding site discovery from ChIP data guo2012high . Interestingly, that model combines ChIP signals and DNA motif discovery together to achieve precise predictions of the DNA binding locations of a DNA-binding protein. The authors have further demonstrated how GEM can be applied to reveal spatially constrained transcription factor binding site pairs on a genome.
Despite the success of the methods described above, to fully understand a gene’s function, it is essential to develop probabilistic models on multiple ChIP-Seq profiles to decipher the genome-wide combinatorial patterns of DNA-binding protein occupancy. Unfortunately, the majority of the previous work usually focused on large-scale clustering of called peaks, which is an intuitive and straightforward approach. However such approaches have two limitations, as (i) peak-calling ignores the contributions from weak bindings of TFs, and (ii) pair-wise analysis ignores the complex combinatorial binding pattern among the TFs. Thus an unsupervised learning model called SignalSpider has been proposed to directly analyze multiple normalized ChIP-Seq signal profiles on all the promoter and enhancer regions quantitatively so that weak bindings can be taken into account wong2014signalspider ; pmid22955978 . Especially, its computational complexity has been carefully designed to scale with the increasing ChIP-Seq data (i.e. linear complexity). With such a linear complexity, the method (SignalSpider) has been successfully applied to more than 100 ChIP-Seq profiles in an integrated way, revealing different genome-wide DNA-binding modules across the entire human genome (hg19) wong2014signalspider .
3 Unsupervised Learning for inferring microRNA regulatory network
While transcription factors (TFs) are the major transcriptional regulator proteins, microRNA (miRNA), a small 22 nucleotide noncoding RNA species, has been shown to play a crucial role in post-transcriptional and/or translational regulation Bartel:2009fh . Since the 1993 discovery of the first miRNA let-7 in worms, a vast amount of studies have been dedicated to functionally characterizing miRNAs with a special emphasis on their roles in cancer. While TFs can serve either as a transcriptional activator or as a repressor, miRNAs are primarily known to confer mRNA degradation and/or translational repression by forming imperfect base-pair with the target sites primarily at the 3′ untranslated regions of the messenger RNAs Guo:2010kh . While miRNAs are typically 22 nt long, several experimental studies combined with computational methods Lewis:2003uz ; Doench:2004ct ; Kiriakidou:2004kc ; Burgler:2005ge ; Lewis:2005cb ; Alexiou:2009jq ; Yue:2009jt have shown that only the first six or seven consecutive nucleotides starting at the second nucleotide from the 5′ end of the miRNA are the most crucial determinants for target site recognition (Figure 2). Accordingly, the 6mer or 7mer close to the 5′ region of the miRNA is termed as the “seed” region or seed. miRNAs that share common seeds belong to an miRNA family as they potentially target a vastly common set of mRNAs. Moreover, the target sites at the 3′UTR Watson-Crick (WC) pairing with the miRNA seed are preferentially more conserved within mammalian or among all of the vertebrate species Lewis:2003uz . In humans, more than one third of the genes harbour sites under selective pressure to maintain their pairing to the miRNA seeds Lewis:2003uz ; Grimson:2007cy . An important variation around this seed-target pairing scheme was discovered by Lewis et al. (2005), where the target site is flanked by a conserved adenosine ‘A’ facing to the first nucleotide of the targeting miRNA Lewis:2005cb .
The dynamics of the miRNA regulatory network are implicated in various phenotypic changes including embryonic development and many other complex diseases Song:2006hm ; Croce:2009ff . Although abnormal miRNA expression can sometimes be taken as a stronger indicator of carcinoma in clinical samples than aberrant mRNA expression Ramaswamy:2001hc ; Lu:2005hx , the system level mechanistic effects are usually unclear. A single miRNA can potentially target 400 distinct genes, and there are thousands of distinct endogenous miRNAs in the human genome. Thus, miRNAs are likely involved in virtually all biological processes and pathways including carcinogenesis. However, functional characterizing miRNAs hinges on the accurate identification of their mRNA targets, which has been a challenging problem due to imperfect base-pairing and condition-specific miRNA regulatory dynamics. In this section, we discuss the current state-of-art approaches in referring miRNA or miRNA-mediated transcriptional regulatory network. Table 1 summarizes these methods. As we will see, each method is established through an effective unsupervised learning model by exploiting the static sequence-based information pertinent to the prior knowledge of miRNA targeting and/or the dynamic information of miRNA activities implicated by the recently available large data compendia, which interrogate genome-wide expression profiles of miRNAs and/or mRNAs across various cell conditions.
| mRNA5[ORF] | |||
| Method | Algorithm | Section | Ref |
|---|---|---|---|
| PicTar | Hidden Markov Model | 3.1 | Krek:2005er |
| TargetScore | Variational Bayesian Mixture Model | 3.2 | Li:2013wk |
| GroupMiR | Nonparametric Bayesian with Indian Buffet Process | 3.3 | Le:2011wx |
| SNMNMF | Constrained nonnegative matrix factorization | 3.4 | Zhang:2011ce |
| Mirsynergy | Deterministic overlapping neighbourhood expansion | 3.5 | Li:2014fa |
PicTar: Probabilistic identification of combinations of Target sites; GroupMiR: Group MiRNA target prediction; SNMNMF: Sparse Network-regularized Multiple Nonnegative Matrix Factorization; PIMiM: Protein Interaction-based MicroRNA Modules.
3.1 PicTar
PicTar (Probabilistic identification of combinations of Target sites) is one of the few models that rigorously considers the combinatorial miRNA regulations on the same target 3′UTR Krek:2005er . As an overview, PicTar first pre-filters target sites by their conservation across select species. However, the fundamental framework of PicTar is based on hidden Markov model (HMM) with a maximum likelihood (ML) approach, which is built on the logics of several earlier works from Siggia group Durbin:1998wz ; Bussemaker:2000dl ; Sinha:2003ui ; Rajewsky:2002tt . Among these works, PicTar was most inspired by “Ahab”, an HMM-based program developed (by the same group) to predict the combinatorial TF binding sites (TFBS) Rajewsky:2002tt . Although PicTar has been successfully applied to three studies on vertebrates Krek:2005er (where the original methodology paper was described), fly Grun:2005ix , and worm Lall:2006hh (where some improvements were described), the description of the core HMM algorithm of PicTar is rather brief. Here we will lay out the detailed technicality of the algorithm based on the information collected from several related works Durbin:1998wz ; Bussemaker:2000dl ; Sinha:2003ui ; Rajewsky:2002tt ; MBishop:2006uc , which will help highlight its strengths, limitations, and possible future extensions.
Let be a 3′UTR sequence, the length of , and the target sites for miRNA “word” of length , the transition probability of the occurrence of miRNA , and the transition probability for the background of length , which is simply estimated from the fraction of A, U, G, C (i.e., Markov model of order 0) either in with length 300 nt or from all query UTRs. To simplify notation, the background letters are treated as a special word so that and . Thus, can be represented by multiple different ways of concatenating the segments corresponding to either miRNA target sites or background. The goal is to obtain at any arbitrary nucleotide position of the 3′UTR sequence the posterior probability that is the last position of the word, where is the model parameters controlling emission probabilities (see below).
Following Markov’s assumption, is proportional to the products of the probabilities before and after position , which can be computed in time by Forward-Backward algorithm as described below. Formally,
| (12) | ||||
| (13) | ||||
| (14) | ||||
| (15) |
where is the likelihood of sequence or the objective function to be maximized in the ML framework, and can be represented in recursion forms and computed via forward and backward algorithm, respectively in time for words. Formally, the forward algorithm is derived as follows:
| (16) | ||||
| (17) | ||||
| (18) | ||||
| (19) | ||||
| (20) | ||||
| (21) |
where is the emission probability assumed known (see below) and is the transition probability to word . Note that is position independent. To start the recursion, .
The backward algorithm is similarly derived:
| (22) | ||||
| (23) | ||||
| (24) | ||||
| (25) |
To start the backward recursion, , which is simply the frequency of word in the 3′UTR sequence .
Given the emission probabilities, ’s (transition probability) are the only parameters that need to be set in order to maximize . Following the ML solution,
| (26) |
where the posterior is calculated by Eq (15), which is in turn computed by forward-backward algorithm. Finally, the likelihood (objective) function is evaluated by a simple forward pass to the end of the sequence:
| (27) | ||||
| (28) |
Together, the optimization of in PicTar is performed using Baum-Welch algorithm for Expectation-Maximization (EM) as summarized in Algorithm 1. Finally, the PicTar score is defined as a log ratio () of the ML over background likelihood :
| (29) |
where is the likelihood when only background is considered.
As previously mentioned, the emission probabilities in PicTar are assumed known. In Ahab for modelling TFBS, or is based on the position frequency matrix (PFM): , where is the normalized frequency of the nucleotide at the position of the PFM. However, miRNAs do not have PFM. The original PicTar arbitrarily sets to be 0.8 if there is perfect seed-match at 1-7 or 2-8 nt positions of the miRNA 5′ end AND the free binding energy as estimated by RNAhybrid is no less than 33% of the optimal binding energy of the entire miRNA sequence to the UTR Lorenz:2011it ; otherwise is set to 0.2 divided by for imperfect seed matches with only 1 mismatch allowed, provided it is above 66% of the optimal binding energy. Thus, the setting highly disfavours imperfect seed match. The later version of PicTar changes the emission probability calculation to be the total number of occurrences in conserved 3′UTR sites divided by the total number of sites 3′UTR Lall:2006hh . The setting appears to improve the sensitive/specificity of the model but makes it more dependent on the cross-species conservation, potentially prone to false negatives (for the non-conserved but functional sites).
The major advantage of PicTar over other simpler methods is that the coordinate actions of the miRNAs (synergistic in case of optimally spaced sites or antagonistic in case of overlapping binding sites) are naturally captured within the emission and transition probabilities. For instance, the as the joint ML of multiple miRNA target sites will be higher than the linear sum of individual miRNA target sites (i.e., synergistic effects). Longer 3′UTR will score less than shorter 3′UTR if both contain the same number of target sites. PicTar demonstrated a comparable signal:noise ratio relative to TargetScan and was compared favourably with some of the earlier published methods based on several surveys Alexiou:2009jq ; Yue:2009jt ; Sethupathy:2006df ; Li:2013wk . When applied to vertebrates, PicTar identified roughly 200 genes per miRNA, which is a rather conservative estimate compared to the recent findings by TargetScan with a conserved targeting scoring approach Friedman:2009km . When applied to C. elegans (worm), PicTar identified 10% of the C. elegans genes that are under conserved miRNA regulation.
Nonetheless, PicTar has three important limitations. First, PicTar does not consider the correlation between miRNA target sites since is essentially position independent. This is perhaps largely due to the increased model complexity when considering all pairwise transition probabilities between miRNAs and background since there will be parameters to model (as apposed to only ). Supported by Grimson:2007cy , however, the specific spatial arrangement of the target sites may be functionally important. In particular, the optimal distance between miRNA sites was estimated as 8 to 40 nt based on transfection followed by regression analysis Grimson:2007cy . Although unsupported by experimental evidence, the ordering of some specific target sites may be also important. For instance, target site must be located before target site (for the same or different miRNA) to achieve optimal synergistic repression. The model that takes into account the spatial correlation between motifs is called the hcHMM (history conscious HMM) implemented in a program called Stubb for detecting TF binding sites (TFBS) rather than miRNA target predictions Sinha:2006bn .
Second, the ML approach is prone to local optimal especially for long UTRs or many coordinated miRNA actions considered simultaneously (i.e., many ’s). An alternative HMM formulation is to impose Bayesian priors on the HMM parameters MacKay97ensemblelearning . In particular, Wu:2008fq demonstrated such Bayesian formalism of HMM in modelling combinatorial TFBS. In their model so-called “module HMM”, the transition probabilities is assumed to follow a Dirichlet distribution with hyperparameters , where corresponds to the background, to the TFs, and to the background inside of cis-regulatory module. Inference is performed via Markov Chain Monte Carlo (MCMC) procedure or Gibbs sampling in particular. Briefly, a forward pass and backward pass are run to generate marginal probabilities at each nucleotide position. Starting at the end of the sequence, hidden states are sampled at each position based on the marginals until reaching the front of the sequence. Given the hidden states, the hyperparameters for Dirichlet distribution of the transition probabilities are then updated by simply counting the occurrences of each state. The posteriors of the hidden states at each nucleotide position are inferred as the averaged number of times the states are sampled in 1000 samplings, and the states with the maximum a posteriori (MAP) are chosen. The model is demonstrated to perform better than Ahab and Stubb (which are the basis for PicTar) in TFBS predictions but have not yet been adapted to miRNA target predictions.
Third, since data for expression profiling of mRNAs and miRNAs by microarrays or RNA-seq is now rather abundant (e.g., Babak:2004ec , GSE1738; GSE31568, Keller:2011jk ; GSE40499, Meunier:2012dv from GEO) or ENCODE (GSE24565, Djebali:2013hc ) or TCGA CancerGenomeAtlasResearchNetwork:2008gr ; Weinstein:2013jp , the combinatorial regulation needs to be revisited by taking into account whether or not the co-operative miRNAs are indeed expressed in vivo and/or the expression correlation between mRNA and miRNA. In particular, the emission probabilities need to be redefined to integrate both sequence-based and expression-based information.
3.2 A probabilistic approach to explore human miRNA target repertoire by integrating miRNA-overexpression data and sequence information
One of the most direct way to query the targets of a given miRNA is by transfecting the miRNA into a cell and examine the expression changes of the cognate target genes Lim:2005cd . Presumably, a bona fide target will exhibit decreased expression upon the miRNA transfection. In particular, overexpression of miRNA coupled with expression profiling of mRNA by either microarray or RNA-seq has proved to be a promising approach Lim:2005cd ; Arvey:2010ev . Consequently, genome-wide comparison of differential gene expression holds a new promise to elucidate the global impact of a specific miRNA regulation without solely relying on evolutionary conservation. However, miRNA transfection is prone to off-target effects. For instance, overexpressing a miRNA may not only repress the expression of its direct targets but also cause a cascading repression of in-direct targets of the affected transcription activators. To improve prediction accuracy for direct miRNA targets, this chapter describes a novel model called TargetScore that integrates expression change due to miRNA overexpression and sequence information such as context score Grimson:2007cy ; Garcia:2011ec and other orthogonal sequence-based features such as conservation Friedman:2009km into a probabilistic score.
In one of our recent papers, we described a novel probabilistic method for miRNA target prediction problem by integrating miRNA-overexpression data and sequence-based scores from other prediction methods Li:2013wk . Briefly, each score feature is considered as an independent observed variable, which is the input to a Variational Bayesian-Gaussian Mixture Model (VB-GMM). We chose a Bayesian over a maximum likelihood approach to avoid overfitting. Specifically, given expression fold-change (due to miRNA transfection), we use a three-component VB-GMM to infer down-regulated targets accounting for genes with little or positive fold-change (due to off-target effects Khan:2009ki ). Otherwise, two-component VB-GMM is applied to unsigned sequence scores. The parameters for the VB-GMM are optimized using Variational Bayesian Expectation-Maximization (VB-EM) algorithm. The mixture component with the largest absolute means of observed negative fold-change or sequence score is associated with miRNA targets and denoted as “target component”. The other components correspond to the “background component”. It follows that inferring miRNA-mRNA interactions is equivalent to inferring the posterior distribution of the target component given the observed variables. The targetScore is computed as the sigmoid-transformed fold-change weighted by the averaged posteriors of target components over all of the features.
Bayesian mixture model
Assuming there are genes, we denote as the expression fold-change () or sequence scores (). Thus, for sets of sequence scores, . To simplify the following equations, we use to represent one of the independent variables without loss of generality. To infer target genes for a miRNA given , we need to obtain the posterior distribution of the latent variable , where =3 (=2) for modelling signed (unsigned) scores such as logarithmic fold-changes (sequence scores).
We follow the standard Bayesian GMM based on MBishop:2006p485 (p474-482) with only minor modifications. Although univariate GMM () is applied to each variable separately, we implemented and describe the following formalism as a more general multivariate GMM, allowing modeling the covariance matrices. Briefly, the latent variables are sampled at probabilities (mixing coefficient), that follow a Dirichlet prior with hyperparameters . To account for the relative frequency of targets and non-targets for any miRNA, we set the (associated with the target component) to and other , where (by default). Assuming follows a Gaussian distribution , where (precision matrix) is the inverse covariance matrix, together follow a Gaussian-Wishart prior , where the hyperparameters .
Variational Bayesian Expectation Maximization
Let . The marginal log likelihood can be written in terms of lower bound (first term) and Kullback-Leibler divergence (second term):
| (30) |
where is a proposed distribution for , which does not have a closed form distribution. Because is a constant, maximizing implies minimizing . The general optimal solution is the expectation of variable w.r.t other variables, . In particular, we define . The expectations for the three terms (at log scale), namely , have the same forms as the initial distributions due to the conjugacy of the priors. However, they require evaluation of the parameters , which in turn all depend on the expectations of or the posterior of interest:
| (31) |
where . The inter-dependence between the expectations and model parameters falls naturally into an EM framework, namely VB-EM. Briefly, we first initialize the model parameters based on priors and randomly sample data points . At the iteration, we evaluate (31) using the model parameters (VB-E step) and update the model parameters using (31) (VB-M step). The EM iteration terminates when improves by less than (default). Please refer to MBishop:2006p485 for more details.
TargetScore
We define the targetScore as an integrative probabilistic score of a gene being a target (meaning that for the target component ) of a miRNA:
| (32) |
where , is the posterior in (31).
TargetScore demonstrates superior statistical power compared to existing methods in predicting validated miRNA targets in various human cell-lines. Moreover, the confidence targets from TargetScore exhibit comparable protein downregulation and are more significantly enriched for Gene Ontology terms. Using TargetScore, we explored oncomir-oncogenes network and predicted several potential cancer-related miRNA-messenger RNA interactions. TargetScore is available at Bioconductor http://www.bioconductor.org/packages/devel/bioc/html/TargetScore.html.
Network-based methods to detect miRNA regulatory modules
Although targets of individual miRNAs are significantly enriched for certain biological processes Papadopoulos:2009kt ; Tsang:2010jv , it is also likely that multiple miRNAs are coordinated together to synergistically regulate one or more pathways Krek:2005er ; Boross:2009gx ; Xu:2011kl . Indeed, despite their limited number (2578 mature miRNAs in human genome, miRBase V20, Kozomara:2014he ), miRNAs may be in charge of more evolutionarily robust and potent regulatory effects through coordinated collective actions. The hypothesis of miRNA synergism is also parsimonious or biologically plausible because the number of possible combinations of the 2578 human miRNAs is extremely large, enough to potentially react to virtually countless environmental changes. Intuitively, if a group of (miRNA) workers perform similar tasks together, then removing a single worker will not be as detrimental as assigning each worker a unique task Boross:2009gx .
Several related methods have been developed to study miRNA synergism. Some early methods were based on pairwise overlaps Shalgi:2007fe or score-specific correlation Xu:2011kl between predicted target sites of any given two (co-expressed) miRNAs. For instance, Shalgi et al. (2007) devised an overlapping scoring scheme to account for differential 3′UTR lengths of the miRNA targets, which may otherwise bias the results if standard hypergeometric test was used Shalgi:2007fe . Methods beyond pairwise overlaps have also been described. These methods considered not only the sequence-based miRNA-target site information but also the respective miRNA-mRNA expression correlation (MiMEC) across various conditions to detect miRNA regulatory modules (MiRMs).
For instance, Joung et al. (2007) developed a probabilistic search procedure to separately sample from the mRNA and miRNA pools candidate module members with probabilities proportional to their overall frequency of being chosen as the “fittest”, which was determined by their target sites and MiMEC relative to the counterparts Joung:2007kj . The algorithm found only the single best MiRM, which varied depending on the initial mRNA and miRNA set. Other network-based methods using either the sequence information only or using m/miRNA expression profiles only as a filter for a more disease-focused network construction on only the differentially expressed (DE) m/miRNAs. For instance, Peng et al.(2006) employed an enumeration approach to search for maximal bi-clique on DE m/miRNAs to discover complete bipartite subgraphs, where every miRNA is connected with every mRNA Peng:2009js . The approach operated on unweighted edges only, which required discretizing miRNA-mRNA expression correlation. Also, maximal bi-clique does not necessarily imply functional MiRMs and vice versa.
The following subsections review in details three recently developed network methods (Table 1) to detect MiRMs. Despite distinct unsupervised learning frameworks, all three methods exploit the widely available paired m/miRNA expression profiles to improve upon the accuracy of earlier developed (sequence-based) network approaches.
3.3 GroupMiR: inferring miRNA and mRNA group memberships with Indian Buffet Process
The expression-based methods reviewed elsewhere Yue:2009jt were essentially designed to explain the expression of each mRNA in isolation using a subset of the miRNA expression in a linear model with a fixed set of parameters. However, the same mRNAs (miRNAs) may interact with different sets of miRNAs (mRNAs) in different pathways. The exact number of pathways is unknown and may grow with an increase of size or quality of the training data. Thus, it is more natural to infer the number of common features shared among different groups of miRNAs and mRNAs. Accordingly, Le et al. (2011) proposed a powerful alternative model called GroupMiR (Group MiRNA target prediction) Le:2011wx . As an overview, GroupMiR first explored the latent binary features or memberships possessed within mRNAs, miRNAs, or shared between mRNAs and miRNAs on a potentially infinite binary feature space empowered by a nonparametric Bayesian (NBP) formalism. Thus, the number of features was inferred rather than determined arbitrarily. Importantly, the feature assignment took into account the prior information for miRNA and mRNA targeting relationships, obtained from sequence-based target prediction tools such as TargetScan or PicTar. Based on the shared memberships, mRNAs and/or miRNAs formed groups (or clubs). The same miRNAs (mRNAs) could possess multiple memberships and thus belong to multiple groups each corresponding to a latent feature. This was also biologically plausible since a miRNA (mRNA) may participate in several biological processes. Similar to GenMiR++ Huang:2007em , GroupMiR then performed a Bayesian linear regression on each mRNA expression using all miRNA expression but placing more weight on the expression of miRNAs that shared one or more common features with that mRNA.
Specifically, the framework of GroupMiR was based on a recently developed general nonparametric Bayesian prior called the Indian Buffet Process (IBP) Griffiths:2005tp (which was later on proved to be equivalent to Beta process Thibaux:2007wn ). As the name suggests, IBP can be understood from an analogy of a type of an ‘Indian buffet’ as follows. A finite number of customers or objects form a line to enter one after another a buffet comprised of dishes or features. Each customer samples dishes selected by previous customers, and Poisson() new dishes, where is a model parameter. The choices of customers on the dishes are expressed in an binary matrix . A left-order function maps a binary matrix to a left-ordered binary matrix with columns (i.e., dishes) sorted from left to right by decreasing order of and breaking ties in favour of customers who enter the buffet earlier. This process defines an exchangeable distribution on equivalence class comprising all of the that have the same left-ordered binary matrix regardless of the order the customers enter the buffet (i.e., row order) or the dish order (i.e., column order).
Before reviewing the IBP derivation, we need to establish some notations Griffiths:2005tp . () denotes the history of feature at object , which is encoded by a single decimal number. At object , for instance, a feature has one of four histories encoded by corresponding to all of the four possible permutations of choices for objects 1 and 2: . Accordingly, for objects, there are histories for each feature and histories excluding the history of all zeros (i.e., ). Additionally, denotes the number of features possessing the same history , for all features with , and for all features for which . Thus, . It is easy to see that binary matrices belong to an equivalence class if and only if they have the same history profile for each feature . The cardinality () of an equivalence class is the number of all of the binary matrices with the same history profile:
| (33) |
As shown below, Eq (33) is essential in order to establish the close-formed solution of IBP prior when leads to an infinite feature space or infinite number of columns in . After establishing the above properties, the central steps in deriving the IBP prior used in GroupMiR is reviewed below. I will focus on some steps neglected from the original work and refer the reader to the full derivation when appropriate. As in the original papers, we first derive IBP on a finite number of latent features and then take the limit making use of Eq (33).
Let be an binary matrix, where for mRNAs and miRNAs, and is the number of latent features. Assuming the binary value in for each feature is sampled from and are conditionally independent given , the joint distribution of is then:
| (34) |
where follows a Beta prior with :
| (35) |
where is a Beta function. To take into account the prior information between miRNA and mRNA targeting from sequence-based predictions, GroupMiR incorporated in Eq (35) an weight matrix :
| (36) |
where interaction within mRNAs and within miRNAs were set to zeros and interaction between mRNA and miRNA followed the scoring matrix obtained from a quantitative sequence-based predictions. In particular, MiRanda scores were used in their paper. Thus, is either 0 or defined as a pairwise potential of interactions between mRNA and miRNA . The modified was then defined as:
| (37) |
where and the partition function were defined as:
| (38) | ||||
| (39) |
The marginal probability of is derived by integrating out as follows:
| (40) | ||||
| (41) | ||||
| (42) | ||||
| (43) | ||||
| (44) | ||||
| (45) |
where in Eq (43) is the sum over all , and (45) directly follows the definition of Beta function. However, when since the probability of sampling a specific binary matrix from an infinite number of matrices is 0. Instead, the inference was performed over the equivalence class with the number of -equivalent matrices defined above:
| (46) | |||||
| (47) | |||||
| (48) | |||||
where
| (49) |
A more elaborate derivation of (48) was described in the Appendix from Le:2011wx and omitted here. Additionally, the authors also showed that when or equivalently for all histories , then Eq (48) reduces to the original IBP introduced in Griffiths:2005tp , which is thus a special case of the weighted IBP in GroupMiR.
Given the IBP prior Eq (48), the generative process for corresponding to an existing feature (where ) was derived as follows:
| (50) | ||||
| (51) | ||||
| (52) | ||||
where the subscript (e.g., or ) denotes all objects for except for , Eq (51) arose from cancellations of the common terms in (48), and similar for (LABEL:background:ibp:z2). The number of new feature (where ) are sampled from Poisson().
Notably, can be expressed as , where is a binary matrix for mRNA and is a binary matrix for miRNA. Thus, mRNA and miRNA are in the same group if . Given and , the regression model in GroupMiR was defined as:
| (53) |
where is the expression of mRNA , is the baseline expression for , is the regulatory weight of miRNA , is a group-specific coefficient for group , and is the expression of miRNA . With the Gaussian distribution assumption for , the data likelihood then follows as:
| (54) |
where and . The (conjugate) priors over the parameters in were defined and omitted here.
Finally, the marginal posterior of are defined as:
| (55) |
where was obtained by integrating the likelihood (Eq (54)) over all parameters in and from Eq (50).
Due to the integral involved above, analytical solution for posterior in (55) is difficult to obtain. Accordingly, the inference in GroupMiR was performed via MCMC:
-
1.
Sample an existing column from Eq (50);
-
2.
Assuming object is the last customer in line (i.e., ), sample Poisson() new columns and sample from its prior (Gamma distribution) for each new column;
-
3.
Sample the remaining parameters by Gibbs sampler if closed-form posterior of the parameter exists (due to conjugacy) or by Metropolis-Hasting using likelihood Eq (54) to determine the acceptance ratio;
-
4.
Repeat 1-3 until convergence.
Finally, the posteriors of in Eq (55) for all feature column with at least one nonzero entry serve as the target prediction of GroupMiR.
GroupMiR was applied to simulated data generated from Eq (53) with (i.e., 5 latent features shared among miRNA and mRNA) and increasing noise level (0.1, 0.2, 0.4, 0.8) to the prior scoring matrix , mimicking the high false positive and negative rates from the sequence-based predictors. At the low noise levels of 0.1, 0.2, or 0.4, GroupMiR was able to identify exactly 5 latent features and above 90% accuracy in predicting the correct memberships between miRNA and mRNA. At the high noise level of 0.8, on the other hand, GroupMiR started to identify latent features but the accuracy remained above 90%, demonstrating its robustness. In contrast, GenMiR++ had much a lower performance than GroupMiR on the same data, scoring lower than 60% accuracy at the high noise level. GroupMiR was also applied to the real microarray data with 7 time points profiling the expression of miRNA and mRNA in mouse lung development. However, only the top 10% of the genes with highest variance were chosen leading to 219 miRNAs and 1498 mRNAs. Although the authors did not justify using such a small subset of the data, it is likely due to the model complexity that prohibited the full exploration of the data. Nonetheless, GroupMiR identified higher network connectivity and higher GO enrichment for the predicted targets than GenMiR++ on the same dataset. It would have been even more convincing, however, if GroupMiR was also tested on the same datasets of 88 human tissues, which were used in the GenMiR++ study Huang:2007em .
Although the time complexity was not analyzed for GroupMiR, it appears similar to, if not higher, than the general IBP, which has a time complexity of per iteration for objects DoshiVelez:2009uc . The slow mixing rate is the main issue for IBP-based framework due to the intensive Gibbs samplings required to perform the inference, which prevented GroupMiR from fully exploring the data space at a genome scale offered by microarray or RNA-seq platforms, and consequently compromised the model accuracy. Adaptations of efficient inference algorithms that were recently developed for IBP are crucial to unleash the full power of the NPB framework DoshiVelez:2009uc . Additionally, GroupMiR did not consider the spatial relationships between adjacent target sites of the same mRNA 3′UTR for the same or different miRNAs as in PicTar (Section 3.1). A more biologically meaningful (IBP) prior may improve the accuracy and/or the model efficiency by restricting the possible connections in . Finally, it would be interesting to further examine the biological revelation of the groupings from on various expression consortia. In particular, miRNAs participating in many groups or having higher out-degrees in network context are likely to be more functionally important than others. Moreover, the groupings may not only reveal miRNA and mRNA targeting relationships but also the regulatory roles of mRNAs as TFs on miRNA when a modified IBP prior is used. Taken together, many directions remained unexplored with the powerful NBP framework.
3.4 SNMNMF: sparse network-regularized multiple nonnegative matrix factorization
The nonnegative matrix factorization (NMF) algorithm was originally developed to extract latent features from images Lee:1999gw ; wang2013multiple . NMF serves as an attractive alternative to conventional dimensionality reduction techniques such as Principle Component Analysis (PCA) because it factorizes the original matrix (for images and pixels) into two non-negative matrices , where and are the “image encoding” and “basis image” matrices, respectively111In the original paper Lee:1999gw , the image matrix was transposed, where the rows and columns represent the pixel and image, respectively. The representation used here is to be consistent with the one used by Zhang:2011ce reviewed below.. Notably, needs to be known beforehand. The non-negativity of the two factorized matrices enforced by the NMF algorithm provides the ground for intuitive interpretations of the latent features because the factorized matrices tend to be sparse and reflective to certain distinct local features of the original image matrix. Kim and Tidor (2003) were among the very first groups that introduced NMF into the world of computational biology Kim:2003hd . In particular, the authors used NMF to assign memberships to genes based on the “image encoding” matrix in order to decipher yeast expression network using gene expression data measured by microarray. Since then, many NMF-based frameworks were developed Devarajan:2008df .
In particular, Zhang et al. (2011) extended the NMF algorithm to detecting miRNA regulatory modules (MiRMs) Zhang:2011ce . Specifically, the authors proposed a sparse network-regularized multiple NMF (SNMNMF) technique to minimize the following objective function:
| (56) |
where
-
•
and are the mRNA and miRNA expression matrices, respectively, for samples, mRNAs, and miRNAs;
-
•
is the encoding matrix using latent features (chosen based on the number of spatially separable miRNA clusters in the human genome);
-
•
and are the and “image basis” matrices for genes and miRNAs, respectively;
-
•
is the binary gene-gene interactions matrices as a union of the transcription factor binding sites (TFBS) from TRANSFAC Wingender:2000tk and the protein-protein interactions from Bossi:2009go ;
-
•
is the binary miRNA-mRNA interaction matrix obtained from MicroCosm GriffithsJones:2008kb database that hosts the target predictions from MiRanda John:2004ii ;
-
•
are regularization terms that prevent the parameter estimates from growing too large;
-
•
the weights and regularization parameters were selected post hoc.
The original optimization algorithm of NMF was based on a simple gradient decent procedure, which operated on only a single input matrix. Here, however, the partial derivative of Eq (56) with respect to each matrix () depends on the optimal solution from the other two matrices. Accordingly, the authors developed a two-stage heuristic approach, which nonetheless guarantees to converge to a local optimal: (1) update fixing (which are initialized randomly); (2) update fixing , repeat 1 & 2 until convergence. To cluster m/miRNAs, the authors exploited the encoding matrices and by transforming each entry into z-score: , where and are the mean and standard deviation of column of (or ) for mRNA (or miRNA ), respectively. Thus, each m/miRNA was assigned to zero or more features if their corresponding z-score is above a threshold.
SNMNMF was applied to ovarian cancer dataset containing paired m/miRNA expression profiles from TCGA measuring 559 miRNAs and 12456 genes for each of the 385 patient samples. The authors found that more than half of the 49 modules (1 module was empty) identified by SNMNMF were enriched for at least one GO terms or KEGG pathway. Also, miRNAs involved in the SNMNMF-MiRMs were enriched for cancer-related miRNAs. Moreover, Kaplan-Meier survival analysis revealed that some of the latent features from the basis matrix offerred promising prognostic power. Finally, SNMNMF compared favourably with the enumeration of bi-clique (EBC) algorithm proposed by Peng et al. (2009) in terms of the number of miRNAs involved in the modules and GO/pathway enrichments Peng:2009js . Specifically, the authors found that EBC tended to produce modules involving only a single miRNA and multiple mRNAs. The star-shape modules are instances of a trivial case that can be derived directly from miRNA-mRNA interaction scores rather than network analysis.
Despite the statistical rigor, there are several limitations of the SNMNMF algorithm. First, the NMF approach requires a predefined number of modules in order to perform the matrix factorization, which may be data-dependent and difficult to determine beforehand. Additionally, the NMF solution is often not unique, and the identified modules do not necessarily include both miRNAs and mRNAs, which makes reproducing and interpreting the results difficult. Moreover, the SNMNMF does not enforce negative MMEC (miRNA-mRNA expression correlation), whereas the negative MMEC is necessary to ascertain the repressive function of the miRNAs on the mRNAs within the MiRMs. Finally, SNMNMF incurs a high time complexity of for iterations, modules, samples, miRNAs, and mRNAs. Because is usually large (e.g., 12456 genes in the ovarian cancer dataset), the computation is expensive even for a small number of iterations or modules. Thus, an intuitively simple and efficient deterministic framework may serve as an attractive alternative, which we describe next.
3.5 Mirsynergy: detecting synergistic miRNA regulatory modules by overlapping neighbourhood expansion
In one of our recent works, we described a novel model called Mirsynergy that integrates m/miRNA expression profiles, target site information, and gene-gene interactions (GGI) to form MiRMs, where an m/miRNA may participate in multiple MiRMs, and the module number is systematically determined given the predefined model parameters Li:2014fa . The clustering algorithm of Mirsynergy adapts from ClusterONE Nepusz:2012cm , which was intended to identify protein complex from PPI data. The ultimate goal here however is to construct apriori the MiRMs and exploit them to better explain clinical outcomes such as patient survival rate.
We formulate the construction of synergistic miRNA regulatory modules (MiRMs) as an overlapping clustering problem with two main stages. Prior to the two clustering stages, we first inferred miRNA-mRNA interaction weights (MMIW) () using m/miRNA expression data and target site information. At stage 1, we only cluster miRNAs to greedily maximize miRNA-miRNA synergy, which is proportional to the correlation between miRNAs in terms of their MMIW. At stage 2, we fix the MiRM assignments and greedily add (remove) genes to (from) each MiRM to maximize the synergy score, which is defined as a function of the MMIW matrix and the gene-gene interaction weight (GGIW) matrix ().
Two-stage clustering
Let denote the expression-based MMIW matrix obtained from the coefficients of a linear regression model such as LASSO, determined as the best performing target prediction model on our data, where is the scoring weight for miRNA targeting mRNA . Similar to the “Meet/Min” score defined by Shalgi:2007fe for binary interactions of co-occurring targets of miRNA pairs, we define an scoring matrix denoted as , indicating miRNA-miRNA synergistic scores between miRNA and ():
| (57) |
Notably, if were a binary matrix, Eq 57 became the ratio of number of targets shared between miRNA and over the minimum number of targets possessed by or , which is essentially the original “Meet/Min” score. We chose such scoring system to strictly reflect the overlapping between the two miRNA target repertoires rather than merely correlated trends as usually intended by alternative approaches such as Pearson correlation.
Similar to the cohesiveness defined by Nepusz:2012cm , we define synergy score for any given MiRM as follows. Let denote the total weights of the internal edges within the miRNA cluster, the total weights of the boundary edges connecting the miRNAs within to the miRNAs outside , and the penalty scores for forming cluster . The synergy of (i.e., the objective function) is:
| (58) |
where reflects our limited knowledge on potential unknown targets of the added miRNA as well as the false positive targets within the cluster. Presumably, these unknown factors will affect our decision on whether miRNA belong to cluster . For instance, miRNA may target noncoding RNAs and seedless targets, which are the mRNAs with no perfect seed-match Helwak:2013ga . We considered only mRNA targets with seed-match to minimize the number of false positives. By default, we set , where is the cardinality of . Additionally, we define two scoring functions to assess the overlap between and for and the density of any given :
| (59) | ||||
| (60) |
where is the total number of common elements in and , and is the number of miRNAs in .
The general solution for solving an overlapping clustering problems is NP-hard barthelemy2001np . Thus, we adapt a greedy-based approach Nepusz:2012cm . The algorithm can be divided into two major steps. In step 1, we select as an initial seed miRNA with the highest total weights. We then grow an MiRM from seed by iteratively including boundary or excluding internal miRNAs to maximize the synergy (Eq 58) until no more node can be added or removed to improve . We then pick another miRNA that has neither been considered as seed nor included in any previously expanded to form . The entire process terminates when all of the miRNAs are considered. In step 2, we treat the clusters as a graph with as nodes and as edges. Here is a free parameter. Empirically, we observed that most MiRMs are quite distinct from one another in terms of (before the merging). Accordingly, we set to 0.8 to ensure merging only very similar MiRMs, which avoids producing very large MiRMs (when is too small). We then perform a breath-first search to find all of the weakly connected components (CC), each containing clusters that can reach directly/indirectly to one another within the CC. We merge all of the clusters in the same CC and update the synergy score accordingly.
After forming MiRMs at stage 1, we perform a similar clustering procedure by adding (removing) only the mRNAs to (from) each MiRM. Different from stage 1, however, we grow each existing MiRM separately with no prioritized seed selection or cluster merging, which allows us to implement a parallel computation by taking advantage of the multicore processors in the modern computers. In growing/contracting each MiRM, we maximize the same synergy function (Eq 58) but changing the edge weight matrix from to a matrix by combining (the MMIW matrix) and (the GGIW matrix). Notably, here we assume miRNA-miRNA edges to be zero. Additionally, we do not add/remove miRNAs to/from the MiRM at each greedy step at this stage. Finally, we define a new density function due to the connectivity change at stage 2:
| (61) |
where () are the number of mRNAs (miRNAs) in the . By default, we filter out MiRMs with and at stage 1 and 2, respectively. Both density thresholds were chosen based on our empirical analyses. For some datasets, in particular, we found that our greedy approach tends to produce a very large cluster involving several hundred miRNAs or several thousand mRNAs at Stage 1 or 2, respectively, which are unlikely to be biologically meaningful. Despite the ever increasing synergy (by definition), however, the anomaly modules all have very low density scores, which allows us to filter them out using the above-chosen thresholds.
Notably, standard clustering methods such as -means or hierarchical clustering are not suitable for constructing MiRMs since these methods assign each data point to a unique cluster pmid23157331 . A recently developed greedy-based clustering method ClusterONE is more realistic because it allows overlap between clusters Nepusz:2012cm . However, ClusterONE was developed with physical PPI in mind. Mirsynergy extends from ClusterONE to detecting MiRMs. The novelty of our approach resides in a two-stage clustering strategy with each stage maximizing a synergy score as a function of either the miRNA-miRNA synergistic co-regulation or miRNA-mRNA/gene-gene interactions. Several methods have incorporated GGI as PPI and TFBS into predicting MiRMs Zhang:2011ce ; Le:2013hj , which proved to be a more accurate approach than using miRNA-mRNA alone. Comparing with recent methods such as SNMNMF Zhang:2011ce and PIMiM Le:2013hj , however, an advantage of our deterministic formalism is the automatic determination of module number (given the predefined thresholds to merge and filter low quality clusters) and efficient computation with the theoretical bound reduced from per iteration to only for () mRNA (miRNA) across samples. Because is usually much larger than and , our algorithm runs orders faster. Based on our tests on a linux server, Mirsynergy took about 2 hours including the run time for LASSO to compute OV (=12456; =559; =385), BRCA or THCA (=13306; =710; =331 or 543, respectively), whereas SNMNMF took more than a day for each dataset. Using expression data for ovarian, breast, and thyroid cancer from TCGA, we compared Mirsynergy with internal controls and existing methods including SNMNMF reviewed above. Mirsynergy-MiRMs exhibit significantly higher functional enrichment and more coherent miRNA-mRNA expression anti-correlation. Based on the Kaplan-Meier survival analysis, we proposed several prognostically promising MiRMs and envisioned their utility in cancer research. Mirsynergy is available as an R/Bioconductor package at http://www.bioconductor.org/packages/release/bioc/html/Mirsynergy.html.
The success of our model is likely attributable to its ability to explicitly leverage two types of information at each clustering stage: (1) the miRNA-miRNA synergism based on the correlation of the inferred miRNA target score profiles from MMIW matrix; (2) the combinatorial miRNA regulatory effects on existing genetic network, implicated in the combined MMIW and GGIW matrices. We also explored other model formulations such as clustering m/miRNAs in a single clustering stage or using different MMIW matrices other than the one produced from LASSO, which tends to produce MiRMs each containing only one or a few miRNAs or several very large low quality MiRMs, which were then filtered out by the density threshold in either clustering stage. Notably, an MiRM containing only a single miRNA can be directly derived from the MMIW without any clustering approach. Moreover, Mirsynergy considers only neighbour nodes with nonzero edges. Thus, our model works the best on a sparse MMIW matrix such as the outputs from LASSO, which is the best performing expression-based methods based on our comparison with other alternatives. Nonetheless, the performance of Mirsynergy is sensitive to the quality of MMIW and GGIW. In this regard, other MMIW or GGIW matrices (generated from improved methods) can be easily incorporated into Mirsynergy as the function parameters by the users of the Bioconductor package (please refer to the package vignette for more details). In conclusion, with large amount of m/miRNA expression data becoming available, we believe that Mirsynergy will serve as a powerful tool for analyzing condition-specific miRNA regulatory networks.
References
- (1) Abecasis, G.R., Auton, A., Brooks, L.D., DePristo, M.A., Durbin, R.M., et al.: An integrated map of genetic variation from 1,092 human genomes. Nature 491(7422), 56–65 (2012)
- (2) Abeel, T., Van de Peer, Y., Saeys, Y.: Toward a gold standard for promoter prediction evaluation. Bioinformatics 25(12), i313–i320 (2009). DOI http://dx.doi.org/10.1093/bioinformatics/btp191
- (3) Alexiou, P., Maragkakis, M., Papadopoulos, G.L., Reczko, M., Hatzigeorgiou, A.G.: Lost in translation: an assessment and perspective for computational microRNA target identification. Bioinformatics (Oxford, England) 25(23), 3049–3055 (2009)
- (4) Altschul, S.F., Gish, W., Miller, W., Myers, E.W., Lipman, D.J.: Basic local alignment search tool. Journal of molecular biology 215(3), 403–410 (1990). DOI 10.1006/jmbi.1990.9999. URL http://dx.doi.org/10.1006/jmbi.1990.9999
- (5) Ao, W., Gaudet, J., Kent, W.J., Muttumu, S., Mango, S.E.: Environmentally induced foregut remodeling by PHA-4/FoxA and DAF-12/NHR. Science 305, 1743–1746 (2004)
- (6) Arvey, A., Larsson, E., Sander, C., Leslie, C.S., Marks, D.S.: Target mRNA abundance dilutes microRNA and siRNA activity. Molecular systems biology 6, 1–7 (2010)
- (7) Babak, T., Zhang, W., Morris, Q., Blencowe, B.J., Hughes, T.R.: Probing microRNAs with microarrays: tissue specificity and functional inference. RNA (New York, N.Y.) 10(11), 1813–1819 (2004)
- (8) Badis, G., Berger, M.F., Philippakis, A.A., Talukder, S., Gehrke, A.R., Jaeger, S.A., Chan, E.T., Metzler, G., Vedenko, A., Chen, X., Kuznetsov, H., Wang, C.F., Coburn, D., Newburger, D.E., Morris, Q., Hughes, T.R., Bulyk, M.L.: Diversity and complexity in DNA recognition by transcription factors. Science 324(5935), 1720–1723 (2009)
- (9) Bailey, T.L., Elkan, C.: The value of prior knowledge in discovering motifs with MEME. Proc Int Conf Intell Syst Mol Biol 3, 21–29 (1995)
- (10) Bailey, T.L., Gribskov, M.: Methods and statistics for combining motif match scores. J. Comput. Biol. 5(2), 211–221 (1998)
- (11) Barash, Y., Bejerano, G., Friedman, N.: A simple hyper-geometric approach for discovering putative transcription factor binding sites. In: Proceedings of the First International Workshop on Algorithms in Bioinformatics, WABI ’01, pp. 278–293. Springer-Verlag, London, UK, UK (2001). URL http://dl.acm.org/citation.cfm?id=645906.673098
- (12) Bartel, D.P.: MicroRNAs: Target Recognition and Regulatory Functions. Cell 136(2), 215–233 (2009)
- (13) Barthélemy, J.P., Brucker, F.: Np-hard approximation problems in overlapping clustering. Journal of classification 18(2), 159–183 (2001)
- (14) Bateman, A., Coin, L., Durbin, R., Finn, R.D., Hollich, V., GrifRths-Jones, S., Khanna, A., Marshall, M., Moxon, S., Sonnhammer, E.L.L., Studholme, D.J., Yeats, C., Eddy, S.R.: The pfam protein families database. Nucleic Acids Res 32, D138–141 (2004)
- (15) Berg, O.G., von Hippel, P.H.: Selection of DNA binding sites by regulatory proteins. Statistical-mechanical theory and application to operators and promoters. J. Mol. Biol. 193(4), 723–750 (1987)
- (16) Berger, M.F., Philippakis, A.A., Qureshi, A.M., He, F.S., Estep, P.W., Bulyk, M.L.: Compact, universal DNA microarrays to comprehensively determine transcription-factor binding site specificities. Nat. Biotechnol. 24, 1429–1435 (2006)
- (17) Berman, B.P., Nibu, Y., Pfeiffer, B.D., Tomancak, P., Celniker, S.E., Levine, M., Rubin, G.M., Eisen, M.B.: Exploiting transcription factor binding site clustering to identify cis-regulatory modules involved in pattern formation in the Drosophila genome. Proc. Natl. Acad. Sci. U.S.A. 99(2), 757–762 (2002)
- (18) Bishop, C.: Pattern recognition and machine learning. No. 605–631 in Information Science and Statisitcs. Springer Science, New York, NY, USA (2006)
- (19) Bishop, C.M.: Pattern recognition and machine learning. Springer, Information Science and Statistics. NY, USA (2006)
- (20) Blanchette, M., Schwikowski, B., Tompa, M.: Algorithms for phylogenetic footprinting. J. Comput. Biol. 9(2), 211–223 (2002)
- (21) Blanchette, M., Tompa, M.: Discovery of regulatory elements by a computational method for phylogenetic footprinting. Genome Res. 12(5), 739–748 (2002)
- (22) de Boer, C.G., Hughes, T.R.: YeTFaSCo: a database of evaluated yeast transcription factor sequence specificities. Nucleic Acids Res. 40(Database issue), D169–179 (2012)
- (23) Boross, G., Orosz, K., Farkas, I.J.: Human microRNAs co-silence in well-separated groups and have different predicted essentialities. Bioinformatics (Oxford, England) 25(8), 1063–1069 (2009)
- (24) Bossi, A., Lehner, B.: Tissue specificity and the human protein interaction network. Molecular systems biology 5, 260 (2009)
- (25) Burgler, C., Macdonald, P.M.: Prediction and verification of microRNA targets by MovingTargets, a highly adaptable prediction method. BMC Genomics 6, 88 (2005)
- (26) Bussemaker, H.J., Li, H., Siggia, E.D.: Building a dictionary for genomes: identification of presumptive regulatory sites by statistical analysis. Proceedings of the National Academy of Sciences of the United States of America 97(18), 10,096–10,100 (2000)
- (27) Cancer Genome Atlas Research Network: Comprehensive genomic characterization defines human glioblastoma genes and core pathways. Nature 455(7216), 1061–1068 (2008)
- (28) Chan, T.M., Leung, K.S., Lee, K.H.: TFBS identification based on genetic algorithm with combined representations and adaptive post-processing. Bioinformatics 24, 341–349 (2008)
- (29) Chen, X., Hughes, T.R., Morris, Q.: RankMotif++: a motif-search algorithm that accounts for relative ranks of K-mers in binding transcription factors. Bioinformatics 23, i72–79 (2007)
- (30) Chen, Y., Meyer, C.A., Liu, T., Li, W., Liu, J.S., Liu, X.S.: Mm-chip enables integrative analysis of cross-platform and between-laboratory chip-chip or chip-seq data. Genome Biol 12(2), R11 (2011)
- (31) Cheng, C., Alexander, R., Min, R., Leng, J., Yip, K.Y., Rozowsky, J., Yan, K.K., Dong, X., Djebali, S., Ruan, Y., Davis, C.A., Carninci, P., Lassman, T., Gingeras, T.R., Guigo, R., Birney, E., Weng, Z., Snyder, M., Gerstein, M.: Understanding transcriptional regulation by integrative analysis of transcription factor binding data. Genome Res. 22(9), 1658–1667 (2012)
- (32) Consortium, I.H.G.S.: Finishing the euchromatic sequence of the human genome. Nature 431(7011), 931–945 (2004)
- (33) Croce, C.M.: Causes and consequences of microRNA dysregulation in cancer. Nature reviews. Genetics 10(10), 704–714 (2009)
- (34) Devarajan, K.: Nonnegative Matrix Factorization: An Analytical and Interpretive Tool in Computational Biology. PLoS Computational Biology 4(7), e1000,029 (2008)
- (35) D’Haeseleer, P., Liang, S., Somogyi, R.: Genetic network inference: from co-expression clustering to reverse engineering. Bioinformatics (Oxford, England) 16(8), 707–726 (2000). DOI http://dx.doi.org/10.1093/bioinformatics/16.8.707. URL http://dx.doi.org/10.1093/bioinformatics/16.8.707
- (36) Djebali, S., Davis, C.A., Merkel, A., Dobin, A., Lassmann, T., Mortazavi, A., Tanzer, A., Lagarde, J., Lin, W., Schlesinger, F., et al.: Landscape of transcription in human cells. Nature 488(7414), 101–108 (2013)
- (37) Doench, J.G., Sharp, P.A.: Specificity of microRNA target selection in translational repression. Genes & development 18(5), 504–511 (2004)
- (38) Doshi-Velez, F., Ghahramani, Z.: Accelerated sampling for the indian buffet process. In: Proceedings of the 26th Annual International Conference on Machine Learning, ICML ’09, pp. 273–280. ACM, New York, NY, USA (2009). DOI 10.1145/1553374.1553409
- (39) Dubchak, I., Ryaboy, D.V.: VISTA family of computational tools for comparative analysis of DNA sequences and whole genomes. Methods Mol. Biol. 338, 69–89 (2006)
- (40) Durbin, R., Eddy, S., Krogh, A., Mitchison, G.: Biological sequence analysis: probabilistic models of proteins and nucleic acids. Cambridge University Press, Cambridge, United Kingdom (1998)
- (41) Durbin, R., Eddy, S.R., Krogh, A., Mitchison, G.: Biological Sequence Analysis: Probabilistic Models of Proteins and Nucleic Acids. Cambridge University Press (1998). URL http://www.amazon.ca/exec/obidos/redirect?tag=citeulike09-20&path=ASIN/0521629713
- (42) ENCODE: An integrated encyclopedia of DNA elements in the human genome. Nature 489(7414), 57–74 (2012)
- (43) Eskin, E., Pevzner, P.A.: Finding composite regulatory patterns in DNA sequences. Bioinformatics 18 Suppl 1, S354–363 (2002)
- (44) Favorov, A.V., Gelfand, M.S., Gerasimova, A.V., Ravcheev, D.A., Mironov, A.A., Makeev, V.J.: A Gibbs sampler for identification of symmetrically structured, spaced DNA motifs with improved estimation of the signal length. Bioinformatics 21, 2240–2245 (2005)
- (45) Ferguson, J.P., Cho, J.H., Zhao, H.: A new approach for the joint analysis of multiple chip-seq libraries with application to histone modification. Statistical applications in genetics and molecular biology 11(3) (2012)
- (46) Fleischmann, R., Adams, M., White, O., Clayton, R., Kirkness, E., Kerlavage, A., Bult, C., Tomb, J., Dougherty, B., Merrick, J.: Whole-genome random sequencing and assembly of Haemophilus influenzae Rd. Science 269, 496–512 (1995)
- (47) Foat, B.C., Houshmandi, S.S., Olivas, W.M., Bussemaker, H.J.: Profiling condition-specific, genome-wide regulation of mRNA stability in yeast. Proc. Natl. Acad. Sci. U.S.A. 102, 17,675–17,680 (2005)
- (48) Fordyce, P.M., Gerber, D., Tran, D., Zheng, J., Li, H., DeRisi, J.L., Quake, S.R.: De novo identification and biophysical characterization of transcription-factor binding sites with microfluidic affinity analysis. Nat. Biotechnol. 28(9), 970–975 (2010)
- (49) Friedman, R.C., Farh, K.K.H., Burge, C.B., Bartel, D.P.: Most mammalian mRNAs are conserved targets of microRNAs. Genome Research 19(1), 92–105 (2009)
- (50) Frith, M.C., Hansen, U., Spouge, J.L., Weng, Z.: Finding functional sequence elements by multiple local alignment. Nucleic Acids Res. 32, 189–200 (2004)
- (51) Frith, M.C., Li, M.C., Weng, Z.: Cluster-Buster: Finding dense clusters of motifs in DNA sequences. Nucleic Acids Res. 31(13), 3666–3668 (2003)
- (52) Fulton, D.L., Sundararajan, S., Badis, G., Hughes, T.R., Wasserman, W.W., Roach, J.C., Sladek, R.: TFCat: the curated catalog of mouse and human transcription factors. Genome Biol. 10(3), R29 (2009)
- (53) Galas, D.J., Schmitz, A.: DNAse footprinting: a simple method for the detection of protein-DNA binding specificity. Nucleic Acids Res. 5(9), 3157–3170 (1987)
- (54) Garcia, D.M., Baek, D., Shin, C., Bell, G.W., Grimson, A., Bartel, D.P.: Weak seed-pairing stability and high target-site abundance decrease the proficiency of lsy-6 and other microRNAs. Nature structural & molecular biology 18(10), 1139–1146 (2011)
- (55) Garner, M.M., Revzin, A.: A gel electrophoresis method for quantifying the binding of proteins to specific DNA regions: application to components of the escherichia coli lactose operon regulatory system. Nucleic Acids Res. 9(13), 3047–3060 (1981)
- (56) Gasch, A.P., Moses, A.M., Chiang, D.Y., Fraser, H.B., Berardini, M., Eisen, M.B.: Conservation and evolution of cis-regulatory systems in ascomycete fungi. PLoS Biology 2(5), e398 (2004-12-01). DOI 10.1371/journal.pbio.0020398
- (57) Gerstein, M.B., Kundaje, A., Hariharan, M., Landt, S.G., Yan, K.K., Cheng, C., Mu, X.J., Khurana, E., Rozowsky, J., Alexander, R., Min, R., Alves, P., Abyzov, A., Addleman, N., Bhardwaj, N., Boyle, A.P., Cayting, P., Charos, A., Chen, D.Z., Cheng, Y., Clarke, D., Eastman, C., Euskirchen, G., Frietze, S., Fu, Y., Gertz, J., Grubert, F., Harmanci, A., Jain, P., Kasowski, M., Lacroute, P., Leng, J., Lian, J., Monahan, H., O’Geen, H., Ouyang, Z., Partridge, E.C., Patacsil, D., Pauli, F., Raha, D., Ramirez, L., Reddy, T.E., Reed, B., Shi, M., Slifer, T., Wang, J., Wu, L., Yang, X., Yip, K.Y., Zilberman-Schapira, G., Batzoglou, S., Sidow, A., Farnham, P.J., Myers, R.M., Weissman, S.M., Snyder, M.: Architecture of the human regulatory network derived from ENCODE data. Nature 489(7414), 91–100 (2012)
- (58) Giannopoulou, E.G., Elemento, O.: Inferring chromatin-bound protein complexes from genome-wide binding assays. Genome Res. 23(8), 1295–1306 (2013)
- (59) Goffeau, A., Barrell, B., Bussey, H., Davis, R., Dujon, B., Feldmann, H., Galibert, F., Hoheisel, J., Jacq, C., Johnston, M., Louis, E., Mewes, H., Murakami, Y., Philippsen, P., Tettelin, H., Oliver, S.: Life with 6000 genes. Science 274, 563–567 (1996)
- (60) Griffiths, T., Ghahramani, Z.: Infinite latent feature models and the Indian buffet process. In: In NIPS, pp. 475–482. MIT Press (2005)
- (61) Griffiths-Jones, S., Saini, H.K., van Dongen, S., Enright, A.J.: miRBase: tools for microRNA genomics. Nucleic acids research 36(Database issue), D154–8 (2008)
- (62) Grimson, A., Farh, K.K.H., Johnston, W.K., Garrett-Engele, P., Lim, L.P., Bartel, D.P.: MicroRNA targeting specificity in mammals: determinants beyond seed pairing. Molecular Cell 27(1), 91–105 (2007)
- (63) Grün, D., Wang, Y.L., Langenberger, D., Gunsalus, K.C., Rajewsky, N.: microRNA target predictions across seven Drosophila species and comparison to mammalian targets. PLoS Computational Biology 1(1), e13 (2005)
- (64) GuhaThakurta, D.: Computational identification of transcriptional regulatory elements in DNA sequence. Nucleic Acids Res. 34, 3585–3598 (2006)
- (65) Gunewardena, S., Zhang, Z.: A hybrid model for robust detection of transcription factor binding sites. Bioinformatics 24(4), 484–491 (2008)
- (66) Guo, H., Ingolia, N.T., Weissman, J.S., Bartel, D.P.: Mammalian microRNAs predominantly act to decrease target mRNA levels. Nature 466(7308), 835–840 (2010)
- (67) Guo, Y., Mahony, S., Gifford, D.K.: High resolution genome wide binding event finding and motif discovery reveals transcription factor spatial binding constraints. PLoS computational biology 8(8), e1002,638 (2012)
- (68) He, X., Ling, X., Sinha, S.: Alignment and prediction of cis-regulatory modules based on a probabilistic model of evolution. PLoS Comput. Biol. 5(3), e1000,299 (2009)
- (69) van Helden, J., Andre, B., Collado-Vides, J.: Extracting regulatory sites from the upstream region of yeast genes by computational analysis of oligonucleotide frequencies. J. Mol. Biol. 281, 827–842 (1998)
- (70) Helwak, A., Kudla, G., Dudnakova, T., Tollervey, D.: Mapping the Human miRNA Interactome by CLASH Reveals Frequent Noncanonical Binding. Cell 153(3), 654–665 (2013)
- (71) Herrmann, C., Van de Sande, B., Potier, D., Aerts, S.: i-cisTarget: an integrative genomics method for the prediction of regulatory features and cis-regulatory modules. Nucleic Acids Res. 40(15), e114 (2012)
- (72) Hertz, G.Z., Stormo, G.D.: Identifying DNA and protein patterns with statistically significant alignments of multiple sequences. Bioinformatics 15, 563–577 (1999)
- (73) Ho, S.W., Jona, G., Chen, C.T., Johnston, M., Snyder, M.: Linking DNA-binding proteins to their recognition sequences by using protein microarrays. Proc. Natl. Acad. Sci. U.S.A. 103(26), 9940–9945 (2006)
- (74) Hu, S., Xie, Z., Onishi, A., Yu, X., Jiang, L., Lin, J., Rho, H.S., Woodard, C., Wang, H., Jeong, J.S., Long, S., He, X., Wade, H., Blackshaw, S., Qian, J., Zhu, H.: Profiling the human protein-DNA interactome reveals ERK2 as a transcriptional repressor of interferon signaling. Cell 139(3), 610–622 (2009)
- (75) Huang, J.C., Babak, T., Corson, T.W., Chua, G., Khan, S., Gallie, B.L., Hughes, T.R., Blencowe, B.J., Frey, B.J., Morris, Q.D.: Using expression profiling data to identify human microRNA targets. Nature Methods 4(12), 1045–1049 (2007)
- (76) Hughes, J.D., Estep, P.W., Tavazoie, S., Church, G.M.: Computational identification of cis-regulatory elements associated with groups of functionally related genes in Saccharomyces cerevisiae. J. Mol. Biol. 296, 1205–1214 (2000)
- (77) Initiative, A.G.: Analysis of the genome sequence of the flowering plant Arabidopsis thaliana. Nature 408, 796–815 (2000)
- (78) Ji, H., Jiang, H., Ma, W., Johnson, D.S., Myers, R.M., Wong, W.H.: An integrated software system for analyzing ChIP-chip and ChIP-seq data. Nat. Biotechnol. 26(11), 1293–1300 (2008)
- (79) Ji, H., Li, X., Wang, Q.f., Ning, Y.: Differential principal component analysis of chip-seq. Proceedings of the National Academy of Sciences 110(17), 6789–6794 (2013)
- (80) John, B., Enright, A.J., Aravin, A., Tuschl, T., Sander, C., Marks, D.S.: Human MicroRNA Targets. PLoS Biology 2(11), e363 (2004)
- (81) Johnson, D.S., Mortazavi, A., Myers, R.M., Wold, B.: Genome-wide mapping of in vivo protein-DNA interactions. Science 316(5830), 1497–1502 (2007)
- (82) Joung, J.G., Hwang, K.B., Nam, J.W., Kim, S.J., Zhang, B.T.: Discovery of microRNA-mRNA modules via population-based probabilistic learning. Bioinformatics (Oxford, England) 23(9), 1141–1147 (2007)
- (83) Keller, A., Leidinger, P., Bauer, A., ElSharawy, A., Haas, J., Backes, C., Wendschlag, A., Giese, N., Tjaden, C., Ott, K., Werner, J., Hackert, T., Ruprecht, K., Huwer, H., Huebers, J., Jacobs, G., Rosenstiel, P., Dommisch, H., Schaefer, A., Müller-Quernheim, J., Wullich, B., Keck, B., Graf, N., Reichrath, J., Vogel, B., Nebel, A., Jager, S.U., Staehler, P., Amarantos, I., Boisguerin, V., Staehler, C., Beier, M., Scheffler, M., Büchler, M.W., Wischhusen, J., Haeusler, S.F.M., Dietl, J., Hofmann, S., Lenhof, H.P., Schreiber, S., Katus, H.A., Rottbauer, W., Meder, B., Hoheisel, J.D., Franke, A., Meese, E.: Toward the blood-borne miRNome of human diseases. Nature Methods 8(10), 841–843 (2011)
- (84) Kellis, M., Patterson, N., Birren, B., Berger, B., Lander, E.S.: Methods in comparative genomics: genome correspondence, gene identification and regulatory motif discovery. J. Comput. Biol. 11(2-3), 319–355 (2004)
- (85) Khan, A.A., Betel, D., Miller, M.L., Sander, C., Leslie, C.S., Marks, D.S.: Transfection of small RNAs globally perturbs gene regulation by endogenous microRNAs. Nature Biotechnology 27(6), 549–555 (2009)
- (86) Kharchenko, P.V., Tolstorukov, M.Y., Park, P.J.: Design and analysis of ChIP-seq experiments for DNA-binding proteins. Nat. Biotechnol. 26(12), 1351–1359 (2008)
- (87) Kim, P.M.: Subsystem Identification Through Dimensionality Reduction of Large-Scale Gene Expression Data. Genome Research 13(7), 1706–1718 (2003)
- (88) Kim, T., Tyndel, M.S., Huang, H., Sidhu, S.S., Bader, G.D., Gfeller, D., Kim, P.M.: MUSI: an integrated system for identifying multiple specificity from very large peptide or nucleic acid data sets. Nucleic Acids Res. 40(6), e47 (2012)
- (89) Kiriakidou, M., Nelson, P.T., Kouranov, A., Fitziev, P., Bouyioukos, C., Mourelatos, Z., Hatzigeorgiou, A.: A combined computational-experimental approach predicts human microRNA targets. Genes & development 18(10), 1165–1178 (2004)
- (90) Kozomara, A., Griffiths-Jones, S.: miRBase: annotating high confidence microRNAs using deep sequencing data. Nucleic acids research 42(1), D68–73 (2014)
- (91) Krek, A., Grün, D., Poy, M.N., Wolf, R., Rosenberg, L., Epstein, E.J., MacMenamin, P., da Piedade, I., Gunsalus, K.C., Stoffel, M., Rajewsky, N.: Combinatorial microRNA target predictions. Nature Genetics 37(5), 495–500 (2005)
- (92) Laajala, T.D., Raghav, S., Tuomela, S., Lahesmaa, R., Aittokallio, T., Elo, L.L.: A practical comparison of methods for detecting transcription factor binding sites in ChIP-seq experiments. BMC Genomics 10, 618 (2009)
- (93) Lall, S., Grün, D., Krek, A., Chen, K., Wang, Y.L., Dewey, C.N., Sood, P., Colombo, T., Bray, N., MacMenamin, P., Kao, H.L., Gunsalus, K.C., Pachter, L., Piano, F., Rajewsky, N.: A Genome-Wide Map of Conserved MicroRNA Targets in C. elegans. Current Biology 16(5), 460–471 (2006)
- (94) Le, H.S., Bar-Joseph, Z.: Inferring interaction networks using the ibp applied to microrna target prediction. In: Advances in Neural Information Processing Systems, pp. 235–243 (2011)
- (95) Le, H.S., Bar-Joseph, Z.: Integrating sequence, expression and interaction data to determine condition-specific miRNA regulation. Bioinformatics (Oxford, England) 29(13), i89–97 (2013)
- (96) Lee, D.D., Seung, H.S.: Learning the parts of objects by non-negative matrix factorization. Nature 401(6755), 788–791 (1999)
- (97) Lewis, B.P., Burge, C.B., Bartel, D.P.: Conserved Seed Pairing, Often Flanked by Adenosines, Indicates that Thousands of Human Genes are MicroRNA Targets. Cell 120(1), 15–20 (2005)
- (98) Lewis, B.P., Shih, I.h., Jones-Rhoades, M.W., Bartel, D.P., Burge, C.B.: Prediction of mammalian microRNA targets. Cell 115(7), 787–798 (2003)
- (99) Li, Y., Goldenberg, A., Wong, K.C., Zhang, Z.: A probabilistic approach to explore human miRNA targetome by integrating miRNA-overexpression data and sequence information. Bioinformatics (Oxford, England) 30(5), 621–628 (2014)
- (100) Li, Y., Liang, C., Wong, K.C., Luo, J., Zhang, Z.: Mirsynergy: detecting synergistic miRNA regulatory modules by overlapping neighbourhood expansion. Bioinformatics (Oxford, England) 30(18), 2627–2635 (2014)
- (101) Liang, Y., Leung, K.S., Mok, T.S.K.: Evolutionary drug scheduling models with different toxicity metabolism in cancer chemotherapy. Appl. Soft Comput. 8(1), 140–149 (2008). DOI http://dx.doi.org/10.1016/j.asoc.2006.12.002
- (102) Lifanov, A.P., Makeev, V.J., Nazina, A.G., Papatsenko, D.A.: Homotypic regulatory clusters in Drosophila. Genome Res. 13(4), 579–588 (2003)
- (103) Lim, L.P., Lau, N.C., Garrett-Engele, P., Grimson, A., Schelter, J.M., Castle, J., Bartel, D.P., Linsley, P.S., Johnson, J.M.: Microarray analysis shows that some microRNAs downregulate large numbers of target mRNAs. Nature 433(7027), 769–773 (2005)
- (104) Liu, X.S., Brutlag, D.L., Liu, J.S.: An algorithm for finding protein-DNA binding sites with applications to chromatin-immunoprecipitation microarray experiments. Nat. Biotechnol. 20, 835–839 (2002)
- (105) Lorenz, R., Bernhart, S.H., Höner Zu Siederdissen, C., Tafer, H., Flamm, C., Stadler, P.F., Hofacker, I.L.: ViennaRNA Package 2.0. Algorithms for molecular biology : AMB 6, 26 (2011)
- (106) Lu, J., Getz, G., Miska, E.A., Alvarez-Saavedra, E., Lamb, J., Peck, D., Sweet-Cordero, A., Ebert, B.L., Mak, R.H., Ferrando, A.A., Downing, J.R., Jacks, T., Horvitz, H.R., Golub, T.R.: MicroRNA expression profiles classify human cancers. Nature 435(7043), 834–838 (2005)
- (107) MacKay, D.J.: Ensemble learning for hidden markov models. Tech. rep., Cavendish Laboratory, Cambridge (1997)
- (108) Mahony, S., Edwards, M.D., Mazzoni, E.O., Sherwood, R.I., Kakumanu, A., Morrison, C.A., Wichterle, H., Gifford, D.K.: An integrated model of multiple-condition chip-seq data reveals predeterminants of cdx2 binding. PLoS computational biology 10(3), e1003,501 (2014)
- (109) Matys, V., Kel-Margoulis, O.V., Fricke, E., Liebich, I., Land, S., Barre-Dirrie, A., Reuter, I., Chekmenev, D., Krull, M., Hornischer, K., Voss, N., Stegmaier, P., Lewicki-Potapov, B., Saxel, H., Kel, A.E., Wingender, E.: Transfac and its module transcompel: transcriptional gene regulation in eukaryotes. Nucleic Acids Research 34, 108–110 (2006)
- (110) McGuffin, L.J., Bryson, K., Jones, D.T.: The psipred protein structure prediction server. Bioinformatics (Oxford, England) 16(4), 404–405 (2000). DOI 10.1093/bioinformatics/16.4.404. URL http://dx.doi.org/10.1093/bioinformatics/16.4.404
- (111) Meunier, J., Lemoine, F., Soumillon, M., Liechti, A., Weier, M., Guschanski, K., Hu, H., Khaitovich, P., Kaessmann, H.: Birth and expression evolution of mammalian microRNA genes. Genome Research (2012)
- (112) Mohan, P.M., Hosur, R.V.: Structure-function-folding relationships and native energy landscape of dynein light chain protein: nuclear magnetic resonance insights. J. Biosci. 34, 465–479 (2009)
- (113) Montgomery, S., Griffith, O., Sleumer, M., Bergman, C., Bilenky, M., Pleasance, E., Prychyna, Y., Zhang, X., Jones, S.: ORegAnno: an open access database and curation system for literature-derived promoters, transcription factor binding sites and regulatory variation. Bioinformatics 22, 637–640 (2006)
- (114) Moses, A.M., Chiang, D.Y., Eisen, M.B.: Phylogenetic motif detection by expectation-maximization on evolutionary mixtures. Pac Symp Biocomput pp. 324–335 (2004)
- (115) Moses, A.M., Chiang, D.Y., Pollard, D.A., Iyer, V.N., Eisen, M.B.: MONKEY: identifying conserved transcription-factor binding sites in multiple alignments using a binding site-specific evolutionary model. Genome Biol. 5(12), R98 (2004)
- (116) Moses, A.M., Sinha, S.: Regulatory motif analysis. Bioinformatics: Tools and Applications (Edwards D, Stajich J,Hansen D) Springer Biomedical and Life Sciences collection pp. 137–163 (2009)
- (117) Nepusz, T., Yu, H., Paccanaro, A.: Detecting overlapping protein complexes in protein-protein interaction networks. Nature Methods 9(5), 471–472 (2012)
- (118) Nishida, K., Frith, M.C., Nakai, K.: Pseudocounts for transcription factor binding sites. Nucleic Acids Res. 37(3), 939–944 (2009)
- (119) Ovcharenko, I., Boffelli, D., Loots, G.G.: eShadow: a tool for comparing closely related sequences. Genome Res. 14(6), 1191–1198 (2004)
- (120) Papadopoulos, G.L., Alexiou, P., Maragkakis, M., Reczko, M., Hatzigeorgiou, A.G.: DIANA-mirPath: Integrating human and mouse microRNAs in pathways. Bioinformatics (Oxford, England) 25(15), 1991–1993 (2009)
- (121) Pavesi, G., Mereghetti, P., Mauri, G., Pesole, G.: Weeder Web: discovery of transcription factor binding sites in a set of sequences from co-regulated genes. Nucleic Acids Res. 32, 199–203 (2004)
- (122) Peng, X., Li, Y., Walters, K.A., Rosenzweig, E.R., Lederer, S.L., Aicher, L.D., Proll, S., Katze, M.G.: Computational identification of hepatitis C virus associated microRNA-mRNA regulatory modules in human livers. BMC Genomics 10, 373 (2009)
- (123) Pfreundt, U., James, D.P., Tweedie, S., Wilson, D., Teichmann, S.A., Adryan, B.: FlyTF: improved annotation and enhanced functionality of the Drosophila transcription factor database. Nucleic Acids Res. 38(Database issue), D443–447 (2010)
- (124) Philippakis, A.A., He, F.S., Bulyk, M.L.: Modulefinder: a tool for computational discovery of cis regulatory modules. Pac Symp Biocomput pp. 519–530 (2005)
- (125) Portales-Casamar, E., Thongjuea, S., Kwon, A.T., Arenillas, D., Zhao, X., Valen, E., Yusuf, D., Lenhard, B., Wasserman, W.W., Sandelin, A.: JASPAR 2010: the greatly expanded open-access database of transcription factor binding profiles. Nucleic Acids Res. 38(Database issue), D105–110 (2010)
- (126) Rajewsky, N., Vergassola, M., Gaul, U., Siggia, E.D.: Computational detection of genomic cis-regulatory modules applied to body patterning in the early Drosophila embryo. BMC Bioinformatics 3, 30 (2002)
- (127) Ramaswamy, S., Tamayo, P., Rifkin, R., Mukherjee, S., Yeang, C.H., Angelo, M., Ladd, C., Reich, M., Latulippe, E., Mesirov, J.P., Poggio, T., Gerald, W., Loda, M., Lander, E.S., Golub, T.R.: Multiclass cancer diagnosis using tumor gene expression signatures. Proceedings of the National Academy of Sciences of the United States of America 98(26), 15,149–15,154 (2001)
- (128) Régnier, M., Denise, A.: Rare events and conditional events on random strings. Discrete Mathematics an Theoretical Computer Science 6(2), 191–214 (2004). URL http://dmtcs.loria.fr/volumes/abstracts/dm060203.abs.html
- (129) Ren, B., Robert, F., Wyrick, J.J., Aparicio, O., Jennings, E.G., Simon, I., Zeitlinger, J., Schreiber, J., Hannett, N., Kanin, E., Volkert, T.L., Wilson, C.J., Bell, S.P., Young, R.A.: Genome-wide location and function of DNA binding proteins. Science 290(5500), 2306–2309 (2000)
- (130) Robasky, K., Bulyk, M.L.: UniPROBE, update 2011: expanded content and search tools in the online database of protein-binding microarray data on protein-DNA interactions. Nucleic Acids Res. 39, D124–128 (2011)
- (131) Ronquist, F., Huelsenbeck, J.P.: Mrbayes 3: Bayesian phylogenetic inference under mixed models. Bioinformatics 19(12), 1572–1574 (2003). DOI 10.1093/bioinformatics/btg180. URL http://dx.doi.org/10.1093/bioinformatics/btg180
- (132) Rozowsky, J., Euskirchen, G., Auerbach, R.K., Zhang, Z.D., Gibson, T., Bjornson, R., Carriero, N., Snyder, M., Gerstein, M.B.: PeakSeq enables systematic scoring of ChIP-seq experiments relative to controls. Nat. Biotechnol. 27(1), 66–75 (2009)
- (133) Sandelin, A., Wasserman, W.W., Lenhard, B.: ConSite: web-based prediction of regulatory elements using cross-species comparison. Nucleic Acids Res. 32(Web Server issue), W249–252 (2004)
- (134) Segal, E., Yelensky, R., Koller, D.: Genome-wide discovery of transcriptional modules from DNA sequence and gene expression. Bioinformatics 19 Suppl 1, i273–282 (2003)
- (135) Sethupathy, P., Megraw, M., Hatzigeorgiou, A.G.: A guide through present computational approaches for the identification of mammalian microRNA targets. Nature Methods 3(11), 881–886 (2006)
- (136) Shalgi, R., Lieber, D., Oren, M., Pilpel, Y.: Global and local architecture of the mammalian microRNA-transcription factor regulatory network. PLoS Computational Biology 3(7), e131 (2007)
- (137) Siddharthan, R., Siggia, E.D., van Nimwegen, E.: PhyloGibbs: a Gibbs sampling motif finder that incorporates phylogeny. PLoS Comput. Biol. 1(7), e67 (2005)
- (138) Siepel, A., Bejerano, G., Pedersen, J.S., Hinrichs, A.S., Hou, M., Rosenbloom, K., Clawson, H., Spieth, J., Hillier, L.W., Richards, S., Weinstock, G.M., Wilson, R.K., Gibbs, R.A., Kent, W.J., Miller, W., Haussler, D.: Evolutionarily conserved elements in vertebrate, insect, worm, and yeast genomes. Genome Res. 15(8), 1034–1050 (2005)
- (139) Sinha, S., He, X.: MORPH: probabilistic alignment combined with hidden Markov models of cis-regulatory modules. PLoS Comput. Biol. 3(11), e216 (2007)
- (140) Sinha, S., Liang, Y., Siggia, E.: Stubb: a program for discovery and analysis of cis-regulatory modules. Nucleic Acids Res. 34(Web Server issue), W555–559 (2006)
- (141) Sinha, S., Liang, Y., Siggia, E.: Stubb: a program for discovery and analysis of cis-regulatory modules. Nucleic Acids Research 34(Web Server), W555–W559 (2006)
- (142) Sinha, S., van Nimwegen, E., Siggia, E.D.: A probabilistic method to detect regulatory modules. Bioinformatics 19 Suppl 1, 292–301 (2003)
- (143) Sinha, S., van Nimwegen, E., Siggia, E.D.: A probabilistic method to detect regulatory modules. Bioinformatics (Oxford, England) 19 Suppl 1, i292–301 (2003)
- (144) Sinha, S., Tompa, M.: YMF: A program for discovery of novel transcription factor binding sites by statistical overrepresentation. Nucleic Acids Res. 31, 3586–3588 (2003)
- (145) Smith, A.D., Sumazin, P., Zhang, M.Q.: Identifying tissue-selective transcription factor binding sites in vertebrate promoters. Proc. Natl. Acad. Sci. U.S.A. 102(5), 1560–1565 (2005)
- (146) Smyth, M.S., Martin, J.H.: x ray crystallography. Molecular pathology : MP 53(1), 8–14 (2000). URL http://view.ncbi.nlm.nih.gov/pubmed/10884915
- (147) Song, L., Tuan, R.S.: MicroRNAs and cell differentiation in mammalian development. Birth defects research. Part C, Embryo today : reviews 78(2), 140–149 (2006)
- (148) Spivak, A.T., Stormo, G.D.: ScerTF: a comprehensive database of benchmarked position weight matrices for Saccharomyces species. Nucleic Acids Res. 40(Database issue), D162–168 (2012)
- (149) Staden, R.: Methods for calculating the probabilities of finding patterns in sequences. Comput. Appl. Biosci. 5(2), 89–96 (1989)
- (150) Stormo, G.D.: Maximally efficient modeling of dna sequence motifs at all levels of complexity. Genetics 187(4), 1219–1224 (2011). DOI http://dx.doi.org/10.1534/genetics.110.126052. URL http://dx.doi.org/10.1534/genetics.110.126052
- (151) Su, J., Teichmann, S.A., Down, T.A.: Assessing computational methods of cis-regulatory module prediction. PLoS Comput. Biol. 6(12), e1001,020 (2010)
- (152) Tanay, A.: Extensive low-affinity transcriptional interactions in the yeast genome. Genome Res. 16, 962–972 (2006)
- (153) Thibaux, R., Jordan, M.I.: Hierarchical beta processes and the Indian buffet process. International Conference on Artificial Intelligence and Statistics 11, 564–571 (2007)
- (154) Thijs, G., Lescot, M., Marchal, K., Rombauts, S., De Moor, B., Rouze, P., Moreau, Y.: A higher-order background model improves the detection of promoter regulatory elements by Gibbs sampling. Bioinformatics 17, 1113–1122 (2001)
- (155) Tomovic, A., Oakeley, E.J.: Position dependencies in transcription factor binding sites. Bioinformatics 23(8), 933–941 (2007)
- (156) Tompa, M., Li, N., Bailey, T.L., Church, G.M., Moor, B.D., Eskin, E., Favorov, A.V., Frith, M.C., Fu, Y., Kent, W.J., Makeev, V.J., Mironov, A.A., Noble, W.S., Pavesi, G., Pesole, G., Regnier, M., Simonis, N., Sinha, S., Thijs, G., van Helden, J., Vandenbogaert, M., Weng, Z., Workman, C., Ye, C., , Zhu, Z.: Assessing computational tools for the discovery of transcription factor binding sites. Nature Biotechnology 23(1), 137–144 (2005)
- (157) Tsang, J.S., Ebert, M.S., van Oudenaarden, A.: Genome-wide Dissection of MicroRNA Functionsand Cotargeting Networks Using Gene Set Signatures. Molecular Cell 38(1), 140–153 (2010)
- (158) Tuerk, C., Gold, L.: Systematic evolution of ligands by exponential enrichment: RNA ligands to bacteriophage T4 DNA polymerase. Science 249(4968), 505–510 (1990)
- (159) Wang, J.J., Bensmail, H., Gao, X.: Multiple graph regularized protein domain ranking. BMC Bioinformatics 13, 307 (2012)
- (160) Wang, J.J.Y., Bensmail, H., Gao, X.: Multiple graph regularized nonnegative matrix factorization. Pattern Recognition 46(10), 2840–2847 (2013)
- (161) Warner, J.B., Philippakis, A.A., Jaeger, S.A., He, F.S., Lin, J., Bulyk, M.L.: Systematic identification of mammalian regulatory motifs’ target genes and functions. Nat. Methods 5(4), 347–353 (2008)
- (162) Wasserman, W.W., Sandelin, A.: Applied bioinformatics for the identification of regulatory elements. Nat. Rev. Genet. 5(4), 276–287 (2004)
- (163) Weinstein, J.N., Collisson, E.A., Mills, G.B., Shaw, K.R.M., Ozenberger, B.A., Ellrott, K., Shmulevich, I., Sander, C., Stuart, J.M.: The Cancer Genome Atlas Pan-Cancer analysis project. Nature Genetics 45(10), 1113–1120 (2013)
- (164) Wilbanks, E.G., Facciotti, M.T.: Evaluation of algorithm performance in ChIP-seq peak detection. PLoS ONE 5(7), e11,471 (2010)
- (165) Wingender, E., Chen, X., Hehl, R., Karas, H., Liebich, I., Matys, V., Meinhardt, T., Prüss, M., Reuter, I., Schacherer, F.: TRANSFAC: an integrated system for gene expression regulation. Nucleic acids research 28(1), 316–319 (2000)
- (166) Wong, K.C., Chan, T.M., Peng, C., Li, Y., Zhang, Z.: DNA motif elucidation using belief propagation. Nucleic Acids Res. 41(16), e153 (2013)
- (167) Wong, K.C., Leung, K.S., Wong, M.H.: An evolutionary algorithm with species-specific explosion for multimodal optimization. In: GECCO ’09: Proceedings of the 11th Annual conference on Genetic and evolutionary computation, pp. 923–930. ACM, New York, NY, USA (2009). DOI http://doi.acm.org/10.1145/1569901.1570027
- (168) Wong, K.C., Leung, K.S., Wong, M.H.: Protein structure prediction on a lattice model via multimodal optimization techniques. In: Proceedings of the 12th annual conference on Genetic and evolutionary computation, pp. 155–162. ACM (2010)
- (169) Wong, K.C., Li, Y., Peng, C., Zhang, Z.: Signalspider: probabilistic pattern discovery on multiple normalized chip-seq signal profiles. Bioinformatics p. btu604 (2014)
- (170) Wong, K.C., Peng, C., Wong, M.H., Leung, K.S.: Generalizing and learning protein-dna binding sequence representations by an evolutionary algorithm. Soft Comput. 15(8), 1631–1642 (2011). DOI 10.1007/s00500-011-0692-5. URL http://dx.doi.org/10.1007/s00500-011-0692-5
- (171) Wong, K.C., Wu, C.H., Mok, R.K.P., Peng, C., Zhang, Z.: Evolutionary multimodal optimization using the principle of locality. Information Sciences 194, 138–170 (2012)
- (172) Workman, C.T., Stormo, G.D.: ANN-Spec: a method for discovering transcription factor binding sites with improved specificity. Pac Symp Biocomput pp. 467–478 (2000)
- (173) Wu, J., Xie, J.: Computation-based discovery of cis-regulatory modules by hidden Markov model. Journal of computational biology : a journal of computational molecular cell biology 15(3), 279–290 (2008)
- (174) Xie, D., Boyle, A.P., Wu, L., Zhai, J., Kawli, T., Snyder, M.: Dynamic trans-acting factor colocalization in human cells. Cell 155(3), 713–724 (2013)
- (175) Xie, X., Rigor, P., Baldi, P.: MotifMap: a human genome-wide map of candidate regulatory motif sites. Bioinformatics 25(2), 167–174 (2009)
- (176) Xu, J., Li, C.X., Li, Y.S., Lv, J.Y., Ma, Y., Shao, T.T., Xu, L.D., Wang, Y.Y., Du, L., Zhang, Y.P., Jiang, W., Li, C.Q., Xiao, Y., Li, X.: MiRNA-miRNA synergistic network: construction via co-regulating functional modules and disease miRNA topological features. Nucleic Acids Research 39(3), 825–836 (2011)
- (177) Yue, D., Liu, H., Huang, Y.: Survey of Computational Algorithms for MicroRNA Target Prediction. Current genomics 10(7), 478–492 (2009)
- (178) Zeng, X., Sanalkumar, R., Bresnick, E.H., Li, H., Chang, Q., Kele, S.: jMOSAiCS: joint analysis of multiple ChIP-seq datasets. Genome Biol. 14(4), R38 (2013)
- (179) Zhang, S., Li, Q., Liu, J., Zhou, X.J.: A novel computational framework for simultaneous integration of multiple types of genomic data to identify microRNA-gene regulatory modules. Bioinformatics (Oxford, England) 27(13), i401–9 (2011)
- (180) Zhang, Y., Liu, T., Meyer, C.A., Eeckhoute, J., Johnson, D.S., Bernstein, B.E., Nusbaum, C., Myers, R.M., Brown, M., Li, W., Liu, X.S.: Model-based analysis of ChIP-Seq (MACS). Genome Biol. 9(9), R137 (2008)
- (181) Zhou, Q., Wong, W.H.: CisModule: de novo discovery of cis-regulatory modules by hierarchical mixture modeling. Proc. Natl. Acad. Sci. U.S.A. 101(33), 12,114–12,119 (2004)
- (182) Zia, A., Moses, A.M.: Towards a theoretical understanding of false positives in DNA motif finding. BMC Bioinformatics 13, 151 (2012)