Effect of Ag doping on structural, optical, and photocatalytic properties of ZnO nanoparticles
Abstract
Silver-doped ZnO nanoparticles were successfully fabricated at via a simple and rapid method based on short time solid state milling and calcination of precursor powders. The effect of Ag dilute doping on the structural, optical, and photocatalytic properties of ZnO nanoparticles was investigated by X-ray diffraction (XRD), UV-vis spectrophotometer and photoluminescence (PL) spectroscopy. X-ray analysis revealed that Ag doped ZnO solidified in hexagonal wurtzite structure. The intensity of deep level emission was reduced with increasing silver doping in PL measurement. The X-ray photoelectron spectroscopy (XPS) measurement predicted that Ag was mainly in the metallic state and ZnO was in the wurtzite structure. This metallic state accompanied by unique zinc oxide properties decolorized the methyl violet, efficiently. The first-principles calculation represented Ag deep level in ZnO with an n-type behavior, while in ZnO structure with grain boundary p-type nature via shallow states is dominant same as powder samples as studied in this present work. It was suggested that these Ag-doped ZnO nanoparticles may have good applications in optoelectronics, spintronics and wastewater treatment.
I INTRODUCTION
Multifunctional materials come on stage accompanied with magnetic properties in diluted magnetic semiconductors (DMS), in which non-magnetic ions replace some of the magnetic and non-magnetic cations. The origin of ferromagnetic properties in diluted semiconductors has been studied, both theoretically and experimentally 1; 2, however, still there is no broad consensus on this issue .
Among DMS materials, ZnO-based DMS has remarkable features: i) Direct wide band gap at room temperature, ii) Access to the large bulk and high-quality single crystals of ZnO and iii) Large exciton binding energy of . The latter is useful for having lasers with high efficiency at room temperature 3; 4. In addition, ZnO is useful in solar cells and sensors as transparent conductive and piezoelectric 5.
Pure ZnO nanostructures show weak optical features that are resulted from point defects such as oxygen vacancy or interstitial Zn; therefore, they can not be used directly in the industry 5. As a result, doping ZnO with a convenient element is a method for engineering optical and magnetic properties. Furthermore, in order to make optoelectronic devices, n-type and p-type states are needed. It is relatively difficult to achieve p-type doping and this limitation is considered an obstacle in using ZnO in these instruments 6. Although the elements V, I, and IB groups have been studied for p-type doping 7, silver has been reported as the best candidate because of its high solubility, larger ionic size, and minimum orbital energy 8. Theoretically, Volnianska et al. 9 reported that, among the elements of group IB, copper, and especially Au, ionization energy was higher than Ag and caused silver to be the best case for achieving p-doping in ZnO. Recently, Thomas et al. 10 combined experimental approaches and theoretical calculations and revealed that the majority of Ag was doped (substitution) into the ZnO structure. Furthermore, Ag 4d and O 2p states were overlapped to form an impurity band, which shifted the Fermi level toward the valence band maximum and induced p-type properties in ZnO. Electrical properties of the Ag-doped ZnO nano-wires showed that their p-type properties depended not only on Ag content, but also on other conditions such as electrochemical growth and post-annealing conditions.
Silver ions have two characteristic features and can be used in the places of substitution and interstitial; hence, they can act as an acceptor in ZnO 11. However, previous studies on Ag-doped ZnO by Yan et al. 8 suggested that substitutional sites were more energetically favourable than interstitial sites. Most studies have examined the effects of silver doping on the photocatalytic activity and antibacterial properties of ZnO 12; 13; 14; 15. It is also possible to form a dilute magnetic semiconductor by silver doping in ZnO wurtzite structure and ferromagnetic behavior of the compound has been investigated experimentally 16 and theoretically 17, which can be used in spintronic applications by both degrees of freedom of electron spin and charge. The ferromagnetic properties are due to the formation of impurity band which interacts with the d orbital of nonmagnetic element 18. However, the origin of ferromagnetic properties is still under investigation.
In the studies on the nanostructures of Ag-doped ZnO, different methods such as sol-gel 19, sonochemical 20, and coprecipitation 21 have been used, all of which require harsh conditions of sample preparation, high temperature, and high costs. However, in this paper the structural, optical, and photocatalytic properties in (, and ) nanoparticles synthesized by a simple and low-cost method, called thermal treatment of ball-milled precursors were investigated. The aim of this work was to produce p-type doping of the nanoparticles to be used in practical applications. Optical measurements showed that the synthesized nanoparticles were of p-type.
II EXPERIMENTAL
II.1 Substances and their provision
Nanoparticle samples of were prepared by a simple and low-cost method. In this method, zinc acetate dehydrate with purity and citric acid were initially combined at the molar ratio of . Then, various concentrations (x=, and called A, B, and C, respectively) of silver nitrate were used for preparing the doped samples. The powders were mixed and ground for 90 min at room temperature and the milled powders were ultimately calcined in air at for 2 h 22.
II.2 Photocatalytic studies
The photocatalytic performances of the samples were evaluated by the decomposition of methyl violet in the solution under UV light. In order to prepare the samples for the photocatalytic analysis, first, 0.05 gr of MV with chemical formula was weighed. The 50ppm solution of methyl violet dye and 0.1 gr of the catalyst, ZnO, and Ag-doped ZnO, in a quartz tube were prepared for the photo reactor system. First, the solution was placed in the dark mood for 30 min and then, under UV irradiation (wavelength=254 nm, power =15 W) at several stages. Afterwards, absorption spectra of the samples were taken. The solution was analyzed by Lambda 25 UV/VIS spectrophotometer ( Perkin Elmer).
The degradation rate was calculated using the following formula:
| (1) |
where is the primal concentration of methyl violet solution and C(t) is concentration at different UV irradiation times.
II.3 Characterization of samples
Structural analysis was carried out using X-ray diffractometry (XRD) (XPERT model, radiation, at room temperature). The morphologies of the prepared nanoparticles were recorded by a Hitachi S4160 field emission scanning electron microscope (FE-SEM). X-ray photoelectron spectroscopy (XPS) analysis was carried out for assessing purity of materials and examining the composition and characteristics of defects by an ESCA/AES system. The system was equipped with a concentric hemispherical analyzer (CHA, Specs model EA10 plus). An line at 1486.6 eV was utilized for exciting the X-ray photoelectrons. This analysis was done using high-resolution scan of the O(1s), Zn(2p), Zn(3d) and Ag(3d) spectral regions. In the XPS spectra, all the binding energies were calibrated by taking the carbon peak (284.8 ) as the reference. Formation of ZnO wurtzite phase and available molecular bonds was investigated by the measurement of FTIR absorption spectrum of samples using a BRUKEN TENSOR 27 spectrophotometer. The FTIR analysis was carried out at room-temperature in the range 400-4000 using KBr as the reference. To investigate the optical properties of these nanoparticles, the absorbance spectra of the samples were measured on a Perkin Elmer Lambda 25 UV/VIS spectrophotometer using ethanol as the reference. The UV-vis absorption spectrum was recorded in the range of 300-800 nm. Room temperature photoluminescence spectra of the samples were acquired from Perkin-Elmer LS55 spectrometer using xenon flash lamp laser as the excitation source within the range of 340 to 500 nm and excitation wavelength of 210.5 nm.
III RESULTS AND DISCUSSION
III.1 Structural properties
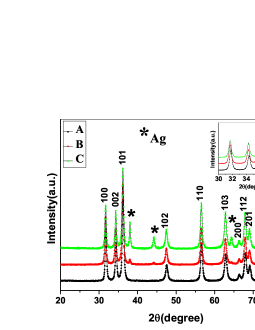
Fig. 1 shows a broad and enlarged view of X-ray diffraction patterns of the nanoparticles. All the intensity data were appropriately normalized to 1. The XRD pattern of pure ZnO displayed wurtzite crystal structure (JCPDS NO. 01-079-2205), without any other crystalline phases. There were three additional peaks at of 38.14, 44.48, and 64.47o in ZnO doped with Ag values 0.02 and 0.07, which could be attributed to metallic Ag fcc phase, and indicate the formation of Ag as the second phase clusters. Also, a consistent increase in the intensity of silver peaks can be noted by the increase in the concentration of Ag from 2 to 7 . It should be noted that the formation of metallic silver and the crystalline phase of ZnO begins at about 23. By increasing Ag concentration, peak position is shifted toward lower values, as shown in Table 1. This shift suggests the partial substitution of ions at the ZnO lattice and increase in the lattice parameters a and c, as expected 24; this issue is presumably related to the ionic size difference between the (0.126 nm) and (0.074 nm) ions. But, in this work, rietveld analysis showed a slight decrease in the a and c lattice parameters and cell volume, which can be explained by the formation of silver nano-collection 25 and the part substitution of ions in the system, respectively. The substitution did not cause any increase in the lattice parameters via very small percentage of silver doping.
To study the effect of silver doping on the crystal size, the mean crystal size was estimated from the Debye-Scherrer equation as follows:
| (2) |
where, , is Bragg angle, (X-ray wavelength) and . The crystalline size of A, B and C samples are estimated as 23.12, 24.44 and 25.46 nm, respectively.
| Compound | 2Theta | (hkl) | Crystal size ”D” (nm) |
|---|---|---|---|
| A | 31.78 | (100) | 23.12 |
| B | 31.67 | (100) | 24.44 |
| C | 31.65 | (100) | 25.46 |
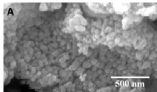
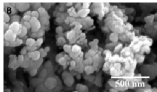
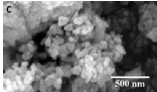
Information such as grain size and shape can be obtained by FE-SEM analysis. Surface morphology of the undoped and silver-doped ZnO nanoparticles is shown in Fig. 2. The particle sizes were clearly of the order of nanometers and shape of particles was quasi-spherical. Formation of the quasi-spherical nanoparticles in the size range of 20-150 nm is shown in Fig.2. Using silver doping, significant changes were not observed in the size of nanoparticles.
III.2 FT-IR studies
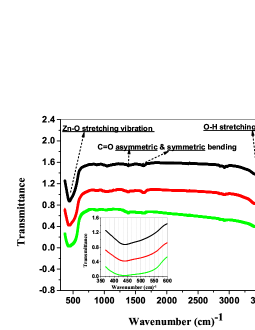
FT-IR spectra for different concentrations of silver doping in the range of 300-4000 were recorded and the results can be seen in Fig. 3. Enlarged position of the first absorption band is shown in the inset. Sharp peak was observed in 440 , which could be attributed to the Zn-O stretching vibration mode 26. A wide peak was in the range of 3020-3650 that was related to the presence of hydroxyl ions (OH) in the ZnO:Ag system. The symmetric and asymmetric bending modes of C=O bonds were in 1580 and 1410 , while the peak located at 2860 and 2950 was related to symmetric and asymmetric C-H stretching bonds, respectively 22. There were some bands originated from the presence of water moisture and carbon dioxide in the air in the process of making pellet. The absorption band at 1020 could be attributed to bending vibrational modes 27. According to Fig. 3, a slight shift with increasing silver (Ag) is visible. The shift in the position of the band toward lower frequencies can be associated with changes in bond length due to the partial substitution of ion at the ZnO lattice 28.
| Binding Energy@ Area | ||||||
|---|---|---|---|---|---|---|
| Sample | ||||||
| A | 1044.81@1.179 | 1021.67@1.835 | 530.01@0.863 | 531.75@0.906 | - | - |
| C | 1044.56@1.296 | 1021.55@1.801 | 529.64@0.604 | 531.38@1.235 | 372.66@0.707 | 366.52@0.616 |
III.3 XPS results
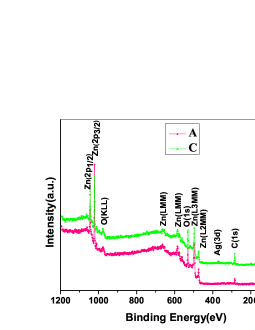
To determine the elements and chemical-bonding state of the compounds in the nanoparticles, the XPS analysis of the samples was studied. It should be noted that the XPS curves were fitted using XPSPEAK 4.1 software. The survey and core-shell level XPS spectra of Zn-2p, O-1s, and Ag-3d as well as valance band of ZnO and silver-doped ZnO nanoparticles are shown in Fig. 4. In the survey scan spectrum, Zn, O, C, and Ag peaks were characterized, as can be seen in Fig. 4 (a). The carbon present in the samples was presumably due to acetate vestige 29 and/or carbon adsorption process present in ambient conditions 30; 31.
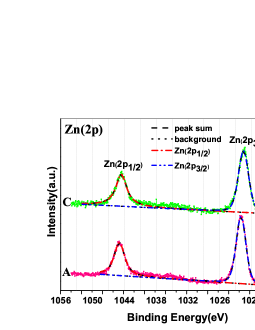
Symmetrical peaks are visible in Fig. 4(b) located at 1044.81 and 1021.67 for the sample of pure zinc oxide ascribed to and , respectively 32. The splitting of Zn-2p states was about 23 which was induced from the powerful spin-orbit coupling. These numbers were different from the binding energy quantity of stoichiometric ZnO (1045.1 for and 1022.1 for ), which can be attributed to the change of charge transfer from to due to the existence of vacancies 33. According to Table 2 and Fig. 4(b), the location of peaks was shifted toward the lower binding energy by silver doping. These peaks could confirm the wurtzite structure and mode of Zn atom on the samples 34. Therefore, due to the charge transfer in the binding energy of XPS spectrum, it can be deduced that the Zn-2p peak shift indicates that oxygen deficiency is the dominant factor versus Zn deficiency in the doped samples in contrast to the pure one 33.
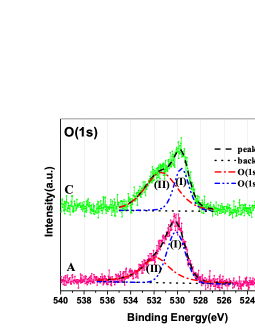
Fig. 4(c) shows the internal levels of oxygen in both of the nanoparticles. It is clearly seen that the O-1s curve was asymmetric; hence, they were fitted with two Gaussian peaks (as I and II) symmetrically. There were two different types of oxygen groups in the samples. The peak (I) was located in the lower binding energy in comparison with the peak (II), which was dedicated to ions of bonding at crystal lattice 35. The peak (II) was related to the hydroxyl group adsorption due to structural defects 30; these groups could play a major role in the photocatalytic activity and increase the photocatalytic activity 36 because of preventing from the recombination of electron-hole pairs. Silver doping in ZnO led to a shift in the O-1s spectrum toward lower binding energy. The atomic ratio of hydroxyl group (II) to total oxygen was calculated for pure ZnO, which was equal to and increased by using Ag doping. So, the photocatalytic activity should be increased by silver addition process. Also, decreasing the binding energy of the Zn-2p and O-1s levels with silver doping could be due to the reduction of oxygen vacancy. Decrease in the ratio of in the present XPS results for the doped samples compared to the pure sample confirmed the reduced the density of oxygen defects 37.
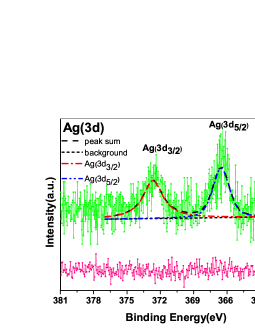
The chemical state of Ag element was characterized by examining Ag-3d levels in Fig. 4(d). The and peaks were split to about the 6 that showed the metallic condition of silver in the present synthesised samples 38; 39. Lupan et al. 11 and Khosravi et al. 40 have revealed the presence of two different components, which could be attributed to either metallic Ag or and to a Ag-Zn-O ternary compound. Interestingly, the binding energy of Ag-3d for the doped sample compared to the binding energy of silver bulk sample (368.3 for and 374.3 for 41) was significantly shifted towards lower binding energy. Thongsuriwong et al. 42 observed a similar behavior in Ag 3d spectra for Ag-doped ZnO thin films. This shift showed the electron movement from metallic Ag levels to ZnO nanoparticles and the formation of silver with unit valance. The interaction between silver and ZnO nanoparticles was also proposed, which could regulate the position of Fermi level of silver and zinc oxide nanoparticles and result in the formation of a new Fermi level for metallic silver. Free electrons above the new Fermi level might be tunnelled to the conduction band, because the conduction band of ZnO was empty 37. As mentioned before, in the present XPS patterns, Ag-3d binding energy was shifted to lower binding energy which can be explained by two processes: the first process is that the binding energy of the unit valance silver is much lower than the zero valance silver 29 and the second one is due to the formation of an oxide layer on the surface of silver particles 33, which can be identified by the XRD analysis. Due to the high electronegativity of Ag than Zn, electron transfer was assumed to occur from Zn to the Ag particles, suggesting that the chemical bond between ZnO and Ag is one reason for silver effect in controlling defects at ZnO crystal lattice.
III.4 Optical studies
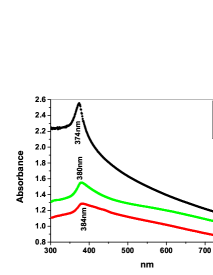
Optical absorption spectra of the samples were measured by UV-vis spectrophotometer in the range 300-800 nm. UV-vis absorption spectrum primarily represents the available change in the energy gap 43. Fig. 5 shows the UV-vis spectra of the ZnO:Ag nanoparticles. Pure ZnO nanoparticles indicated the strong UV absorption edge at 374 nm that could be related to the wurtzite crystal structure of ZnO 31. Silver adding to the ZnO nanoparticles moved the absorption edge toward the major wavelength (red shift). Changes in the absorption peaks, due to doping, showed changes in the band structure. The shift of the absorption edge represented the change in the particle energy gap 44.
The optical energy gap of the nanoparticles was obtained from drawing the graph of versus energy, according to equation. In this relation, A is absorption, k is constant, h is Planck’s constant, is light frequency, n = 1 for direct electronic transition, n = 4 for indirect electron transition and is energy gap 45.
The A sample’s optical energy gap was 3.25 that was smaller than the energy gap of the bulk samples of ZnO. With increasing the amount of silver, the energy gap decreased from 3.25 for the pure sample (x=0) to 3.18 for the Ag-doped sample (x=0.07), as shown in Table 3. The increase of the energy gap for ZnO doped with donor is commonly observed, while reducing the energy gap of ZnO doped with acceptor has been reported 46. Decreasing the energy gap can be related to the presence of p-type conductivity in the silver-doped ZnO nanoparticles. Silver doping in ZnO provides the impurity band in the energy gap, which could be due to the formation of the p-type in this substance. It should be mentioned that this reduction in energy gap led to increase efficiency in the use of these materials in optoelectronic devices 46.
| Sample | Band gap | |
|---|---|---|
| A | 374 | 3.25 |
| B | 384 | 3.21 |
| C | 380 | 3.18 |
Further information about the optical properties of ZnO can be received from PL spectra. Information about the crystal modality, structural defects such as oxygen vacancy, Zn interstitials,… and surface properties of particles can be obtained from PL spectra 23.
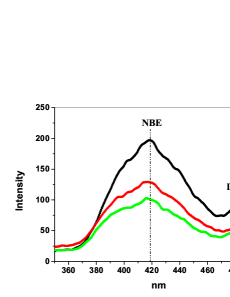
Fig. 6 shows the PL spectra of ZnO doped with silver and pure ZnO nanoparticles. A radiation band at the center of the UV spectral range around 418 nm for all the samples can be observed. The UV radiation is usually attributed to the near band edge (NBE) emission due to free exciton recombination 32. No significant change was observed in the position of this ultraviolet band with silver doping. The decrease in UV intensity was due to the interactions between the excited ZnO nanoparticles and Ag particles in the grain boundaries. These kinds of interactions via the Schottky contact, metal-semiconductor diode effect, decrease the recombination of electrons and holes generated from UV light irradiation 47; 23 and improved the photocatalytic activities 48.
On the other hand, reduction in the intensity of UV radiation was due to the interstitial Ag atoms at ZnO lattice and created a large amount of defects, as confirmed by Zeferino et al. 49. Dissimilar results for the annealing effect on the PL properties of Ag-doped ZnO nanowires were reported by Yong et al. 50. They observed the increase in UV intensity that was attributed to the substitution of Zn atom sites by Ag atoms. The present experimental results in Fig. 6 displayed deep level emissions (DLE) at about 480 nm in the visible region. This multicomponent visible emission in ZnO has been frequently ascribed to several intrinsic and extrinsic defects. DLE or blue radiation is due to electron recombination in oxygen vacancy with a hole in the valence band 51. By increasing Ag concentration, the intensity of DLE decreased. The reduction of DLE with Ag doping represented a decline in the defects and improved crystallization ZnO 12; 32.
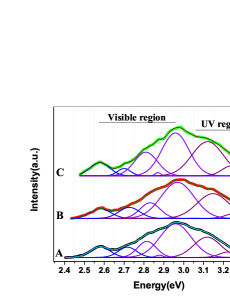
To better understand the role of Ag doping in the optical properties, Gaussian fitting was performed on PL spectra. Multiple PL peaks in the energy region of the absorption edge were observed in many ZnO nanostructures. Understanding the origin of the PL peak was required to study the optical properties of ZnO nanostructures and sketch ZnO-based opto-electronics tools. PL spectra’s Gaussian fitting for pure and silver-doped ZnO nanoparticles is shown in Fig. 7. The first band on 2.58 as a blue irradiance was reported due to the electron transition between Zn interstitials and Zn vacancy states 52; 49 which was in agreement with the calculated energy levels of defects in ZnO by Kohan et al. 53 and showed the existence of Zn vacancies in the samples, while oxygen defects constitute deep donor levels in the band gap 54. Band located at 2.74 was blue radiation that was attributed to the Zn vacancy defects 55. Radiant bands on 2.95, 2.88, and 2.81 were violet radiation. The mechanism of this radiation can be questioned: the emission mechanism is still unknown and researchers have related it to defects of Zn interstitials or Zn vacancy defects 52. The two peaks located at 3.24 and 3.12 were UV near absorption edge radiation due to free exciton recombination. The NBE emission in UV region was shifted which represented the variation of the band gap.
III.5 Studying photocatalytic activity
The purpose of this analysis was the degradation of methyl violet. In the industry, methyl violet is entered as a pollutant into groundwater and its destruction helps to remove pollutants. When ZnO nanoparticles are used to remove indissoluble chemicals in diverse applications, surface properties such as surface area, oxygen vacancy, and hydroxyl ions play an important role 56.
The results of photocatalytic measurements of the ZnO:Ag nanoparticles are shown in Fig. 8. Pure ZnO nanoparticles showed a significant photocatalytic activity. It can be seen that the photocatalytic activity of the ZnO nanoparticles was improved by silver doping with optimum 2 , which may be related to the oxygen vacancy defect concentration in different samples. In the C sample compared with the B one, the Zn vacancies were more dominant than the oxygen vacancies due to Ag presence on grain boundaries and consequently lack of Zn atoms in the bulk region. So, increasing Zn vacancies accompanied by oxygen vacancies could be responsible for the degradation process. According to these studies, it can be concluded that the photocatalytic activity of the ZnO nanoparticles increases by Ag doping and thereby incurs the increased surface area and increased oxygen defects. The reaction between conduction-band electrons and oxygen in the solution could generate the reactive oxygen species which is responsible for the color decolorisation 13 and its value increases with silver doping. As a result, the increase of silver improves the photocatalytic activity of the ZnO nanoparticles .
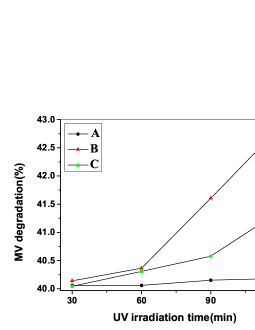
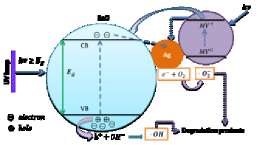
Fig. 9 schematically explains the mechanism of photocatalytic process on ZnO:Ag nanoparticles. In the dark, by dispersing ZnO:Ag nanoparticles in the MV solution, the surface electrons of the Ag nanoparticles were transferred to the MV dye 37. The valance band electrons in these nanoparticles under UV radiation with the photons of energy greater than or equal to ZnO band gap () can be excited to the conduction band producing the equal number of holes () in the valance band, simultaneously. Because the conduction band energy level of ZnO nanoparticles is higher than that of the Fermi level of ZnO:Ag nanoparticles, electrons can flow from ZnO nanoparticles to Ag nanoparticles 57. So, oxygen vacancy defects and Ag nanoparticles on the surface of ZnO nanoparticles trap electrons and prevents the recombination of pairs 14. Also, UV radiation excites the dye molecules ( to ). These MV molecules transfer electrons to the conduction band (CB) of ZnO ( to CB of ZnO) and the Fermi level of Ag ( to Ag). Then CB electrons react with dissolved oxygen in the solution to produce superoxide radicals(), while the valance band (VB) holes react with hydroxide ions for the production of hydroxyl radicals(). Both of these radicals are responsible for the decolorization of MV dye 15; 58. Also, the energy barrier of the Ag-semiconductor junction prevented electron-hole recombination to separate photogenerated charges, effectively 47.
III.6 Ab initio calculation of Ag-doped ZnO
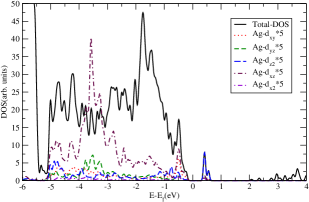
A 32 orthorhombic wurtzite supercell of ZnO:Ag (16 oxygen atoms, 15 Zinc atoms and an atom of silver substituting Zn) corresponding to a nominal Ag doping concentration of 6.25 was studied by the density of states. First principles calculations based on density functional theory were carried out using the HSE hybrid exchange-correlation functional at the level of HSE03 59. Sampling a 886 -centered -points mesh in the Brillouin zone was done for the calculation. Hybrid functional correction in these calculations was seen to slightly reduce from 6.98 eV in the density functional theory (DFT) ground state to 6.01 eV in the HSE, while forbidden gap was improved to 2.24 eV compared to 0.78 eV in the conventional GGA-DFT calculations.
The present HSE calculations showed a deep level in the band gap of the single crystal which explained the n-type conductivity due to Ag doping. Hybridization between Ag-4d and O-2p levels led to this deep level above the valance band maximum (VBM). Indeed, this deep level originated from Ag()-O(2p) repulsion which pushed the Ag orbital to higher energies around 0.6 eV above VBM. So, the existence of the deep levels was n-type conductivity formation proof in pure Ag-doped ZnO, while grain boundaries in the powder samples can prepare shallow levels as acceptor p-type conductivity centers as found in these samples 60.
IV Conclusion
In conclusion, the optical, structural and photocatalytic properties of Ag-doped ZnO nanoparticles were checked. XRD analysis showed that the samples were in the hexagonal-wurtzite phase. Also, the XRD and XPS measurements confirmed the presence of silver metallic phase in the nanoparticles. The density functional theory calculation predicted a deep level in the band gap of the single crystal which explained the n-type conductivity due to Ag doping. In general, in the powder samples, the grain boundary and metallic Ag on the grain boundaries were found to prepare shallow levels as a smoking gun for p-type conductivity. Optical absorption measurements indicated a red shift in the absorption band edge by silver doping. This study suggested that silver doping reduced the energy gap and controlled the luminescence properties; thus, it produced the p-type conductivity. This p-type nature can be used in the optoelectronic industry.
The photocatalytic activity of the ZnO nanoparticles were improved by Ag doping that was confirmed by XPS analysis. Also, decolorisation efficiency of methyl violet depended on the amount of silver.
V ACKNOWLEDGMENTS
The authors would like to thank Dr. Mehdi Ranjbar, Dr. Mehran Ghiaci and Isfahan University of Technology for supporting this project.
References
- (1) C. D. Pemmaraju, R. Hanafin, T. Archer, H. B. Braun, S. Sanvito, Impurity-ion pair induced high-temperature ferromagnetism in co-doped zno, Phys. Rev. B 78 (2008) 054428. doi:10.1103/PhysRevB.78.054428.
- (2) I. A. Sarsari, C. D. Pemmaraju, H. Salamati, S. Sanvito, Many-body quasiparticle spectrum of co-doped zno: A gw perspective, Phys. Rev. B 87 (2013) 245118. doi:10.1103/PhysRevB.87.245118.
- (3) A. Tsukazaki, A. Ohtomo, T. Onuma, M. Ohtani, T. Makino, M. Sumiya, K. Ohtani, S. F. Chichibu, S. Fuke, Y. Segawa, et al., Repeated temperature modulation epitaxy for p-type doping and light-emitting diode based on zno, Nature materials 4 (1) (2004) 42–46.
- (4) Ü. Özgür, Y. I. Alivov, C. Liu, A. Teke, M. Reshchikov, S. Doğan, V. Avrutin, S.-J. Cho, H. Morkoc, A comprehensive review of zno materials and devices, Journal of applied physics 98 (4) (2005) 041301.
- (5) M. Ahmad, J. Zhao, J. Iqbal, W. Miao, L. Xie, R. Mo, J. Zhu, Conductivity enhancement by slight indium doping in zno nanowires for optoelectronic applications, Journal of Physics D: Applied Physics 42 (16) (2009) 165406.
- (6) S. T. Teklemichael, W. H. Oo, M. McCluskey, E. D. Walter, D. W. Hoyt, Acceptors in zno nanocrystals, Applied Physics Letters 98 (23) (2011) 232112.
- (7) D. Sahu, N. Panda, B. Acharya, A. Panda, Enhanced uv absorbance and photoluminescence properties of ultrasound assisted synthesized gold doped zno nanorods, Optical Materials 36 (8) (2014) 1402–1407.
- (8) Y. Yan, M. Al-Jassim, S.-H. Wei, Doping of zno by group-ib elements, Applied physics letters 89 (18) (2006) 181912–181912.
- (9) Y. Ma, G. T. Du, S. R. Yang, Z. T. Li, B. J. Zhao, X. T. Yang, T. P. Yang, Y. T. Zhang, D. L. Liu, Control of conductivity type in undoped zno thin films grown by metalorganic vapor phase epitaxy, Journal of Applied Physics 95 (11).
- (10) M. Thomas, W. Sun, J. Cui, Mechanism of ag doping in zno nanowires by electrodeposition: experimental and theoretical insights, The Journal of Physical Chemistry C 116 (10) (2012) 6383–6391.
- (11) O. Lupan, L. Chow, L. K. Ono, B. R. Cuenya, G. Chai, H. Khallaf, S. Park, A. Schulte, Synthesis and characterization of ag-or sb-doped zno nanorods by a facile hydrothermal route, The Journal of Physical Chemistry C 114 (29) (2010) 12401–12408.
- (12) C. Karunakaran, V. Rajeswari, P. Gomathisankar, Optical, electrical, photocatalytic, and bactericidal properties of microwave synthesized nanocrystalline ag-zno and zno, Solid State Sciences 13 (5) (2011) 923–928.
- (13) P. Amornpitoksuk, S. Suwanboon, S. Sangkanu, A. Sukhoom, N. Muensit, J. Baltrusaitis, Synthesis, characterization, photocatalytic and antibacterial activities of ag-doped zno powders modified with a diblock copolymer, Powder Technology 219 (2012) 158–164.
- (14) T. Chen, Y. Zheng, J.-M. Lin, G. Chen, Study on the photocatalytic degradation of methyl orange in water using ag/zno as catalyst by liquid chromatography electrospray ionization ion-trap mass spectrometry, Journal of the American Society for Mass Spectrometry 19 (7) (2008) 997–1003.
-
(15)
R. Kumar, D. Rana, A. Umar, P. Sharma, S. Chauhan, M. S. Chauhan,
Ag-doped
zno nanoellipsoids: Potential scaffold for photocatalytic and sensing
applications, Talanta (0) (2015) –.
URL http://www.sciencedirect.com/science/article/pii/S0039914015000673 - (16) M. He, Y. Tian, D. Springer, I. Putra, G. Xing, E. Chia, S. Cheong, T. Wu, Polaronic transport and magnetism in ag-doped zno, Applied Physics Letters 99 (22) (2011) 222511.
- (17) A.-Y. Li, X.-D. Li, Q.-B. Lin, S.-Q. Wu, Z.-Z. Zhu, Half-metallic ferromagnetism in ag-doped zno: An¡ i¿ ab initio¡/i¿ study, Solid State Sciences 14 (7) (2012) 769–772.
- (18) J. Coey, M. Venkatesan, C. Fitzgerald, Donor impurity band exchange in dilute ferromagnetic oxides, Nature materials 4 (2) (2005) 173–179.
- (19) M. S. Rad, A. Kompany, A. K. Zak, M. Javidi, S. Mortazavi, Microleakage and antibacterial properties of zno and zno: Ag nanopowders prepared via a sol–gel method for endodontic sealer application, Journal of nanoparticle research 15 (9) (2013) 1–8.
- (20) C. Karunakaran, V. Rajeswari, P. Gomathisankar, Antibacterial and photocatalytic activities of sonochemically prepared zno and ag-zno, Journal of Alloys and Compounds 508 (2) (2010) 587–591.
- (21) R. Chauhan, A. Kumar, R. P. Chaudhary, Synthesis and characterization of silver doped zno nanoparticles, Archives of Applied Science Research 2 (5) (2010) 378–385.
- (22) S. Zandi, P. Kameli, H. Salamati, H. Ahmadvand, M. Hakimi, Microstructure and optical properties of zno nanoparticles prepared by a simple method, Physica B: Condensed Matter 406 (17) (2011) 3215–3218.
- (23) M. K. P. S. C. Georgekutty, Reenamole; Seery, A highly efficient ag-zno photocatalyst: Synthesis, properties, and mechanism, The Journal of Physical Chemistry C 112. doi:10.1021/jp802729a.
- (24) C. Karunakaran, V. Rajeswari, P. Gomathisankar, Combustion synthesis of zno and ag-doped zno and their bactericidal and photocatalytic activities, Superlattices and Microstructures 50 (3) (2011) 234–241.
- (25) O. Volnianska, P. Boguslawski, J. Kaczkowski, P. Jakubas, A. Jezierski, E. Kaminska, Theory of doping properties of ag acceptors in zno, Phys. Rev. B 80 (2009) 245212. doi:10.1103/PhysRevB.80.245212.
- (26) B. Babu, T. Aswani, G. T. Rao, R. J. Stella, B. Jayaraja, R. Ravikumar, Room temperature ferromagnetism and optical properties of cu¡ sup¿ 2+¡/sup¿ doped zno nanopowder by ultrasound assisted solid state reaction technique, Journal of Magnetism and Magnetic Materials 355 (2014) 76–80.
- (27) A. S. Lanje, S. J. Sharma, R. S. Ningthoujam, J.-S. Ahn, R. B. Pode, Low temperature dielectric studies of zinc oxide (zno) nanoparticles prepared by precipitation method, Advanced Powder Technology 24 (1) (2013) 331–335.
- (28) G. Murtaza, R. Ahmad, M. Rashid, M. Hassan, A. Hussnain, M. A. Khan, M. Ehsan ul Haq, M. Shafique, S. Riaz, Structural and magnetic studies on zr doped zno diluted magnetic semiconductor, Current Applied Physics 14 (2) (2014) 176–181.
-
(29)
M. Habibi, R. Sheibani,
Preparation and
characterization of nanocomposite zno ag thin film containing nano-sized ag
particles: influence of preheating, annealing temperature and silver content
on characteristics, Journal of Sol-Gel Science and Technology 54 (2) (2010)
195–202.
doi:10.1007/s10971-010-2177-x.
URL http://dx.doi.org/10.1007/s10971-010-2177-x - (30) R. Al-Gaashani, S. Radiman, A. Daud, N. Tabet, Y. Al-Douri, Xps and optical studies of different morphologies of zno nanostructures prepared by microwave methods, Ceramics International 39 (3) (2013) 2283–2292.
- (31) R. Wahab, S. Ansari, Y. Kim, H. Seo, G. Kim, G. Khang, H.-S. Shin, Low temperature solution synthesis and characterization of zno nano-flowers, Materials Research Bulletin 42 (9) (2007) 1640–1648.
- (32) Y. Jin, Q. Cui, K. Wang, J. Hao, Q. Wang, J. Zhang, Investigation of photoluminescence in undoped and ag-doped zno flowerlike nanocrystals, Journal of Applied Physics 109 (5) (2011) –.
- (33) R. K. Sahu, K. Ganguly, T. Mishra, M. Mishra, R. Ningthoujam, S. Roy, L. Pathak, Stabilization of intrinsic defects at high temperatures in zno nanoparticles by ag modification, Journal of colloid and interface science 366 (1) (2012) 8–15.
- (34) A. Meng, S. Sun, Z. Li, J. Han, Synthesis, characterization, and dispersion behavior of zno/ag nanocomposites, Advanced Powder Technology 24 (1) (2013) 224–228.
-
(35)
J. H. Zheng, J. L. Song, X. J. Li, Q. Jiang, J. S. Lian,
Experimental and
first-principle investigation of cu-doped zno ferromagnetic powders, Crystal
Research and Technology 46 (11) (2011) 1143–1148.
doi:10.1002/crat.201100397.
URL http://dx.doi.org/10.1002/crat.201100397 - (36) M. N. Chong, B. Jin, C. W. Chow, C. Saint, Recent developments in photocatalytic water treatment technology: a review, Water research 44 (10) (2010) 2997–3027.
- (37) Y. Zheng, L. Zheng, Y. Zhan, X. Lin, Q. Zheng, K. Wei, Ag/zno heterostructure nanocrystals: synthesis, characterization, and photocatalysis, Inorganic chemistry 46 (17) (2007) 6980–6986.
- (38) Y. Ao, J. Xu, D. Fu, C. Yuan, Preparation of ag-doped mesoporous titania and its enhanced photocatalytic activity under uv light irradiation, Journal of Physics and Chemistry of Solids 69 (11) (2008) 2660–2664.
- (39) M. Wu, B. Yang, Y. Lv, Z. Fu, J. Xu, T. Guo, Y. Zhao, Efficient one-pot synthesis of ag nanoparticles loaded on n-doped multiphase tio 2 hollow nanorod arrays with enhanced photocatalytic activity, Applied Surface Science 256 (23) (2010) 7125–7130.
- (40) S. Khosravi-Gandomani, R. Yousefi, F. Jamali-Sheini, N. M. Huang, Optical and electrical properties of p-type ag-doped zno nanostructures, Ceramics International 40 (6) (2014) 7957–7963.
- (41) Y. Zheng, C. Chen, Y. Zhan, X. Lin, Q. Zheng, K. Wei, J. Zhu, Photocatalytic activity of ag/zno heterostructure nanocatalyst: correlation between structure and property, The Journal of Physical Chemistry C 112 (29) (2008) 10773–10777.
- (42) K. Thongsuriwong, P. Amornpitoksuk, S. Suwanboon, Photocatalytic and antibacterial activities of ag-doped zno thin films prepared by a sol–gel dip-coating method, Journal of sol-gel science and technology 62 (3) (2012) 304–312.
- (43) B. Pal, P. K. Giri, High temperature ferromagnetism and optical properties of co doped zno nanoparticles, Journal of Applied Physics 108 (8) (2010) –.
- (44) M. Mittal, M. Sharma, O. Pandey, Uv–visible light induced photocatalytic studies of cu doped zno nanoparticles prepared by co-precipitation method, Solar Energy 110 (2014) 386–397.
- (45) T.-J. Whang, M.-T. Hsieh, H.-H. Chen, Visible-light photocatalytic degradation of methylene blue with laser-induced ag/zno nanoparticles, Applied Surface Science 258 (7) (2012) 2796–2801.
- (46) M. K. Gupta, N. Sinha, B. Kumar, p-type k-doped zno nanorods for optoelectronic applications, Journal of Applied Physics 109 (8) (2011) –.
- (47) L. Zhang, L. Du, X. Yu, S. Tan, X. Cai, P. Yang, Y. Gu, W. Mai, Significantly enhanced photocatalytic activities and charge separation mechanism of pd-decorated zno–graphene oxide nanocomposites, ACS applied materials & interfaces 6 (5) (2014) 3623–3629.
- (48) J. Liqiang, Q. Yichun, W. Baiqi, L. Shudan, J. Baojiang, Y. Libin, F. Wei, F. Honggang, S. Jiazhong, Review of photoluminescence performance of nano-sized semiconductor materials and its relationships with photocatalytic activity, Solar Energy Materials and Solar Cells 90 (12) (2006) 1773–1787.
- (49) R. S. Zeferino, M. B. Flores, U. Pal, Photoluminescence and raman scattering in ag-doped zno nanoparticles, Journal of Applied Physics 109 (1) (2011) 014308.
- (50) Z. Yong, C. Xian, F. Liguang, Y. Lianfang, L. Huihui, G. Yuefei, Effects of annealing on the structural and photoluminescent properties of ag-doped zno nanowires prepared by ion implantation, Plasma Science and Technology 15 (8) (2013) 817.
- (51) C. Karunakaran, J. Jayabharathi, K. Jayamoorthy, P. Vinayagamoorthy, Inhibition of fluorescence enhancement of benzimidazole derivative on doping zno with cu and ag, Journal of Photochemistry and Photobiology A: Chemistry 247 (2012) 16–23.
- (52) L. Xu, G. Zheng, J. Miao, J. Su, C. Zhang, H. Shen, L. Zhao, Regulating effect of sio¡ sub¿ 2¡/sub¿ interlayer on optical properties of zno thin films, Journal of Luminescence 136 (2013) 307–312.
- (53) A. Kohan, G. Ceder, D. Morgan, C. G. Van de Walle, First-principles study of native point defects in zno, Physical Review B 61 (22) (2000) 15019.
- (54) K. S. R. S. K. C. V. K. Jayakrishnan, R.; Mohanachandran, Zno thin films with blue emission grown using chemical spray pyrolysis, Materials Science in Semiconductor Processing 16. doi:10.1016/j.mssp.2012.10.003.
- (55) L. Xu, G. Zheng, H. Wu, J. Wang, F. Gu, J. Su, F. Xian, Z. Liu, Strong ultraviolet and violet emissions from zno/tio¡ sub¿ 2¡/sub¿ multilayer thin films, Optical Materials 35 (8) (2013) 1582–1586.
- (56) R. Wang, J. H. Xin, Y. Yang, H. Liu, L. Xu, J. Hu, The characteristics and photocatalytic activities of silver doped zno nanocrystallites, Applied Surface Science 227 (1) (2004) 312–317.
- (57) S. Kuriakose, V. Choudhary, B. Satpati, S. Mohapatra, Enhanced photocatalytic activity of ag–zno hybrid plasmonic nanostructures prepared by a facile wet chemical method, Beilstein journal of nanotechnology 5 (1) (2014) 639–650.
- (58) S. Kuriakose, V. Choudhary, B. Satpati, S. Mohapatra, Facile synthesis of ag–zno hybrid nanospindles for highly efficient photocatalytic degradation of methyl orange, Physical Chemistry Chemical Physics 16 (33) (2014) 17560–17568.
- (59) J. Heyd, G. E. Scuseria, M. Ernzerhof, Hybrid functionals based on a screened coulomb potential, The Journal of Chemical Physics 118 (18) (2003) 8207–8215.
- (60) W. Körner, C. Elsässer, First-principles density functional study of dopant elements at grain boundaries in zno, Phys. Rev. B 81 (2010) 085324. doi:10.1103/PhysRevB.81.085324.