Detection of two power-law tails in the probability distribution functions of massive GMCs
Abstract
We report the novel detection of complex high-column density tails in the probability distribution functions (PDFs) for three high-mass star-forming regions (CepOB3, MonR2, NGC6334), obtained from dust emission observed with Herschel. The low column density range can be fit with a lognormal distribution. A first power-law tail starts above an extinction (AV) of 6–14. It has a slope of =1.3–2 for the profile for an equivalent density distribution (spherical or cylindrical geometry), and is thus consistent with free-fall gravitational collapse. Above AV40, 60, and 140, we detect an excess that can be fitted by a flatter power law tail with 2. It correlates with the central regions of the cloud (ridges/hubs) of size 1 pc and densities above 104 cm-3. This excess may be caused by physical processes that slow down collapse and reduce the flow of mass towards higher densities. Possible are: 1. rotation, which introduces an angular momentum barrier, 2. increasing optical depth and weaker cooling, 3. magnetic fields, 4. geometrical effects, and 5. protostellar feedback. The excess/second power-law tail is closely linked to high-mass star-formation though it does not imply a universal column density threshold for the formation of (high-mass) stars.
keywords:
ISM:clouds1 Introduction
Probability distribution functions (PDFs) of column density (HI+H2) obtained using far-infrared emission of dust from Herschel111Herschel is an ESA space observatory with science instruments provided by European-led Principal Investigator consortia and with important participation from NASA. show a characteristic shape for low-mass star-forming regions: a lognormal distribution for low , commonly attributed to turbulence, and a single power-law tail for higher (e.g., Schneider et al., 2013, and references therein). This sort of PDF is also found for extinction maps (Kainulainen et al., 2009; Froebrich & Rowles, 2010). There is an ongoing discussion whether this power-law tail can be attributed to self-gravity (Klessen, 2000; Kritsuk et al., 2011; Federrath & Klessen, 2013; Girichidis et al., 2014; Schneider et al., 2013, 2015a) or is pressure-driven (Kainulainen et al., 2011).
In this Letter, we show that PDFs obtained from Herschel dust column density maps of giant molecular clouds (GMCs) not only show a clear lognormal plus power-law tail distribution but can also exhibit an excess at very high column densities that can be identified as a second, shallower power law. It seems that this discovery is restricted to the densest regions of massive molecular clouds (ridges/hubs), though not all those GMCs display this feature. The objective of this study is to report our detection and give some tentative explanations for its existance.
| UVmax | r | ||||||||||||
|---|---|---|---|---|---|---|---|---|---|---|---|---|---|
| [104 M⊙] | [104 M⊙] | [104 M⊙] | [Go] | [104Go] | [pc] | [104 cm-3] | |||||||
| CepOB3 | 10.0 | 1.7 (17%) | 0.052 (0.5%) | 40 | 8.0 | -3.80 | -1.18 | 1.53 | 1.26 | 2.70 | 1.85 | 0.29 | 6.0 |
| MonR2 | 1.4 | 0.54 (39%) | 0.21 (15%) | 52 | 4.8 | -2.10 | -1.05 | 1.95 | 1.48 | 2.90 | 1.95 | 0.65 | 1.9 |
| NGC6334 | 23.1 | 7.3 (32%) | 3.53 (15%) | 302 | 8.9 | -2.26 | -0.61 | 1.88 | 1.44 | 4.17 | 2.64 | 0.42 | 34.7 |
2 Observations
We make use of Herschel-derived column density () PDFs of three well-known GMCs. Data and PDFs of MonR2 at a distance of 0.83 kpc (Rayner et al., in prep, Didelon et al. 2015) and NGC6334 at a distance of 1.35 kpc (Russeil et al., 2013) were obtained within the HOBYS (Herschel imaging survey of OB Young Stellar objects) key program (Motte et al., 2010), while the data for CepOB3 (distance 0.7 kpc, PI Gutermuth) were taken from the Herschel (Pilbratt et al., 2010) archive. We selected these sources as examples because they cover different ranges in distance, mass, and UV-field (Table 1). Dust optical depths and temperatures were determined from a greybody fit to the surface brightness at the 160 m wavelength of PACS (Poglitsch et al., 2010) together with the 250, 350, and 500 m wavelengths of SPIRE (Griffin et al., 2010). For that, we assume a constant line-of-sight temperature for each pixel. The optical depths are then converted into H2 column densities taking a dust opacity = 0.1 (/300m)-β cm2/g with a fixed =2. Opacity variations were observed in Orion A (Roy et al., 2014) so that we arrive to a relative accuracy of 50% over the whole column density range covered in Herschel observations. For more details, we refer to Hill et al. (2011), Schneider et al. (2015a), and Könyves et al. (2015). For CepOB3, the PACS 160 m data contain nonfunctional bolometers. The resulting column density maps thus show a regular pattern with missing points, so that we fitted only the 250, 350, and 500 m data points. The angular resolution of the maps is 36′′, matched to the longest-wavelength Herschel band.
3 Probablity distribution functions of GMCs
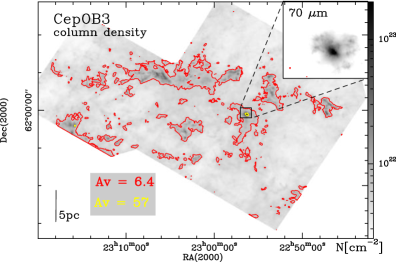
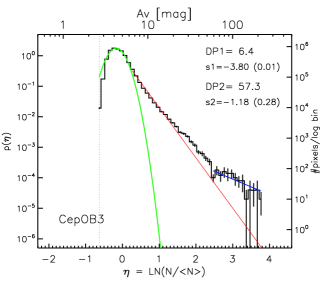
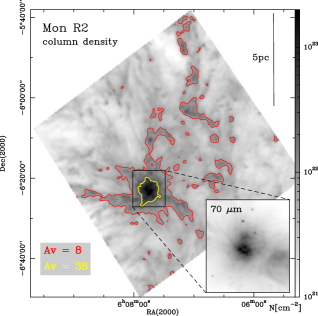
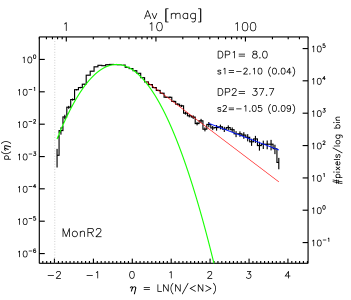
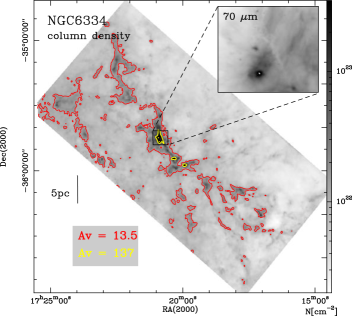
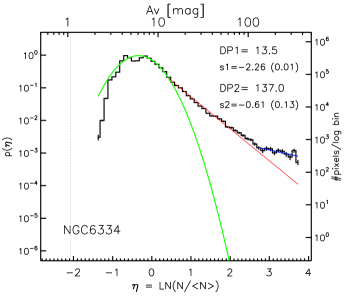
Figure 1 shows the column density maps and corresponding PDFs for the GMCs of our study. To describe the PDF, we use the notation p() with
| (1) |
with , as the dimensionless dispersion of the logarithmic field, and as the mean. We determine with a fit to the assumed lognormal low column density part of the PDF and the slopes from a linear regression power-law fit with to the high-density parts (see Schneider et al., 2015a, b, for more details). The intersection between lognormal and power-law tail regime lies at extinctions222For better comparison to other studies in the literature, we use the visual extinction value derived from the column density adopting N(H2)/AV=0.941021 cm-2 mag-1 (Bohlin et al., 1978). AV of around 6–8 for CepOB3 and MonR2 and AV14 for NGC6334. Starting at these values, we then fit a power-law to the distribution up to the break point where additional high AV excess becomes apparent, i.e., at AV40 for MonR2, AV60 for CepOB3, and AV140 for NGC6334. This spread in values shows that the shift to a shallower power law does not represent a universal threshold such as the one proposed for massive star formation around AV= 300 (Krumholz & McKee, 2008). The excess is clearly evident over a range of AV 40-200 for MonR2, AV 60-200 for CepOB3, and AV 140-300 for NGC6334. Although it can be fitted by a power-law333The reduced values of the second power law fits scatter around unity (1.050.28, 1.080.10, 2.430.16 for CepOB3, MonR2, NGC6334) indicating that the general assumption of a power-law dependence is justified., we cannot exclude the possibility that other distributions can fit the excess similarly well. In considering its physical interpretation in comparison to the first power-law tail, we keep the premise of a second power-law.
A word of caution is appropriate with regard to the PDF shape. Additional extinction due to foreground/background emission provokes that the width of the lognormal part becomes more narrow and the peak shifts to higher AV, while the slope(s) of the power-law tail(s) are steeper, compared to an undisturbed distribution (Schneider et al., 2015a). However, the slope of the second power-law tail is less affected because a contamination of a few AV does not significantly change the highest column densities. Contamination and projection effects, however, could still lead to substructure in the PDF, which might complicate the simple lognormal + power-law tail(s) representation. The accuracy of the lognormal fit is thus limited and the first deviation point is not well defined.
4 Spatial identification of the different PDF regimes
To identify the pixels that constitute the two power-law tails, we
outline in Fig. 1 with a red and yellow contour the
respective AV-thresholds. While the red contour traces mainly
filaments, the yellow contour encloses individual clumps with a
size scale of 1 pc, delimiting single (MonR2) or several
(CepOB3, NGC6334) star-forming center(s) of the GMCs. These central
regions correspond in their geometry and physical properties to what
was defined as ’ridges’ (or hubs) in massive clouds
(Hill et al., 2011; Hennemann et al., 2012), i.e., regions with high column density
(1023 cm-2) over small areas. The PACS 70 m images
(Fig. 1) indicate the stellar/protostellar activity in these
clumps: NGC6334 contains several H II regions and a few ultra-compact
(UC) H II regions (e.g., Russeil et al., 2013), MonR2 hosts several UC
H II regions and bipolar outflows (e.g., Fuente et al., 2010; Dierickx et al., 2015),
and CepOB3 includes an embedded massive cluster.
Table 1 lists the masses contained above the two break
points. For the high column density regime (yellow), we determine
also the equivalent radius , and the density . It becomes
obvious that most of the mass is constituted by the lower column
density regime, i.e., 83%, 61%, and 68% for CepOB3, MonR2, and
NGC6334, respectively. The mass above the first deviation point makes
up 15% to 39% of the complexes. The highest column density clumps
still account for a significant amout of mass in MonR2 and NGC6334
(both 15%), but a much smaller proportion (1%) for CepOB3. The
average density in these clumps is also high,
i.e., between 2104 cm-3 and 3.5105
cm-3. However, the existence of high density clumps/cores does
not by itself explain the second power law. In a region such as
Aquila, 15% of the total cloud mass resides in gas of density
larger than 104 cm-3 (Könyves et al., 2015), but only a single
power-law tail is observed (Schneider et al., 2013; André et al., 2014).
We
focus now on the analysis of the two power-law tails. From the slope
, the exponent for the density distribution
can be derived. For a spherical geometry,
representing clumps and cores, (Federrath & Klessen, 2013).
For a cylindrical one, characterizing filaments,
(Myers, 2015). Table 1 lists the values for both geometries for
the first and second tail. The values of for the first tail
range between 1.3 and 2, consistent with free-fall collapse, see
Schneider et al. (2013, 2015a, 2015b) and
Girichidis et al. (2014) for a detailed discussion of both filaments and
clumps/cores. The values of between 1.85 and 2.64
correspond very well to the range of values directly measured for the
B211/B213 filament in Taurus in Palmeirim et al. (2013).
Independent observational support for gravitational contraction comes
from molecular line observations of other GMCs that show spectral
infall signatures across ridges
(Schneider et al., 2010, 2015b; Galvan-Madrid et al., 2010; Peretto et al., 2013). These
studies show that the formation of high-mass stars requires a very
large mass accretion rate, provided by infall from merging filaments
and gravitational collapse of larger structures on parsec-scales.
For the excess – presuming it can be described by a
power-law – lies between 1.9 and 4.2. The assumption of a
spherical density distribution is probably more valid here,
because the corresponding regions are more compact and circular.
However, free-fall alone can not produce 2, only a
slowed-down collapse can lead to piling up high (column) densities on
very small spatial scales.
5 Significance of the excess
The PDF excess we observe for the GMCs in our study is not a systematic property of all GMCs. It is also seen in Rosette (Schneider et al., 2012), W43 and W51 (Schneider et al., in prep.), and W3 (Rivera-Ingraham et al., 2015), but there is no example of a low-mass star-forming cloud that displays this feature. Similarly, there are also massive clouds such as Carina and NGC3603 (Schneider et al., 2015a), Vela (Hill et al., 2011), or M16 (Hill et al., 2012) where no clear indication for this excess is found in the PDFs of the whole cloud. Therefore, it is unlikely that the excess is caused by a systematic bias introduced during the determination of the dust column density maps.
It is out of the scope of this paper to discuss in detail the general uncertainties related to the determination of the column density maps and we refer the reader to Roy et al. (2013, 2014) and Könyves et al. (2015). Nevertheless, we mention here briefly the biases that could potentially influence the inferred slope and are thus relevant for the results of this paper: 1) An overestimation of the line-of-sight temperature (assumed to be constant for the SED fit) leads to an underestimation of the column density (and the vice versa). 2) If dust opacity increases towards high column densities, then this could give rise to a steeper slope of the power-law tail at higher densities. 3) The adopted value of the specific dust opacity =2 could be too high in parts of the warm GMCs. A lower (higher) value of in the greybody fits leads to higher temperatures and thus lower (higher) column densities.
6 What causes the two power-law tails in the PDF?
Given that the excess/second power-law tail is only found in high-density (104-5 cm-3) star-forming clumps on size scales of 1 pc, i.e. in ridges/hubs, the physical process(es) in control of it must be active on small scales. It is evident that at these densities gravitational collapse of individual star-forming cores is involved, but it is not yet understood what produces the remarkable excess in column density.
We emphasize that in all cases the newly found excess is preceeded by a first power-law in the PDF consistent with the dominant effect of self-gravity found by numerical simulations (e.g., Vazquez-Semadeni et al., 2008; Kritsuk et al., 2011) as well as observations (e.g., Schneider et al., 2013, 2015a, 2015b). We thus expect the regions under consideration to contract in almost free-fall (Girichidis et al., 2014), i.e., gas at a density falls towards higher densities . Without any change in physical processes for higher densities, free-fall would proceed unimpeded and the power-law would extend indefinitely. Deviations from this idealised single power-law can be twofold. On the one hand the second excess could be due to a change in dynamics at high densities or due to observational effects. In the following we give some tentative explanations that, however, need more profound studies.
Any physical process that slows down the free-fall motions reduces the flow of mass towards higher densities. We stress that in this paradigm the deceleration of free-fall stems from within the centres of the cloud clumps. Processes acting from the outside like a hot ambient medium in which the cloud is embedded or large-scale colliding flows are unlikely to directly alter the PDF at the highest densities without altering the distribution at lower densities that is in the free-fall regime of the first power-law. Rotational effects (1.) have been invoked to explain excess at high densities seen in a density PDF obtained from an isothermal, self-gravitating supersonic turbulence simulation (Kritsuk et al., 2011). The spatial scales at which angular momentum is likely to dominate, however, are probably smaller than the resolution of the observations presented in this paper (0.1–0.25 pc). Likewise, thermodynamical effects of increasing thermal pressure due to shielding and reduced cooling (2.) is unlikely to dominate at the observed scales (e.g., Larson, 2005). The role of magnetic fields (3.) is rather unclear. It was shown that strong (Koertgen et al., 2015) or intermediate (Heitsch et al., 2001) magnetic fields, acting on a clump scale, slow down and can even completely prevent the star-formation process in magneto-hydrodynamic (MHD) simulations. If magnetic fields entirely prevent the collapse and star formation, the clouds are stable and will not show a first gravitationally dominated power-law in the PDF. Moderate and weak magnetic fields tend to reduce the degree of fragmentation but once a gravitational instability sets in, the fields are unlikely to stop further collapse and star formation (e.g., Ziegler, 2005; Banerjee et al., 2006). In this case, the N-PDF shows a power-law tail due to the gravitational collapse of the supercritical cores. Moreover, a change in dominant geometry (4.), i.e., from filamentary to spherical, could also provide an explanation. Longitudinal filament collapse on parsec scales reduces the mass transfer rate and dense gas is then piled up (Toala et al., 2012).
All of the above proposed mechanisms to produce column density excess should apply for all types of clouds – not only to the most massive GMCs. Therefore, high column density excesses should be observed more commonly, but this is not the case. Note, however, that the slope of the power-law tail(s) depends on the projection, i.e. the viewing angle, in which the cloud is being observed (Ballesteros-Paredes et al., 2011). In any case, a major difference between clouds forming only low-mass stars and those with high-mass star-formation is stellar feedback (5.). For example, additional compression by internal ionization due to an ultra-compact H II region can provoke a power-law tail with (Tremblin et al., 2014). (High-mass) outflows may also play a role. It was shown by Sadavoy et al. (2014) that the slope of the power-law PDF in different regions in Perseus depends on the local feedback from low-mass young stellar objects. A recent study of MonR2 (Dierickx et al., 2015) revealed a significant number of CO outflows in the central region that imprints on the velocity structure of the region. Not all clouds with protostellar feedback, however, also show a second power-law. If feedback does not efficiently couple to the surroundings and the dense gas, an excess in the PDF might not develop or might not be visible at the observed scales in the column density PDF.
7 Conclusions and outlook
At this point, it is not possible to give a final answer for our detection of excess/second power-law in the PDF of massive GMCs. Further studies are required to look into more detail which of the proposed processes can play a dominant role. Besides more sophisticated 3D hydrodynamic simualtions of star-forming regions a deeper understanding of how local thermal and dynamical properties are reflected in observations is needed.
Acknowledgements
Part of this work was supported by the ANR-11-BS56-010 “STARFICH” and the ERC Grant 291294 “ORISTARS”. N.S. and V.O. acknowledge support by the DFG (Os 177/2-1 and 177/2-2) and central funds of the DFG-priority program 1573 (ISM-SPP).
References
- André et al. (2014) André, Ph., et al., 2014, PPVI, Univ. of Arizon Press, 914, p.27
- Ballesteros-Paredes et al. (2011) Ballesteros-Paredes, et al., A., 2011, MNRAS, 416, 1436
- Banerjee et al. (2006) Banerjee, R., Pudritz, R., Anderson, D., 2006, MNRAS, 373, 1091
- Bohlin et al. (1978) Bohlin, R.C., Savage, B.D., Drake, J.F., 1978, ApJ 224, 132
- Dierickx et al. (2015) Dierickx, M., Jimenez-Serra, I., et al., 2015, ApJ, 803, 89
- Didelon et al. (2015) Didelon, P., Motte, F., Tremblin, P., et al., 2015, A&A in press
- Federrath & Klessen (2013) Federrath, C., Klessen, R. S., 2013, ApJ, 763, 51
- Froebrich & Rowles (2010) Froebrich, D., Rowles, J., 2010, MNRAS, 406, 1350
- Fuente et al. (2010) Fuente, A., Berné, O., Cernicharo, P. et al., 2010, A&A, 521, L23
- Galvan-Madrid et al. (2010) Galvan-Madrid, R., Zhang, Q., et al., 2010, ApJ, 725, 17
- Girichidis et al. (2014) Girichidis, P., et al., 2014, ApJ, 781, 91
- Griffin et al. (2010) Griffin, M., Abergel, A., Abreau, A., et al., 2010, A&A, 518, L3
- Heitsch et al. (2001) Heitsch, F., et al., 2001, ApJ, 547, 280
- Hennemann et al. (2012) Hennemann, M., Motte, F., et al., 2012, A&A, 543, L3
- Hill et al. (2011) Hill, T., Motte F., Didelon P., et al., 2011, A&A, 533, 94
- Hill et al. (2012) Hill, T., Motte F., Didelon P., et al., 2012, A&A, 542, 114
- Kainulainen et al. (2009) Kainulainen, J., Beuther, H., et al., 2009, A&A, 508, L35
- Kainulainen et al. (2011) Kainulainen, J., Beuther, H., et al., 2011, A&A, 530, 64
- Klessen (2000) Klessen, R. S., 2000, ApJ, 535, 869
- Könyves et al. (2015) Könyves, V., André Ph., et al., 2015, A&A, in press
- Koertgen et al. (2015) Koertgen, B., Banerjee, R., 2015, A&A sub., astro-ph: 1502.03306
- Kritsuk et al. (2011) Kritsuk, A.G., Norman, M.L., Wagner, R., 2011, ApJ, 727, L20
- Krumholz & McKee (2008) Krumholz, M., McKee, C., 2008, NATURE, 451, 1082
- Larson (2005) Larson, R.B., 2005, MNRAS, 359, L211
- Motte et al. (2010) Motte, F., Zavagno A., Bontemps S., et al., 2010, A&A, 518, L77
- Myers (2015) Myers, P., 2015, ApJ, in press, astro-ph:1505.01124
- Palmeirim et al. (2013) Palmeirim, P., André, Ph., Kirk, J., et al., 2013, A&A, 550, 38
- Peretto et al. (2013) Peretto, N., Fuller, G.A., et al., 2013, A&A, 555, 112
- Pilbratt et al. (2010) Pilbratt, G., et al., 2010, A&A 518, L1
- Poglitsch et al. (2010) Poglitsch, A., Waelkens, C., Geis, N., et al., 2010, A&A 518, L2
- Rivera-Ingraham et al. (2015) Rivera-Ingraham, A., et al., 2015, ApJ, in press
- Roccatagliata et al. (2013) Roccatagliata, V., Preibisch, T., et al., 2013, A&A, 554, 6
- Roy et al. (2013) Roy, A., André, Ph., Palmeirim, P., et al., 2013, A&A,
- Roy et al. (2014) Roy, A., Martin, P.G., Polychroni, D., et al., 2014, ApJ, 763, 55
- Russeil et al. (2013) Russeil, D., Schneider, N., et al., 2013, A&A, 554, 42
- Sadavoy et al. (2014) Sadavoy, S., Di Francesco, J., et al., 2014, ApJ, 787, L18
- Schneider et al. (2010) Schneider, N., Csengeri, T., et al., 2010, A&A, 520, 49
- Schneider et al. (2012) Schneider, N., Csengeri, T., et al., 2012, A&A, 540, L11
- Schneider et al. (2013) Schneider, N., André, P., Könyves, V., et al., 2013, ApJ, 766, L17
- Schneider et al. (2015a) Schneider, N., Ossenkopf, V., et al., 2015a, A&A, 575, 79
- Schneider et al. (2015b) Schneider, N., Csengeri, T., et al., 2015b, A&A, 578, 29
- Toala et al. (2012) Toala, J.A., Vázquez-Semadeni, E., et al., 2012, ApJ, 744, 190
- Tremblin et al. (2014) Tremblin, P., Schneider, N., et al., 2014, A&A, 564, 106
- Vazquez-Semadeni et al. (2008) Vazquez-Semadeni, E., et al., 2008, MNRAS, 390, 769
- Ziegler (2005) Ziegler, U., 2005, A&A, 435, 385