Inverse Relationship Between Molecular Diversity And Resource Abundances
Abstract
Cell reproduction involves replication of diverse molecule species, in contrast to simple replication system with fewer components. Here, we address why such diversity is sustained despite the efficiency of simple replication systems, using a cell model with catalytic reaction dynamics that grew by uptake of environmental resources. Limited resources led to increased diversity of components within the system, and the number of coexisting species increased with a negative power of the resource abundances. The diversity was explained from the optimum growth speed of the cell, determined by a tradeoff between the utility of diverse resources and the concentration onto fewer components to increase the reaction rate.
1 Introduction
Diverse molecule species coexist in a cell; these components are encapsulated in cellular compartments and synthesized with the aid of catalysts in order to achieve cell reproduction by taking up essential nutrients and resources from the environment. Indeed, huge diversity in components is achieved. However, when considering the theoretical minimum requirements of a cell, a simple cell consisting of fewer components has been shown to achieve a more rapid growth speed[1]. Importantly, the collision rate of a molecule with its catalyst will be increased if the composition of the cell includes fewer species that catalyze the replication of one another. For example, in cell models consisting of a catalytic reaction network[2, 3, 4, 5, 6, 7, 8, 9, 10], an autocatalytic set is formed in which a collection of molecular species that synthesizes themselves through catalysis by other molecules within the set, the presence of fewer components has been shown to achieve more rapid growth. Several and models have supported these findings[11, 12, 13]. In general, cells with simple reaction pathways consisting of only a few molecular species would achieve a higher reproduction rate than a complex system containing diverse components, and the strategy to increase compositional diversity with multiple pathways would be evolutionarily selected out. However, in the present cells, there is a huge diversity of molecules. Thus, a theoretical explanation of this diversity is needed in order to improve our understanding of biological systems.
In the experiments and theoretical models for the cells, it is implicitly assumed that resources for the synthesis of molecules are sufficiently abundant. As long as the resources are sufficiently available, simplification of the molecular components would be more favorable for reproduction than diversification. In contrast, if resources are limited, focusing on only a few components using specific resources may not be evolutionarily stable. Thus, because of resource limitation, cells with diverse components and multiple pathways that manage various resources to achieve growth would be more evolutionarily favorable. In fact, the presence of multiple pathways due to diversity of components stabilizes an evolving network[14] by ensuring that there are alternative routes to achieve reproduction. This is analogous to the selection theory of ecological population in which there is a tradeoff between increasing the intrinsic growth rate and the carrying capacity[15].
However, there is an important difference between molecule replication in a cell and individual replication in an ecosystem. A cell, an ensemble of molecules, reproduces itself, competes for growth, and is a unit for the selection, whereas ecosystem itself is not an object for selection. Here we are interested in a hierarchic growth system, in which cell growth and molecule replication have to be balanced. Indeed, we will show that such a balance leads to the diversity transition in molecular components with the decrease in resource abundances as well as a general scaling law between the diversity and resource abundances.
In the present paper, we study the possible relationships between compositional diversity and resource abundances, by investigating a simplified cell model consisting of a catalytic reaction network in which each molecule replicates by consuming respective resources. We first demonstrate that there is a certain threshold for resource abundances below which the compositional diversity, i.e., the number of coexisting chemical species is increased. This increase follows the negative power law of resource abundances. Importantly, we could explain this scaling relationship by the tradeoff between the increase in components for the use of diverse resources and the decrease in components to increase the reaction rate.
2 Model
For a cell to reproduce itself, all catalytic components have to be synthesized with the aid of catalysts. Thus a catalytic component is replicated with the aid of , while the component is replicated with the aid of some other component. Following this general requirement, Eigen introduced the hypercycle model, which consists of catalytic reaction [2]. Considering networks of such reactions, Kauffman introduced the concept of autocatalytic set, while a protocell model with such reaction networks has been investigated[5]. In this general scheme for a cell model with replicating molecules, however, resource molecules are not explicitly included, or in other words, resources are fully supplied.
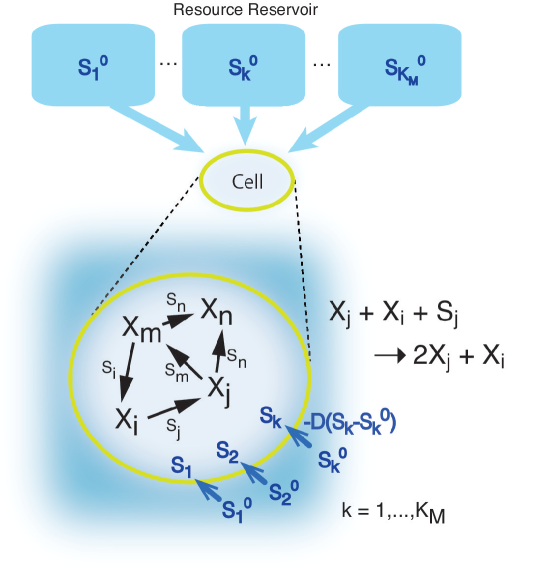
Here we modified the standard hypercycle model to include the resources. We adopted a cell model in which each molecule () was replicated, by consuming a corresponding resource ((see Fig. 1). cells were defined; each contains species of replicating molecules where some of species possibly have a null population. Molecules of each species were replicated with the aid of some other catalytic molecule , determined by a random catalytic reaction network, by consuming a predetermined resource , one of the supplied resource chemicals , as follows:
| (1) |
For this reaction to replicate , one resource molecule is needed, and the replication reaction does not occur if is less than one. The reaction coefficient is given by the catalytic activity randomly determined as of the molecule species . With each replication, error occurs with probability . This error corresponds to changes in some monomers in the polymer sequence and catalytic properties of the molecule. Here, for simplicity, for each replication of , the molecule is replaced by a different molecule () with equal probability where is the number of molecule species.
Each cell takes up resources () by diffusion from its respective resource reservoir. From external reservoirs of concentrations , the resources () are supplied into each cell by diffusion . controls the degree of the uptake rate because the resource supply is reduced by decreasing . We carried out stochastic simulations of the model, as detailed in Appendix.
A random catalytic reaction network was constructed as follows. For each molecule species, the density for the path of the catalytic reaction was given by (which was fixed at 0.2), such that each species had reactions on average. Once chosen, an identical reaction network was adopted during each simulation for all cells. Even though the underlying network did not change, each cell used only a part of the reaction pathways, depending on its composition(e.g., both and must be present in the cell for reaction (1) to occur). Autocatalytic reactions in which catalyzed the replication of itself were excluded from the catalytic network, and direct mutual connections were also excluded such that did not function as a catalyst for if was the catalyst for .
When the total number of molecules in each cell exceeded a given threshold , the cell divided into two cells and the molecules were randomly partitioned. One randomly chosen cell was removed from the system in order to fix the total number of cells at .
3 Results
3.1 Diversification of composition
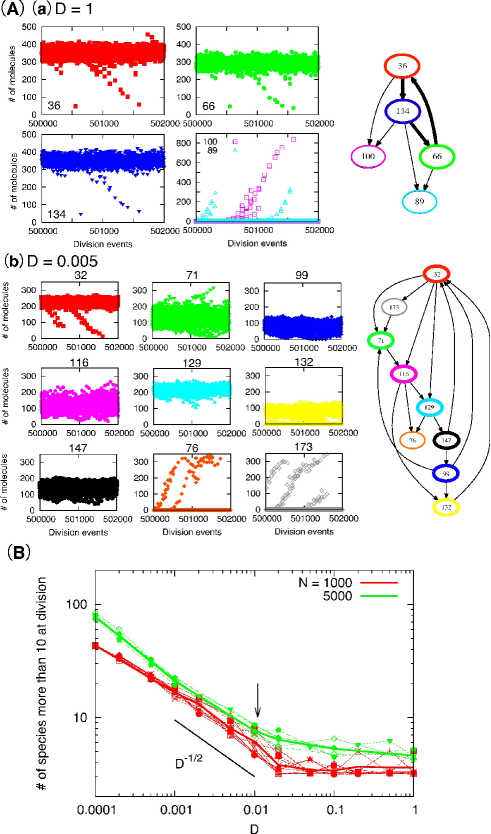
We investigated how diversity in composition changed with the uptake rate of the resources . When the resources were supplied at a sufficiently rapid rate (e.g., for ), three components typically dominated most of the composition(each representing approximately 1/3 of the molecule population; see Fig.2(A)(a)). Thus, the minimum hypercycle was formed by three components[3, 2] as shown in the right panel of Fig. 2(A)(a). The hypercycle established a recursively growing state, where the composition was robust against stochasticity in reactions and perturbations by the division processes. Most of the other molecular species were absent, while some species appeared due to replication error. Some parasitic species that were catalyzed by a member of the hypercycle but did not catalyze other members were found to increase in number on occasion[17, 18, 19, 20]. However, cells dominated by the parasitic molecules could not continue growth(see Fig. 1 in [16]). All dividing cells adopted this three-component hypercycle, and there was no compositional diversity; cells use the minimum reaction pathway to grow.
As decreases below a certain threshold , the number of molecular species increased, and multiple reaction pathways were utilized(Fig.2(A)(b)). Similar to the three-component hypercycle, the molecular species in this case also formed a mutually catalytic hypercycle, shown in Fig. 2(A)(b), such that every species in the network could be replicated with the aid of other species in the network. All dividing cells adopted approximately the same compositions. Moreover, cells dominated by parasites appeared on occasion, but could not survive (see Fig. 2 in [16]).
To quantitatively investigate this increase in the number of species, we show in Fig. 2(B) the number of major species(more than 10 copies at division) as a function of by using different underlying networks. Irrespective of the network samples, the number transits to increase at , and increases as decreases below this threshold. In contrast, for , cells were mainly composed of just three primary molecular species.
This transition was estimated by determining the point where the consumption rate of resources by the intracellular reactions reached the maximal inflow rate. Beyond this critical point, three species typically formed the hypercycle, with each species representing approximately 1/3 of the molecule population. Within this system, the probability that a species encountered with its catalyst was approximately , and the reaction can occur with a rate . On the other hand, the maximum inflow rate of resources was . Thus, the balance point was estimated as . In our simulation setup, the was set at , but as cells with higher growth exhibited improved survival, the for molecules present in cells was shifted to a higher range; see Fig. 3 in [16]). Likewise, was shifted to higher values; Fig. 4 in [16]). Hence, the critical point could be approximated as , consistent with the transition in our simulation results.
3.2 Coexistence in simple mutually-catalytic reactions
The transition to diversity with multiple pathways was then analyzed in terms of dynamical systems. As an illustration, we considered simpler reactions where two sets of mutually catalytic molecules , , and , were initially within the cells. The molecular species mutually catalyzed the replication of each other to form a minimal hypercycle as follows:
| (2) |
and
| (3) |
We denoted the intrinsic catalytic activities of , , and as , , and , respectively. Each reaction to replicate , , and consumed the resources , , and , respectively.
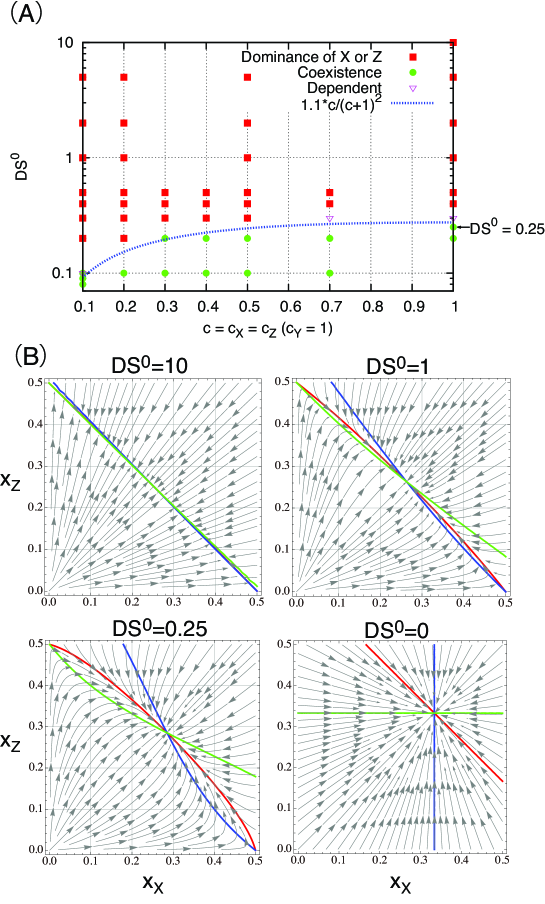
The results of stochastic simulations (Fig. 3(A)) showed that transitions from selection of either or to coexistence of and , together with , occurred with decreasing . For example, by setting , we showed that the transition point was approximately equal to the balance point where , where for was the concentration of the corresponding component. When the resources were sufficiently abundant, either or was selected in a steady state, given by and . Then, the consumption rate of the resource was given as . Thus, the transition point was estimated as , which agreed well with the simulation(see the dotted curve in Fig. 3(A)).
This transition was also clarified by changes in the flow and nullclines in dynamical systems of rate equations for and resources, as shown in Fig. 3(B) and described in 1 of [16]. To analyze this system using rate equations, we assumed that volume of the system was constant and that the total number of molecules was fixed. Then, the increase in molecular species could be written as
| (4) |
and the increases for and could be written as,
| (5) |
where is the concentration of species (), and is introduced to fix the total number of molecules, such that . By substituting the steady-state value of each resource into the rate equations, the nullclines and flow in the - plane were obtained as shown in Fig. 3(B).
For sufficiently large values of , the nullclines for , , and merged to a single line, and the solution was neutral on the line. In this case, even if both and were initially present, the system converged on either or by fluctuations due to stochasticity in the reaction: thus either or remained. As was decreased, the nullclines split and crossed at a single point. This point corresponded to coexistence of both and , and this bifurcation occurred at in Fig. 3(B)), consistent with our estimates thus far.
3.3 Scaling behavior and optimum number of molecule species
Below the transition to coexistence of multiple paths, further resource limitation, as shown in Fig. 2(B), increased the compositional diversity with a negative power of . To explain this scaling relationship, we noted the existence of the following tradeoff: increasing the diversity in species enabled cells to utilize more resource species for their own growth, but decreased the reaction rate resulting from the collision of molecules with their catalysts. This tradeoff yielded the optimum number of remaining molecule species.
We estimate the optimal value for the remaining species as , which achieved maximal growth under conditions of resource limitation. Here, we assumed that was sufficiently large to assure that could be increased to reach the optimum value. Considering that a fixed set of molecule species mutually catalyzed the replication of each other, the temporal evolution of , the number of a species , was written as . Assuming that the concentrations of molecules were approximately the same, the concentration was proportional to . Therefore the increase in the number of molecules depended on the number of remaining species s as follows:
| (6) |
In the steady-state, the resource has a value defined as
If we assume that for all , the growth rate of the cell was defined as
Given and , the optimum value was obtained from as . Hence, as long as was sufficiently large to allow the above optimal value to be obtained, the scaling relationship was obtained, consistent with Fig. 2(B). 111Note that the nonlinearity of the catalytic reaction, , was essential for determining the optimum. In the linear reaction, i.e., , the may diverge such that the diversity would be increased as much as possible, i.e., .
For the estimate in eq. (6), we have excluded the possibility that each molecular species may have more catalyst species with the increase in the number of remaining species. Including this possibility, eq. (6) was replaced by , where the summation runs over all the catalysts for in the present species. Actually, the average number of catalysts for major molecules gradually increased as the resource was limited further(see Fig. 6 in [16]). Further corrections to the scaling relationship could be needed for much smaller values of resources(see 2 of [16]) 222 The estimation also assumed that the abundance of major molecule species were approximately equal, with a narrow distribution around a common value. This assumption is reasonable in our model because all the catalytic activities() and resource abundance() were of the same order; thus the number of each molecular species was approximately of the same order. However, if the abundance is more broadly distributed, e.g., by the power-law distribution using a different setup[8], the scaling exponent could be modified..
As an example that did not require the above correction for the catalyst number, we considered a one-dimensional ring of the mutually catalytic reaction,
with periodic boundary, i.e., denotes . In this case, the number of catalysts is two( and ) for each , irrespective of the number of present species in the cell. The number of species increased clearly with below the balance point (see 3 and Fig. 5 in [16]).
4 Summary and discussions
In summary, we showed that diversification of compositions occurred as a result of limitation of various resources, when the maximum inflow and consumption of resources were balanced. Using simple reactions, the transition was also clarified by changes of nullclines. In addition, a gradual increase in the number of molecular species was explained by estimating the optimum number of species to give the maximum growth speed of cells.
Although we used a cell model consisting of hypercycle networks, our ‘diversity transition’ is expected to be general for a cell system in which each component in a cell is replicated for its growth as a result of catalytic reactions, by consuming external resources. Then with the decrease in resource abundances, the diversity in intracellular components is increased. Hence, the origin of diverse components in a cell is explained.
Our study provided a first step to explaining how replicating entities of the catalytic reaction network model respond to limitations and diversify their composition. The importance of diversity even at the primitive stage of life has been emphasized by Dyson[4], while our study suggests the role of multiple resources in the intermediate stages from molecules to ecological population. By corresponding replication of each molecule species with biological species in an ecosystem, the present diversification might have some similarity with the studies in species diversification[21, 22, 23]. In spite of similarity, there is one important difference. In our study, cells, as an ensemble of molecules, reproduce and those with higher growth speed will be selected, whereas ecosystem itself is not a unit for reproduction and selection. Thus there is no direct pressure for a simple system with a higher reproduction rate. In our study, both molecules and cells are units for reproduction and selection. We expect that diversity transition with the decrease of resources is a general nature of such hierarchic reproduction systems.
In this study, we examined the compositional diversity of cells based on limitation of resources. However, competitions among cells may give rise to additional diversification; cellular phenotypes. Indeed, different types of cells utilizing different sets of molecular species have developed to allow cell growth to occur. In the case, the growth speed of cells and variations in cell compositions, allowing the cells to utilize different resources, will be also relevant for survival[24].
Appendix
Simulation methods
Simulations were carried out as follows. We introduced discrete simulation steps, as detained below. For each simulation step, we repeated the following procedures. For each cell , we chose two molecules from the cell. If the pair of molecules, and were a catalyst and a replicator( catalyzes the replication of ), the reaction occurred with the given probability(), if . denotes the resource to replicate assigned to each cell . When the reaction occurred, the new molecule of was added into the cell and one molecule of the corresponding resource was subtracted to make . Here, with a probability , a new molecule of , instead of , was added into the cell, resulting in a structural change. If the total number of molecules in a cell exceeded the threshold , the molecules were distributed into two daughter cells, while one cell, randomly chosen, was removed from the system. We also updated each to .
Acknowledgements
This work was supported by the Japan Society for the Promotion of Science. This work was also supported in part by the Platform for Dynamic Approaches to Living System from the Ministry of Education, Culture, Sports, Science, and Technology of Japan, and the Dynamical Micro-scale Reaction Environment Project of the Japan Science and Technology Agency.
References
- [1] S. Rasmussen, M. A. Bedau, L. Chen, D. Deamer, D. C. Krakauer, N. H. Packard, and P. F. Stadler, Protocells Bridging Nonliving and Living Matter, (MIT Press: Cambridge, MA, 2009).
- [2] M. Eigen and P. Schuster, The Hypercycle (Springer: New York, NY,1979).
- [3] M. Eigen, Steps Towards Life (Oxford University Press: Oxford, England, 1992).
- [4] F. Dyson, Origins of Life (Cambridge University Press: Cambridge, England, 1985).
- [5] S. A. Kauffman, J. Theor. Biol. 119, 1 (1986).
- [6] S. Jain and S. Krishna, Proc. Natl. Acad. Sci. U S A, 99, 2055 (2002).
- [7] D. Segre, D. Ben-Eli, and D. Lancet, Proc. Natl. Acad. Sci. U S A, 97, 4112 (2000).
- [8] C. Furusawa and K. Kaneko, Phys. Rev. Lett. 90, 088102 (2003).
- [9] K. Kaneko, Phys. Rev. E, 68, 031909(2003); Adv. Chem. Phys. 130, 543-98 (2005).
- [10] A. Kamimura and K. Kaneko, Phys. Rev. Lett, 105, 268103 (2010).
- [11] D. L. Kacian, D. R. Mills, F. R. Kramer, S. Spiegelman, Proc. Natl. Acad. Sci. USA., 69, 3038 (1972).
- [12] W. Fontana and L. W. Buss, Bull. Math. Biol., 56, 1 (1994).
- [13] R. S. Ray, In Artificial Life II, edited by C. G. Langton (Addison Wesley, Redwood City, CA, 1991), p. 371.
- [14] R. Mehrotra, V. Soni and S. Jain, J. R. Soc. Interface, 6, 793 (2009).
- [15] E. R. Pianka, American Naturalist, 104, 592 (1970).
- [16] See Supplementary Material.
- [17] J. Maynard-Smith, Nature, 280, 445 (1979).
- [18] E. Szathmary and L. Demeter, J. Theor. Biol. 128, 463 (1991).
- [19] S. Altmeyer and J. S. McCaskill, Phys. Rev. Lett. 86, 5819 (2001).
- [20] M. Boerlijst and M, P. Hogeweg, Physica D, 48, 17 (1991).
- [21] G Gause, The Struggle for Existence, (Williams & Wilkins; Baltimore, MD,1934).
- [22] D. Tilman, Proc. Natl. Acad. Sci. U S A, 101, 10854 (2004).
- [23] W. S. Harpole and D. Tilman, Nature, 446, 791 (2007).
- [24] A. Kamimura and K. Kaneko, J. Sys. Chem. 6, 5 (2015).