Test of Lightguides for the J-PET Detector
Jagiellonian University in Kraków
Faculty of Physics, Astronomy and Applied Computer Science
Dominika Alfs
Test of Lightguides for the J-PET Detector
Bachelor Thesis
Supervised by
dr Eryk Czerwiński
Institute of Physics
Division of Nuclear Physics
Kraków, 2015
Abstract
The aim of this work was to test the impact of the lightguides insertion in the J-PET detection system and to choose the best of available solutions. At the two strip J-PET test system a series of measurements was performed with different combinations concerning the length of the lightguides (3 mm and 3 cm) and scintillators (3, 15 and 30 cm), shape of lightguides (trapezoidal and cylindrical, with and without a cut matching the scintillator size) and optical connection between elements (optical gel and glue). It was proven that the insertion of the thin lightguide does not spoil the time resolution and the light output. Additionally, the correlation between the time resolution and the light output was confirmed.
Abstrakt
Celem tej pracy było sprawdzenie wpływu dołączenia światłowodów do systemu detekcyjnego J-PET oraz wybór najlepszego z dostępnych sposobów realizacji tego zagadnienia. Wykonano serię pomiarów z wykorzystaniem dwupaskowego testowego systemu J-PET, uwzględniając różne kombinacje długości światłowodów (3 mm i 3 cm), ich kształu (trapezoidalne i cylindryczne, gładkie oraz z wcięciami pasującymi do rozmiaru scyntylatorów) oraz połączenia optycznego na granicy elementów (żel optyczny oraz klej optyczny). Udowodniono, że dodanie cienkiego światłowodu nie pogarsza czasowej zdolności rozdzielczej oraz ilości uzyskiwanego światła. Dodatkowo potwierdzono także korelację pomiędzy tymi wielkościami.
Chapter 1 Motivation
Development of medical imaging is experiencing a lot of interest nowadays. Among the most popular techniques there are for example computed tomography (CT) [1], single photon emission computed tomography (SPECT) [2], magnetic resonance imaging (MRI) [3] and positron emission tomography (PET) [4]. New technologies has made it possible to come across the increasing need of creating more precise while less expensive systems.
One of the most promising techniques for further improvement is PET. As it is a non-invasive technique, PET is an invaluable tool for a variety of medical purposes: monitoring functions of certain organs, studying new drugs impact on organism and diagnostic processes in cardiology, oncology (including diagnosis of early stages of cancer) and even psychiatry.
Most common PET detectors are made of crystal scintillators arranged in a ring that surrounds the patient. However, this is an expensive solution: the size of the area covered with crystals is strongly limited by the cost of their production what not only decreases the detection efficiency but also makes it impossible to perform eg. full body examination within one scan.
The solution of these problems may become a strip PET. The basis of this idea is to replace crystals by the polymer scintillators which are significantly cheaper and easier to shape. This would not only decrease the price of the device but also allow to produce the detectors long enough to cover all of the patient’s body. The prototype of such a device named Jagiellonian-PET (J-PET) is currently under construction at the Jagiellonian University, Cracow [7, 8].
The arrangement of the scintillators and photomultipliers in J-PET is different than in PET. In case of PET each crystal detector is connected to a single photomultiplier, in J-PET there are two photomultipliers per single scintillator: one photomultiplier on each end of the strip.
Taking under consideration the J-PET mechanics and geometry, it appears crucial to provide a stable connection between the photomultiplier and the scintillator. The solution discussed in this work is the insertion of lightguides between the scintillator and the photomultiplier.
The goal of the performed investigation was to test the impact of the the lightguide usage in the two strip J-PET model and determine the most effective way of their application. The criteria of comparison were the time resolution and the light output of the signals.
Chapter 2 Introduction to Positron Emission Tomography
Unlike other medical imaging techniques, which provide the information about the location and shape of the physical structures in the body, PET provides information about their metabolism.
In order to be able to observe any metabolic processes the radiopharmaceutical must be injected inside the patient’s body. Radiopharmaceuticals are substances consisting of two main parts: a biologically active molecule and radionuclide (tracer) that undergoes a decay: , where stands for a nucleus of mass number and atomic number .
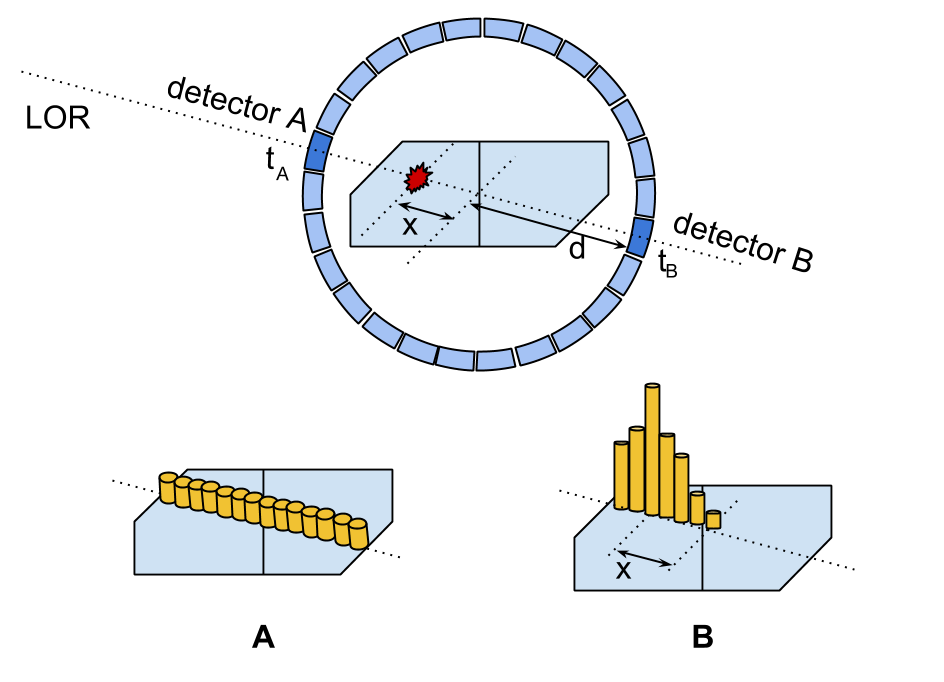
Biologically active molecule is responsible for distribution of the radiopharmaceutical inside the patient’s body. It usually contains glucose - a simple sugar which serves as a primary energy source in the human body metabolism processes. Within the illness development the cells perform intensive biochemical activity which corresponds to increased energy consumption. For example actively growing cancer cells cause the radiopharmaceutical to accumulate because of the faster rate of the glucose breakdown in comparison to healthy tissues. Positron emitted from the tracer travels a short distance loosing its kinetic energy. The exact length depends on the isotope, eg. for a positron of energy 640 keV emitted form 18F the distance in tissue is 2.4 mm [9]. Being almost at rest a positron can interact with an electron and an annihilation occurs. In over 99% of cases two gamma quanta of energies equal 511 keV are emitted [10] (Figure 2.1) and in rest of cases there are more than two gamma quanta emitted (but the probability quickly decreases with their number). When gamma quantum manages to reach the detector, it produces a burst of light in the scintillator which it hits. It is detected by the photomultiplier connected with this scintillator. In order to choose from all signals an interesting event, two signals need both to be: in the time coincidence and higher than some defined threshold. Single event provides enough information to calculate one line of response (LOR) which is the line connecting the hit positions of gamma quanta in scintillators (Figure 2.2). We claim that it is also the line along which the annihilation occurred. The place of radiopharmaceutical concentration is reconstructed by crossing the set of such lines.

A novel idea is to restrict the investigated LOR only to the area close to the point of annihilation by the analysis of differences in time of flight (TOF) of coincident photons. This approach is advantageous not only due to the image reconstruction fastening. It also causes the noise reduction and improves the sharpness of obtained images. There is a brief explanation of the TOF-PET method presented in the Figure 2.2.
The description above is only to explain the basic idea of the PET image reconstruction. Actually, it is a complicated process concerning measurement method and physical effects. More detailed description of the PET techniques can be found in [5, 6].
Chapter 3 Jagiellonian-PET
As all of the PET detectors for medical applications are based on the crystal scintillators, the idea of usage the organic ones is an entirely new approach [7]. Until now, they were not considered as an effective solution because of a low density and a small atomic number in comparison with the inorganic ones. Low density implies that some of gamma quanta do not interact within the volume of the scintillator and the detection becomes less effective. Small atomic number is responsible for a negligible probability of deposited energy transfer through the photoelectric effect. Nevertheless, the new PET has been designed in a way to reduce these drawbacks and take the advantage of other properties of organic scintillators [11, 12].
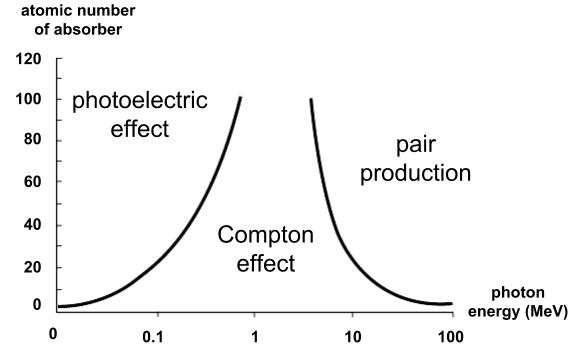
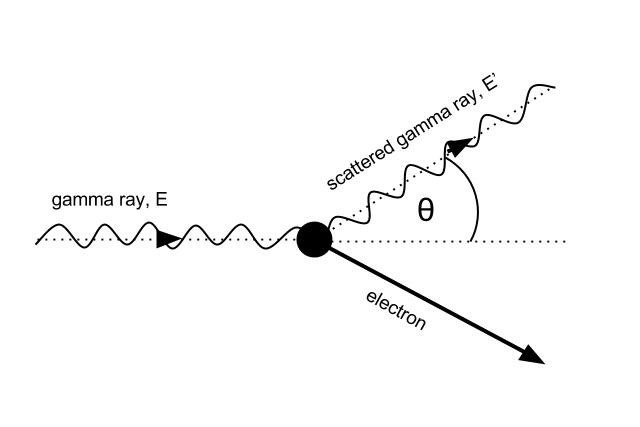
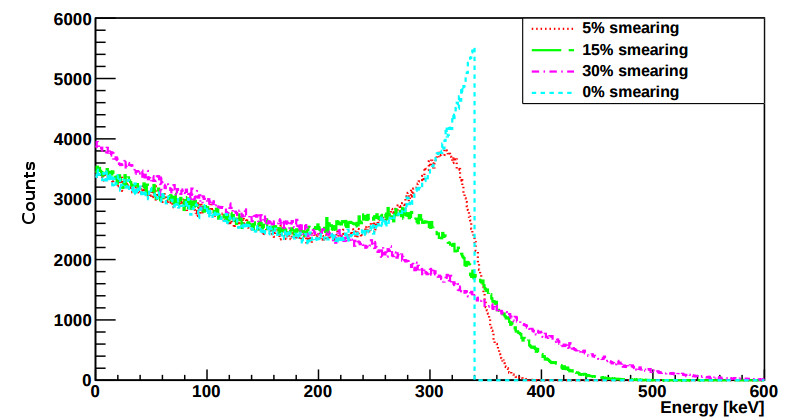
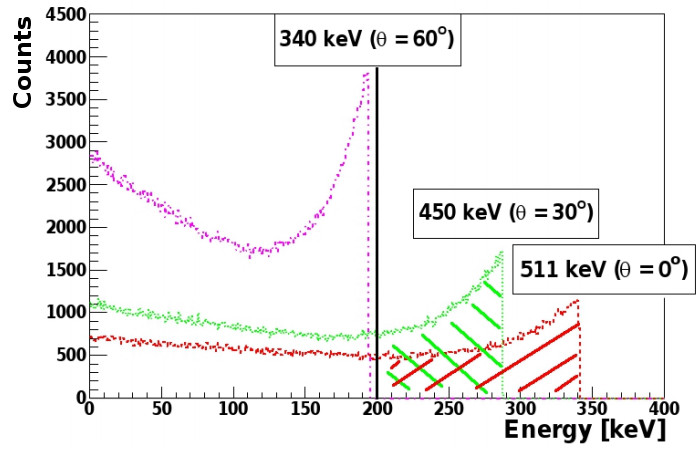
Even though in the plastic scintillator the energy cannot be transferred by the gamma quanta in the photoelectric effect it is still possible through the Compton effect (Figures 3.1, 3.2). In currently used PET systems events scattered more than 60 degrees are rejected by the energy cut around the photoelectric peak. However it is also possible to apply the energy cut on the Compton spectra registered by the organic scintillating strips. Theoretical Compton spectrum for the annihilation quanta with an effect coming from the detection resolution is shown in the Figure 3.3, while the change of the scattered gamma quanta as a function of the scattering angle is presented in the Figure 3.4. Apart of mentioned earlier drawbacks of lower density of plastic scintillators one can see that is has also a positive outcome. In the crystal scintillators the light is significantly more attenuated than in the polymer ones (the light attenuation length in organic scintillators is of about 2 m, while in inorganic ones of about 2 cm [14]). This feature connected with the simplicity of shaping polymers gives an opportunity to produce long scintillating strips which provide the light output sufficient for further analysis.
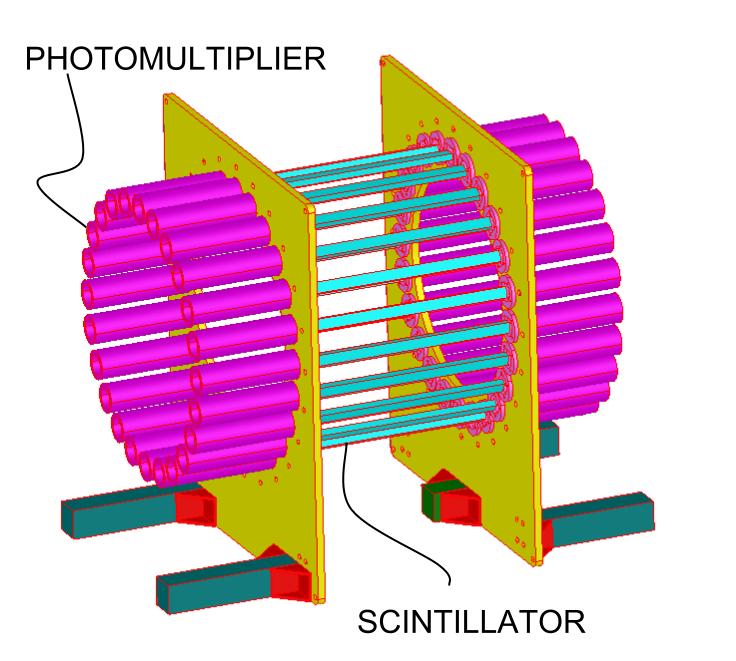
The diagnostic chamber of the J-PET consists of a few cylindrical layer, made of long, organic scintillators with photomultipliers on both ends of each strip (Figure 3.5). The increased length of the device will provide a solid angle greater than in conventional PET resulting in improvement of gamma quanta acceptance. Furthermore, this will let perform a simultaneous imaging of the biological processes inside the whole body. Application of multiple layers of scintillators would increase the probability of gamma quanta interaction with the detector volume. Distinction between the layers decreases the problem of an unknown depth of interaction in the material and thus the usage of multiple layers instead the thicker one is reasonable.
Last but not least, the J-PET will not only provide data of better precision than possible to obtain nowadays (current PET scanners achieve the time resolution of about 600 ps [14], at present the J-PET time resolution in 125 ps [16]), but application of the organic materials and the enlargement of the diagnostic chamber without the necessity of increasing the number of photomultipliers (in comparison to standard devices) will decrease the cost of the production making this imaging technique more accessible.
Chapter 4 Measurements of Lightguides Properties
4.1 Experimental setup
In order to obtain reliable results from any measurement with two strip J-PET prototype it is necessary to pay attention on the connection between the scintillator and photomultipliers. First of all, the lost of light at the surface should be as small as possible. This connection has also to be stable in time, symmetrical on both ends of the scintillator and easy to reconnect after once dismounted.
In the current setup this connection is provided by the thin layer of the optical gel between the scintillator and the photomultipliers. This requires some effort to mount the elements correctly. In case of more complex systems consisted of greater number of elements this solution would be ineffective and difficult to perform in a proper way.
The proposed idea is the insertion of the lightguide between the photomultiplier and the scintillator. Lightguides are easy to shape therefore it is possible to prepare them so that one end fit exactly the scintillator cross section and another provides easy connection with the photomultiplier. One of possibilities for better stabilization is gluing the lightguide and the scintillator with the optical glue.
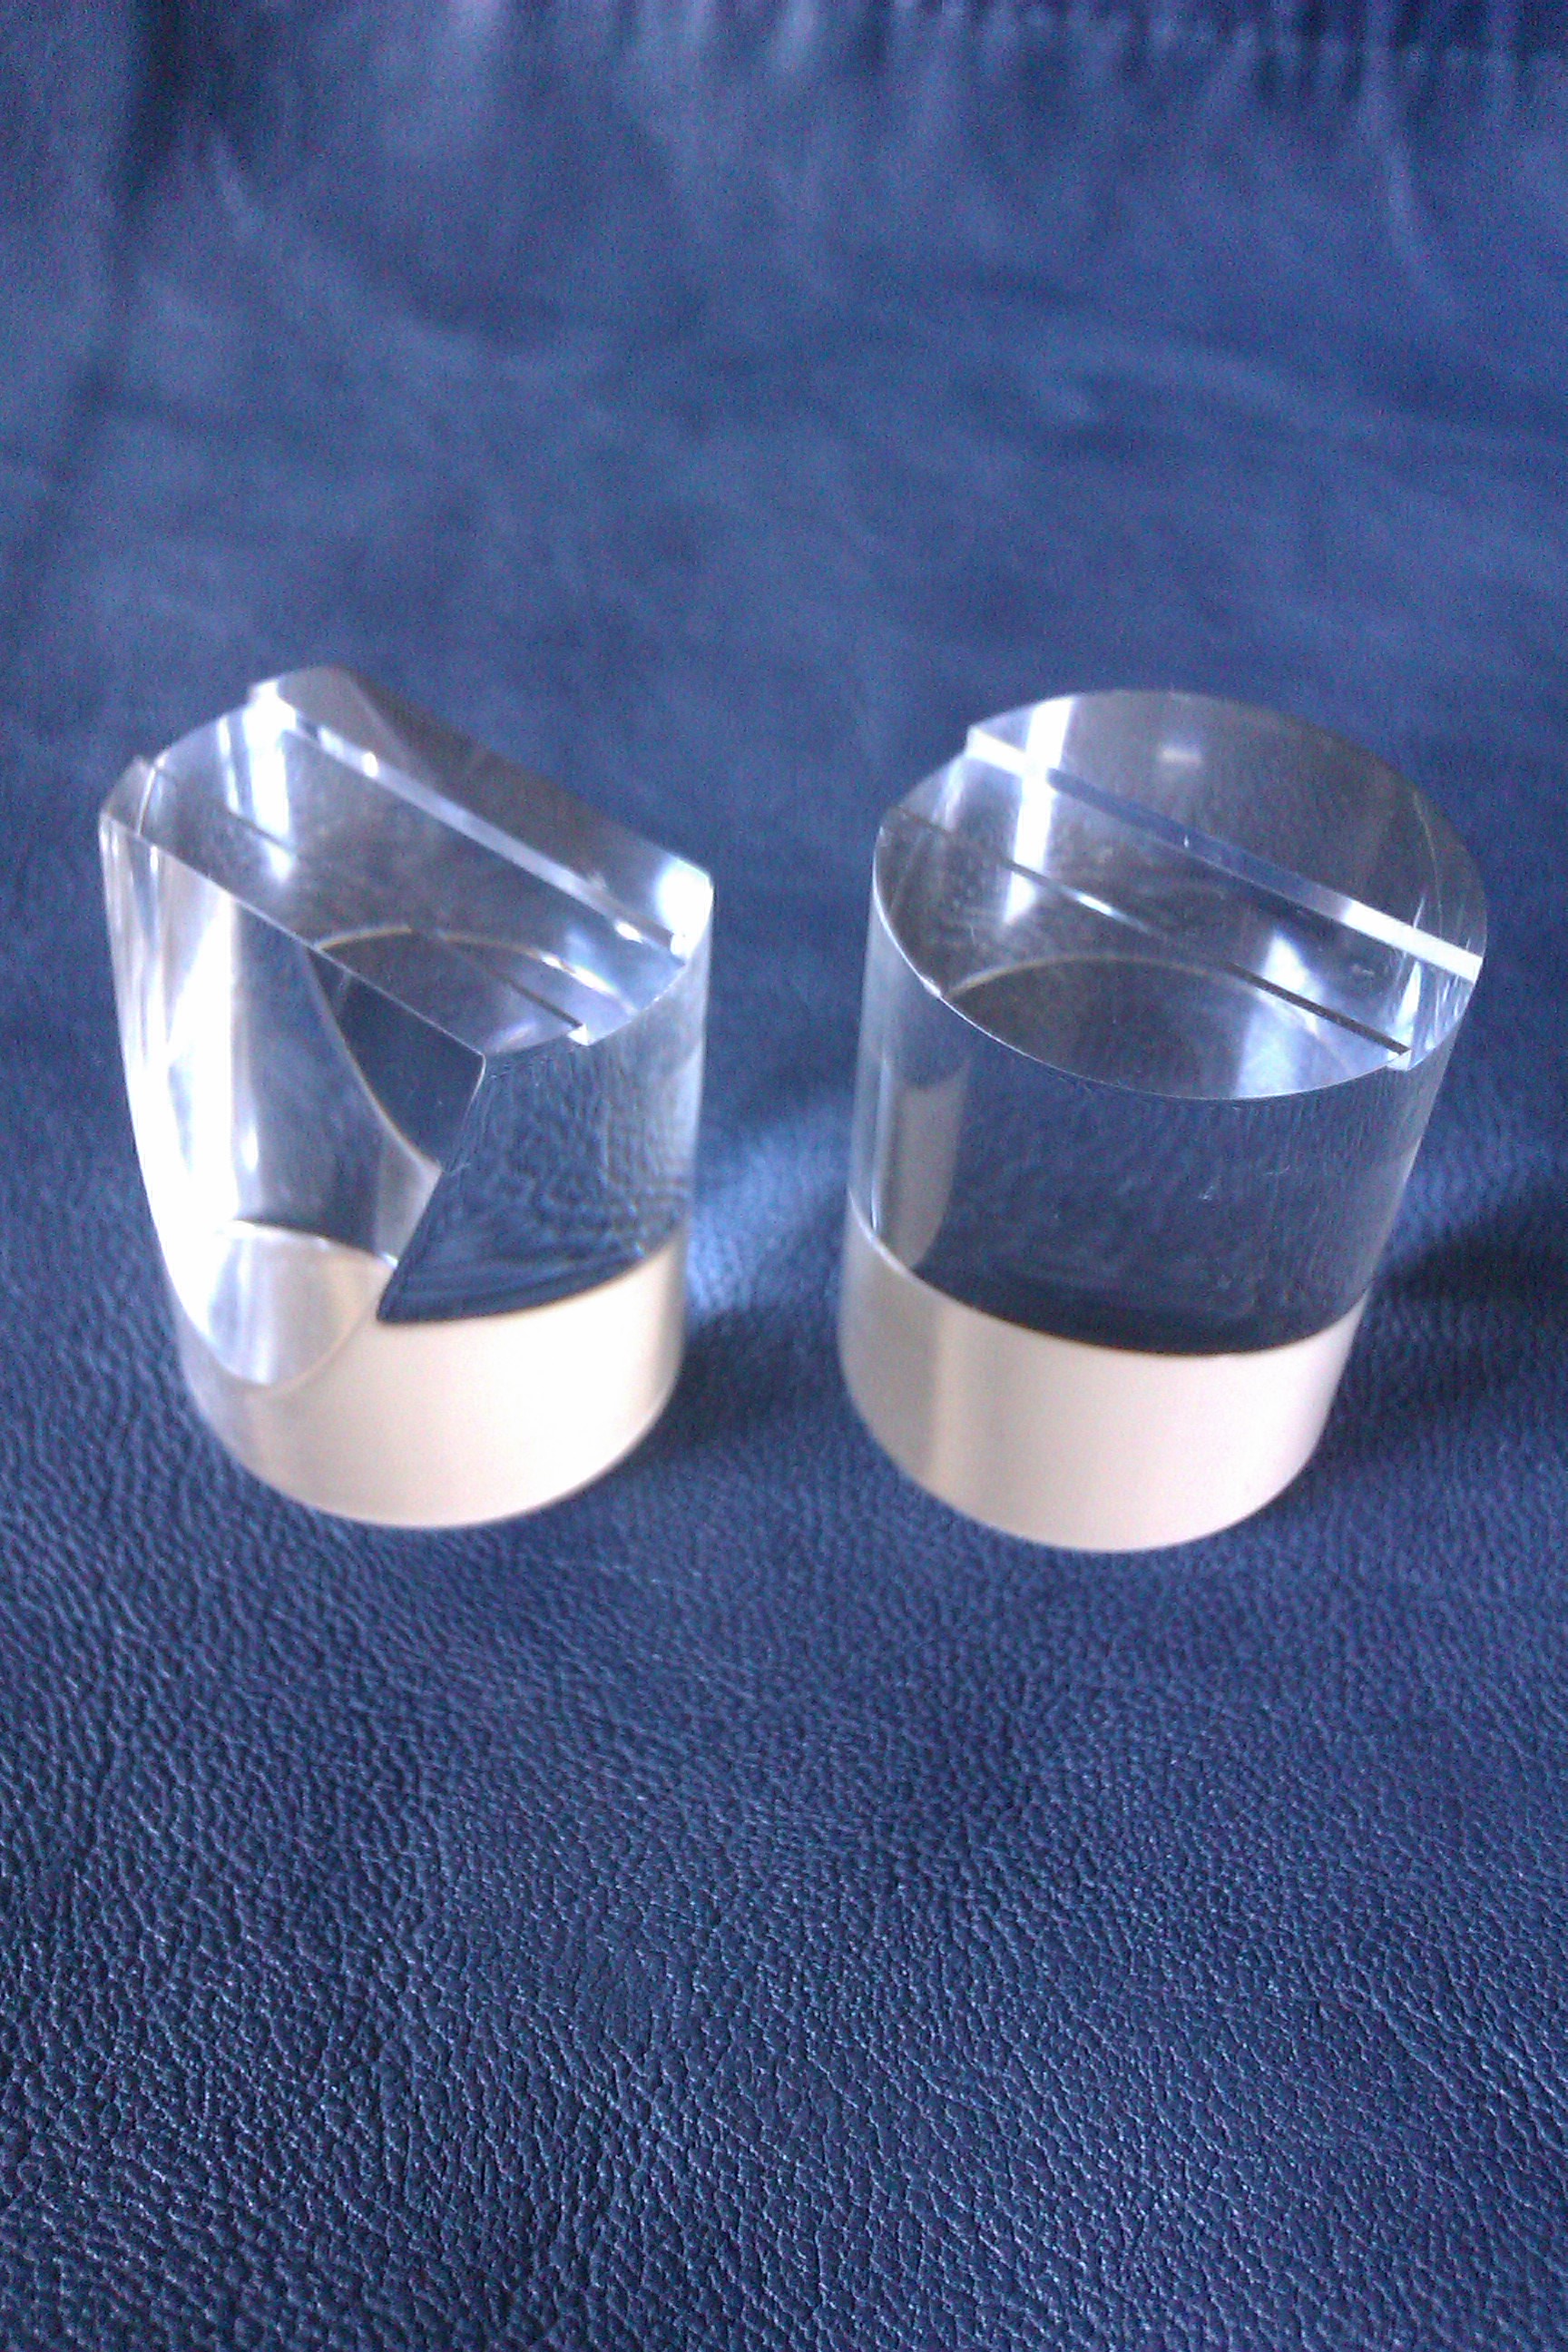
As usage of the material of very good light guiding properties is a natural idea (Figure 4.1), there still remains the question about the most effective shape of the lightguides and the substance used at the connection between them and the scintillator (optical gel BC630 or optical glue BC600).
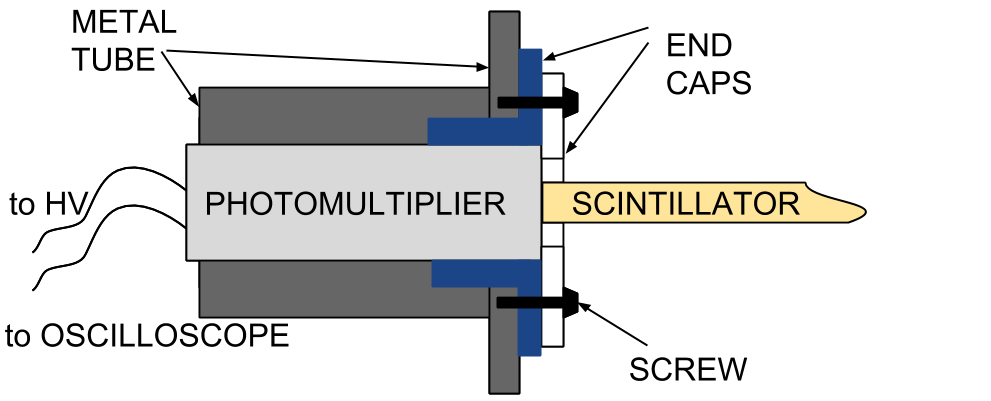
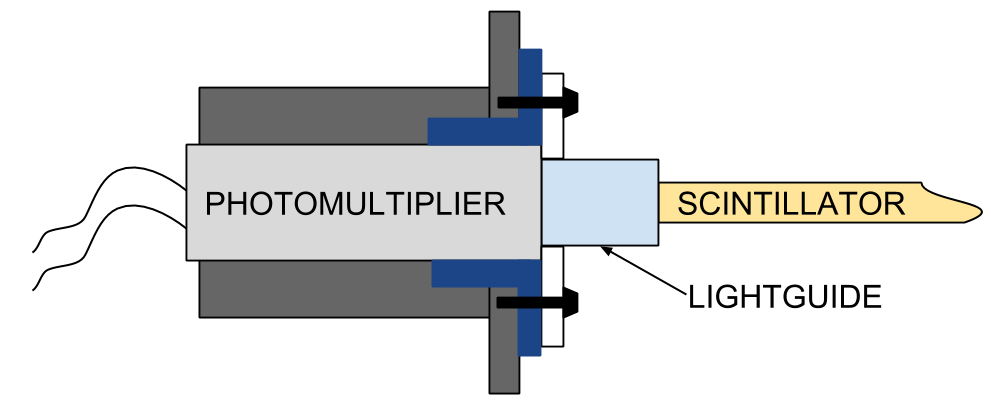
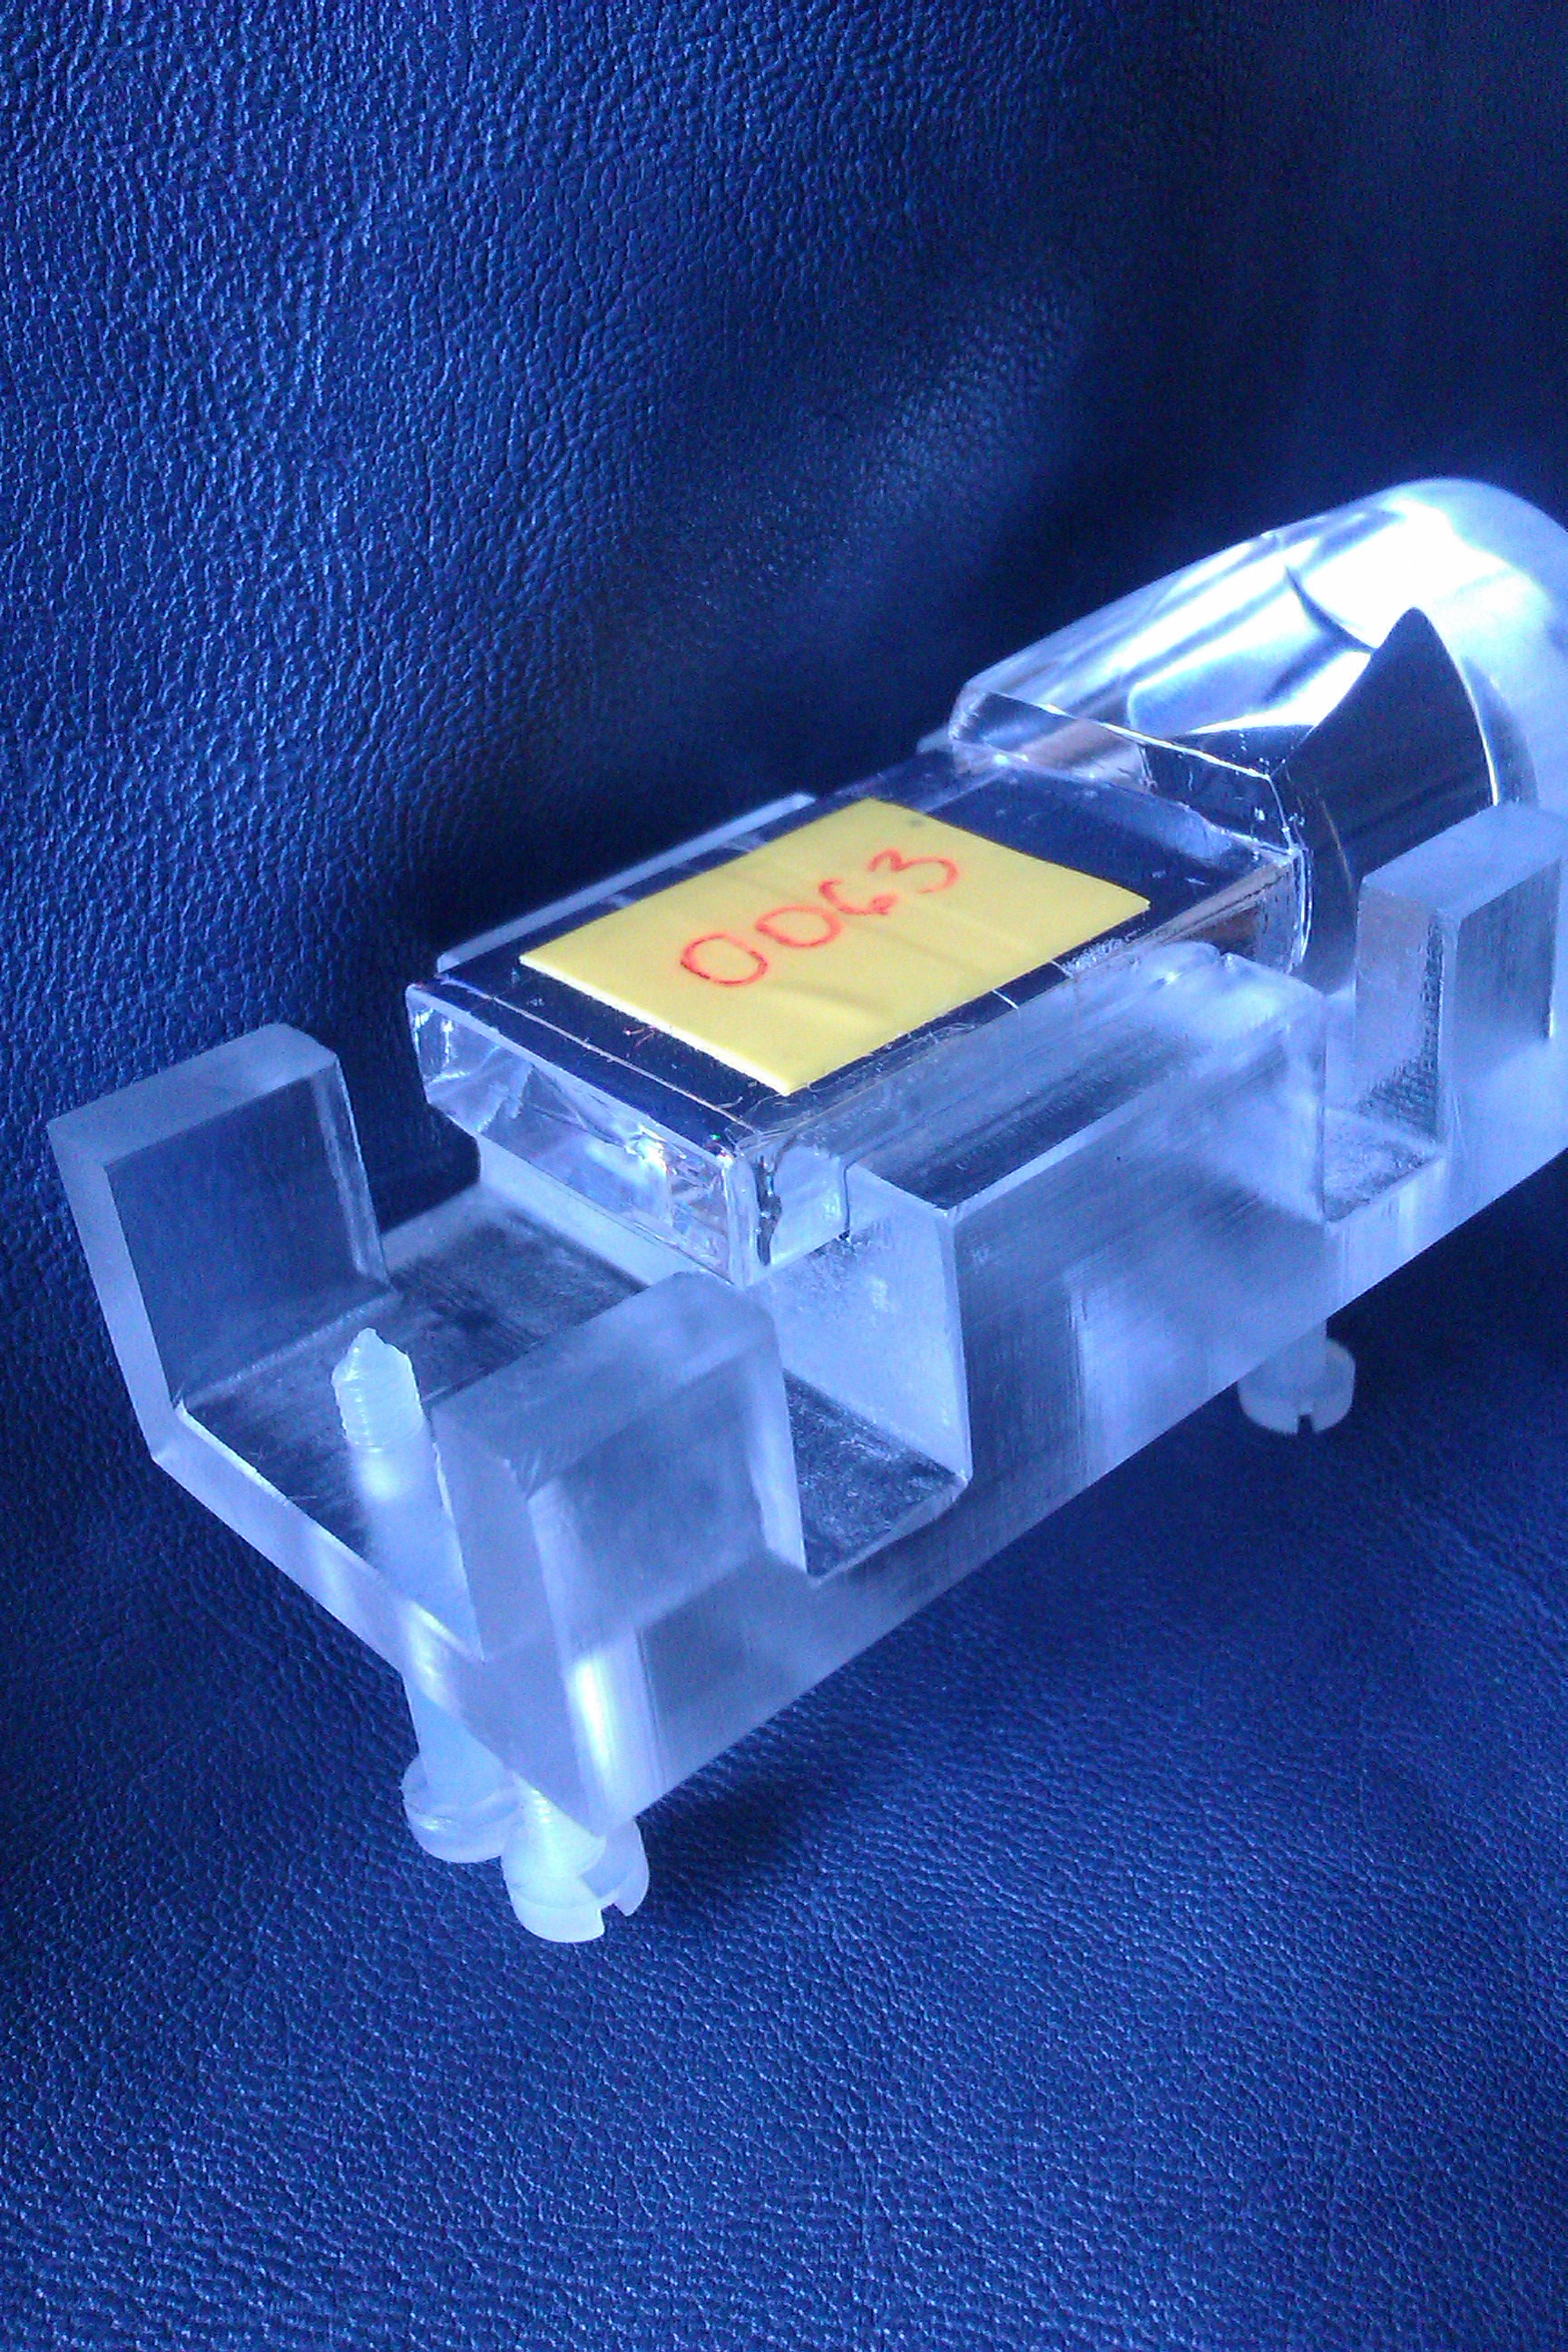
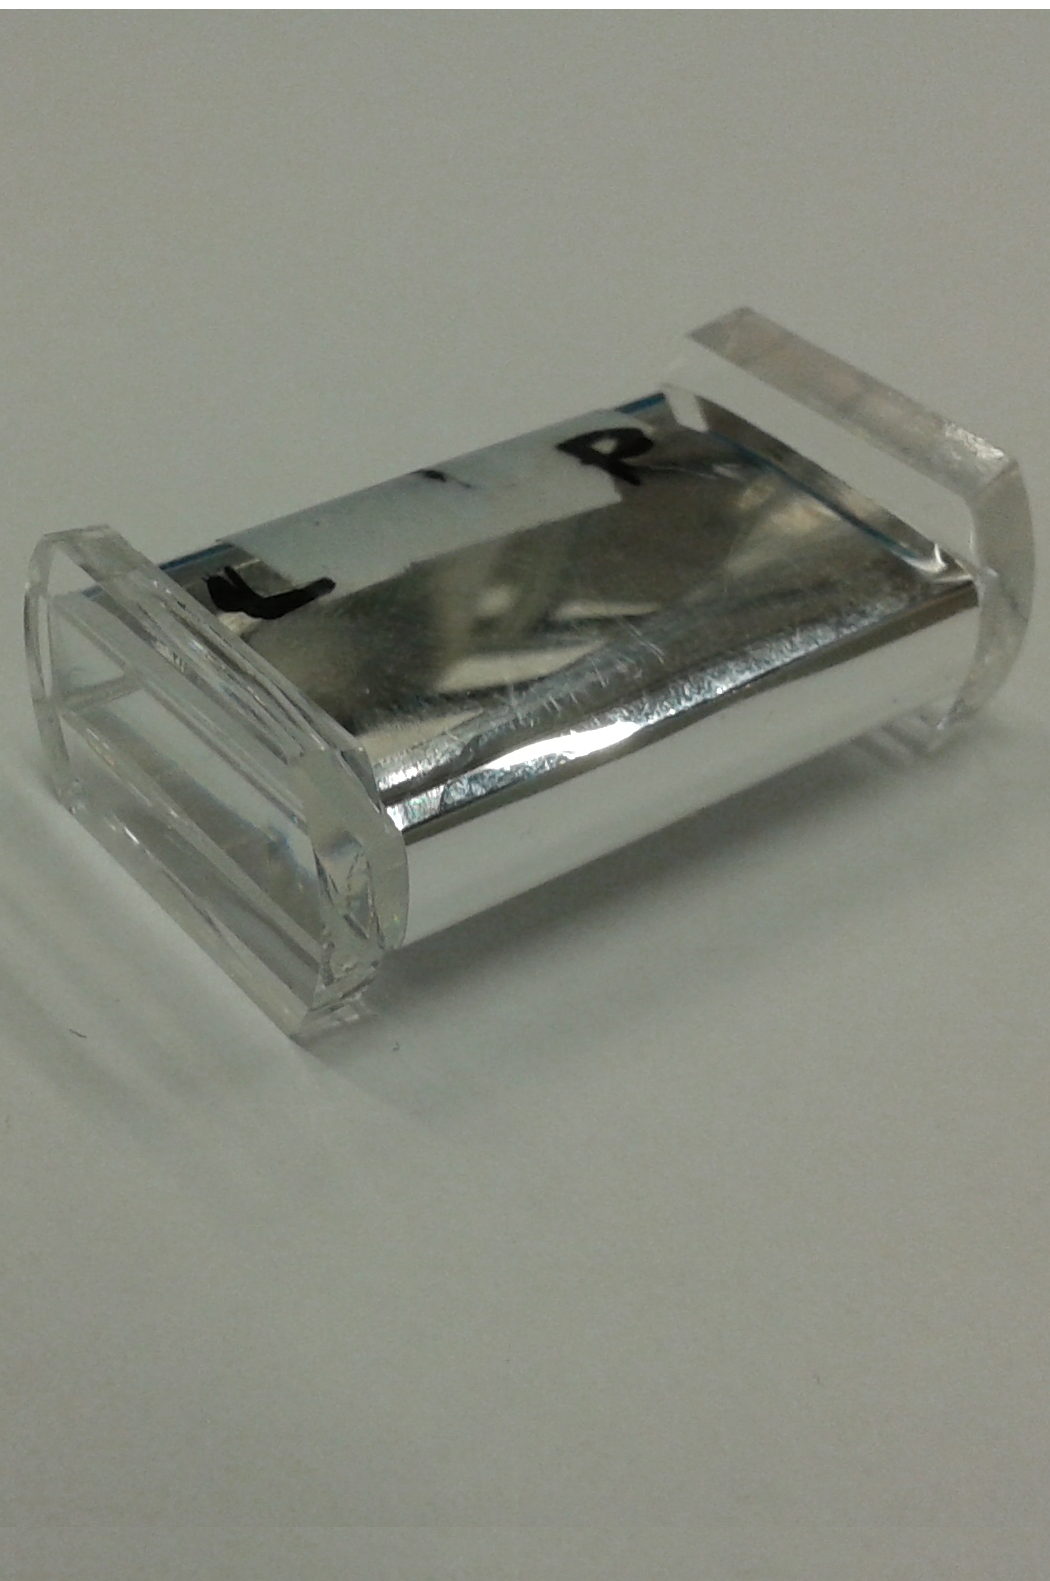
Taking under consideration the geometry of the elements, there were two shapes chosen for further investigation: a cylindrical and a trapezoidal one. After the measurements with each of this shapes there the rows were cut in the lightguides matching exactly the scintillator shape (Figure 4.2). The last shape that was checked were the trapezoidal lightguides with the cuts for the scintillator shortened up to 3 mm (Figure LABEL:photos). The scheme and the dimensions of the scintillator and the lightguides used are gathered in the Table 4.1. Optical gel and glue were also tested.
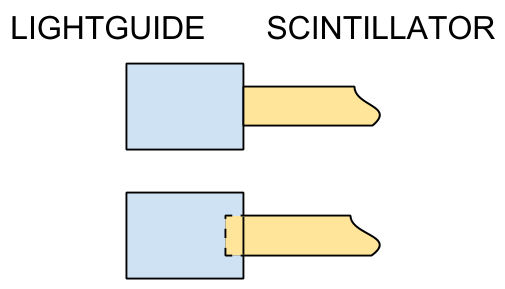
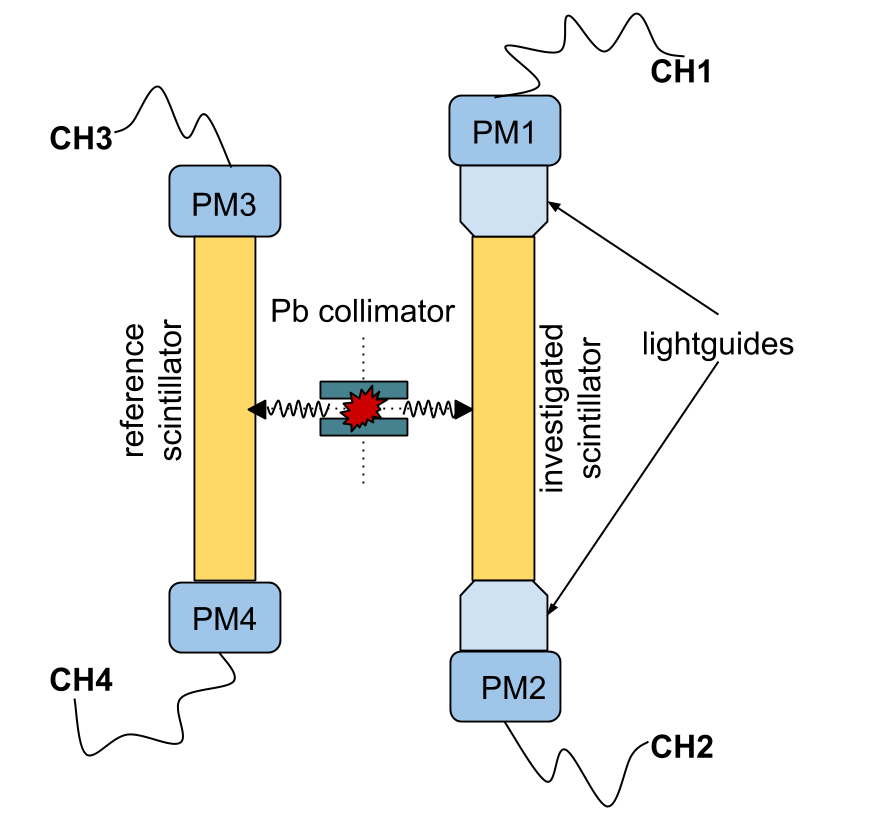
The measurements were performed with the two-strip J-PET system. The schematic arrangement of the elements in the experimental setup is presented in the Figure 4.4. In the one strip there are inserted lightguides (investigated strip) and the other one serves as the reference. Sodium radioactive source is placed in the collimator with 1.5 mm slit in the middle between two strips, so that only the central part of each scintillator is irradiated. This means that the expected time difference of the signals registered on both ends of the strip is zero. The measured time differences are the Gaussian-like distribution centred around zero. The parameter identified with the time resolution is the sigma of this distribution. The idea of the experiment is to measure how the lightguides insertion decrease the precision of time difference determination. Another test is to estimate how much light is lost due to their presence based on the position of the Compton edge.
| ELEMENT | TYPE | GEOMETRY |
|---|---|---|
| scintillators | BC400 |
![[Uncaptioned image]](/html/1507.08305/assets/scintDimensions.png)
|
| cylindrical lightguides | BC800 |
![[Uncaptioned image]](/html/1507.08305/assets/cylindricalGeo.png)
|
| trapezoidal lightguides | BC800 |
![[Uncaptioned image]](/html/1507.08305/assets/trapezoidalGeo.png)
|
| short lightguides | BC800 |
![[Uncaptioned image]](/html/1507.08305/assets/shortGeo.png)
|
The described measurement is possible only with the appropriate setup settings. The high voltage applied to each photomultiplier was calculated so that the gain of each photomultiplier was the same (Table 4.2). For more details about the photomultipliers characteristics and the gain calculation see [18, 19].
The oscilloscope trigger settings were chosen so that only the signals from the same annihilation were stored. This was provided by creating the known difference in time of reaching the oscilloscope by the signals from two channels from different strips. It was done by inserting the signal cable of the known time delay. Since the oscilloscope used allows only two channels to be in the trigger conditions, channels 1 and 3 were used and an event was stored if both signals were higher than the given threshold within 60 ns window.
| PHOTOMULTIPLIER | HV [V] |
|---|---|
| PM1 | 1493 |
| PM2 | 1500 |
| PM3 | 1514 |
| PM4 | 1497 |
4.2 Performed measurements
There were fifteen measurements performed in period from September 2014 to May 2015 (for details see Table 4.3).
At first, six measurements were made with 3 cm scintillator in the investigated strip and with cylindrical lightguides, with trapezoidal lightguides (this measurement was done twice in order to prove the repeatability of the obtained results) and with both cylindrical and trapezoidal lightguides with the cuts matching the scintillator size. There was also done a measurement with a 3 cm scintillator only to determine its own time resolution which is considered as a reference. During these measurements in all cases the optical gel was used at the connections.
Than, the most promising lightguides (trapezoidal with cuts) were chosen and permanently glued to the 3 cm scintillator in order to test the impact of the optical glue.
As the short scintillators (3 cm) have very good time resolution, it was convenient to use them to clearly see the differences caused by the lightguides usage. But the measurements were also done with longer scintillators (15 and 30 cm). It was tested whether the change in time resolution due to the presence of the lightguides is a significant in comparison to the time resolution of the longer strips.
Another part of measurements was performed in March. The aim of the two measurements with trapezoidal lightguides was to check the optical glue connection after a few months. As the results proved to be repeatable, for the last measurement these lightguides were shortened up to 3 mm.
Finally in May 2015 the measurement with shortened lightguides was repeated in order to confirm the final result.
| No. | lightguides | lightguide scintillator | reference scintillator | date |
|---|---|---|---|---|
| type | length | length | ||
| 1 | cylindrical | 3 cm | 3 cm | 08.09.2014 |
| 2 | no lightguides | 3 cm | 3 cm | 11.09.2014 |
| 3 | trapezoidal 1st test | 3 cm | 3 cm | 11.09.2014 |
| 4 | trapezoidal 2nd test | 3 cm | 3 cm | 11.09.2014 |
| 5 | cylindrical with cut | 3 cm | 3 cm | 12.09.2014 |
| 6 | trapezoidal with cut | 3 cm | 3 cm | 12.09.2014 |
| 7 | no lightguides | 3 cm | 15 cm | 16.09.2014 |
| 8 | trapezoidal glued to scintillator | 3 cm | 15 cm | 16.09.2014 |
| 9 | cylindrical cut | 3 cm | 15 cm | 17.09.2014 |
| 10 | cylindrical cut | 15 cm | 15 cm | 18.09.2014 |
| 11 | cylindrical cut | 30 cm | 15 cm | 19.09.2014 |
| 12 | trapezoidal glued to scintillator 1st test | 3 cm | 3 cm | 17.03.2015 |
| 13 | trapezoidal glued to scintillator 2nd test | 3 cm | 3 cm | 17.03.2015 |
| 14 | shortened trapezoidal glued to scintillator 1st test | 3 cm | 3 cm | 19.03.2015 |
| 15 | shortened trapezoidal glued to scintillator 2nd test | 3 cm | 3 cm | 19.05.2015 |
Chapter 5 Data Analysis
For each event amplitude of four signals was sampled in the time domain with 100 ps step.
The first part of the analysis is the selection of signals appropriate for further calculations. At this point all events with at least one signal smaller than some user-defined threshold are rejected. As the expected range of amplitudes of signals is known from the previous studies [24], the threshold value chosen for data analysis in this work is -70 mV.
The next step is offset determination for each signal. The procedure begins with calculation of the mean value and standard deviation of amplitudes of twenty first points in the signal. The noise level of the signal is estimated as the mean value with three standard deviations (Figure 5.1).
Than, starting from the signal minimum, the voltage of the left edge of the signal are one by one compared with the noise range until the first point belonging to noise is identified. The offset is calculated as the mean value of the points from zero to that point. Once the offset is determined, the signal is shifted by its value [20].
The integral of the shifted signal curve is the charge. Using the calibration for each photomultiplier it is possible to calculate the charge of the photoelectrons at a given high voltage value. The signal charge divided by the single photoelectron charge gives the number of produced photoelectrons. This number is proportional to the amount of light that reached the photomultiplier.

The described procedure is repeated for all signals from all channels. Example results are presented in the histograms 5.2(a) and 5.2(b). Compton edge is clearly visible. In order to eliminate scattered events there is a cut equal to the mean value of respective histogram made on the photoelectrons number. Again, accepted events are those for which photoelectron number on all four channels are higher than the cut value. For more information about the Compton scattering impact on data analysis see [21].
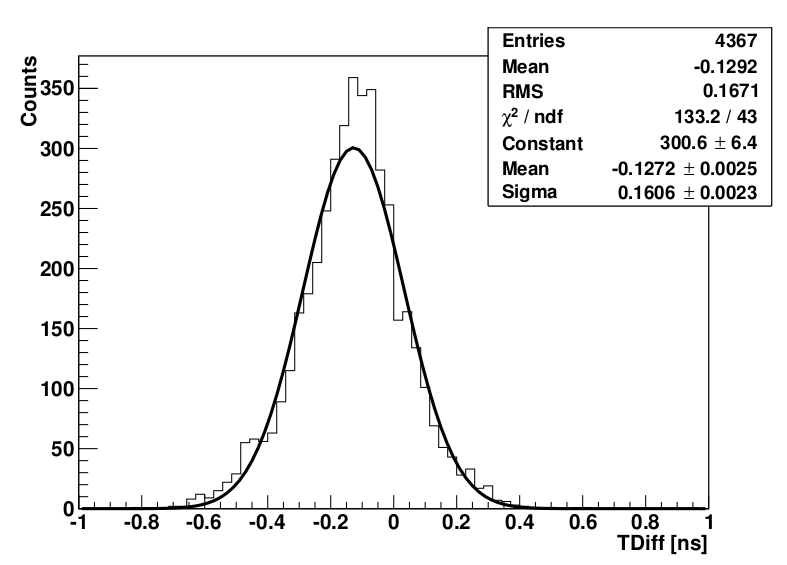
The user-defined threshold is also shifted by the offset value. The time at the new threshold is determined and it is used in further calculations. Particularly, the time difference between two signals is calculated based on this value. The time differences for all signals from one strip are computed and collected in the histogram. of the distribution is obtained by fitting a Gaussian function. An example histogram with fitted function is presented in the Figure 5.2(c). For more information about the data analysis see also [22-24].
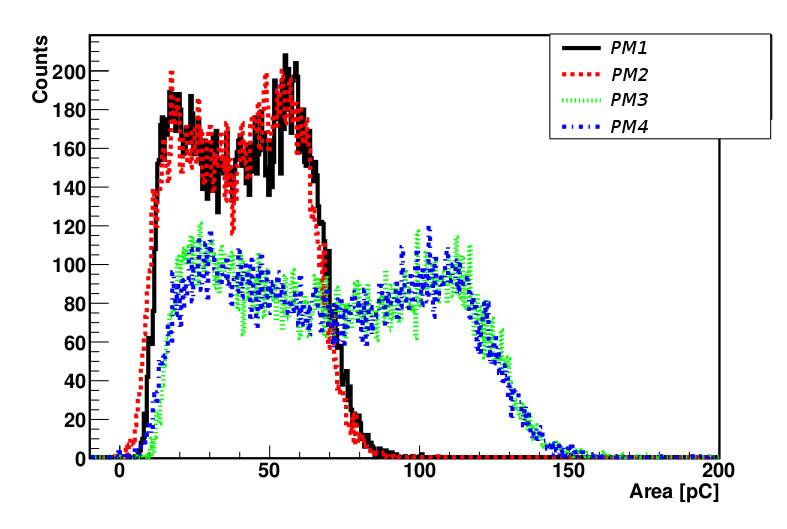
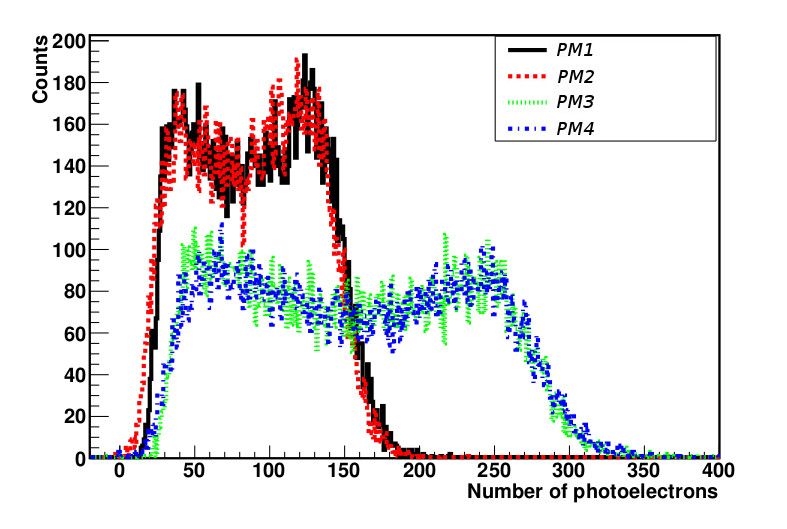
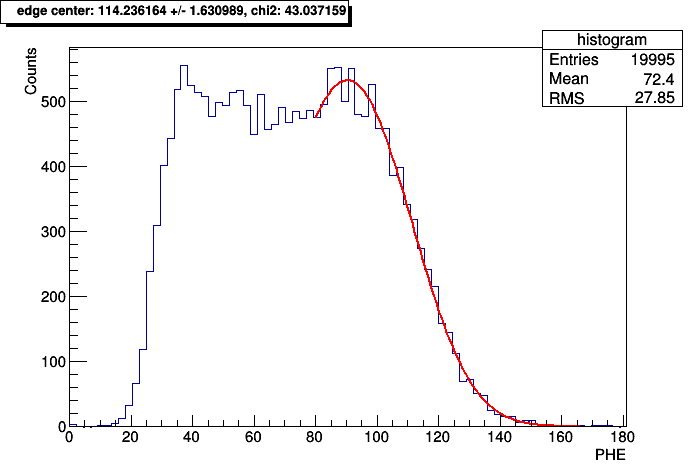
As the number of photoelectrons is proportional to the amount of light reaching the photomultiplier, in order to compare the light outputs obtained for tested lightguides, the spectra of photoelectrons number were closely investigated. The value identified with the best light output is the number of photoelectrons at the center of the Compton edge (where the center is defined as the point in the half maximum of the Compton edge).
Two functions were candidates to fit the photoelectrons number spectra. The Fermi function given by the equation:
| (5.1) |
where corresponds to the amplitude, is a horizontal translation, scales the edge of the distribution, is a vertical translation. The advantage of this approach is the fact that the argument for which the function achieves its half maximum is obtained directly from the fit parameters (parameter in the equation 5.1). a considerable drawback is the necessity of precise determination of the fit beginning as Fermi function is very sensitive to this value.
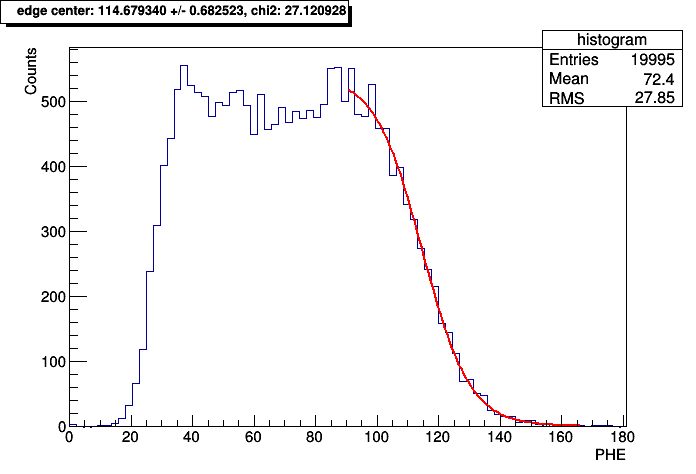
The second tested function is Novosibirsk function [25]:
| (5.2) |
where: - height of the peak, - peak position, - width of the peak, - parameter responsible for the function decreasing.
The shape of Novosibirsk function eliminates the problem of the fit beginning providing a stable method of determining Compton edge center. The Compton edge center position () was calculated for the condition: .
Once the maximum is obtained it is possible to fit the Fermi function with the beginning of the fit range set as the coordinate of the maximum value of the Novosibirsk function. Sample fits obtained by these two methods are presented in the Figure 5.3.
Determination of the center point of the Compton edge gives the same result within error limits for both functions. However, the Novosybirsk function describes the distribution in the wider range, therefore this function was used for further analysis.
Chapter 6 Results and Conclusions
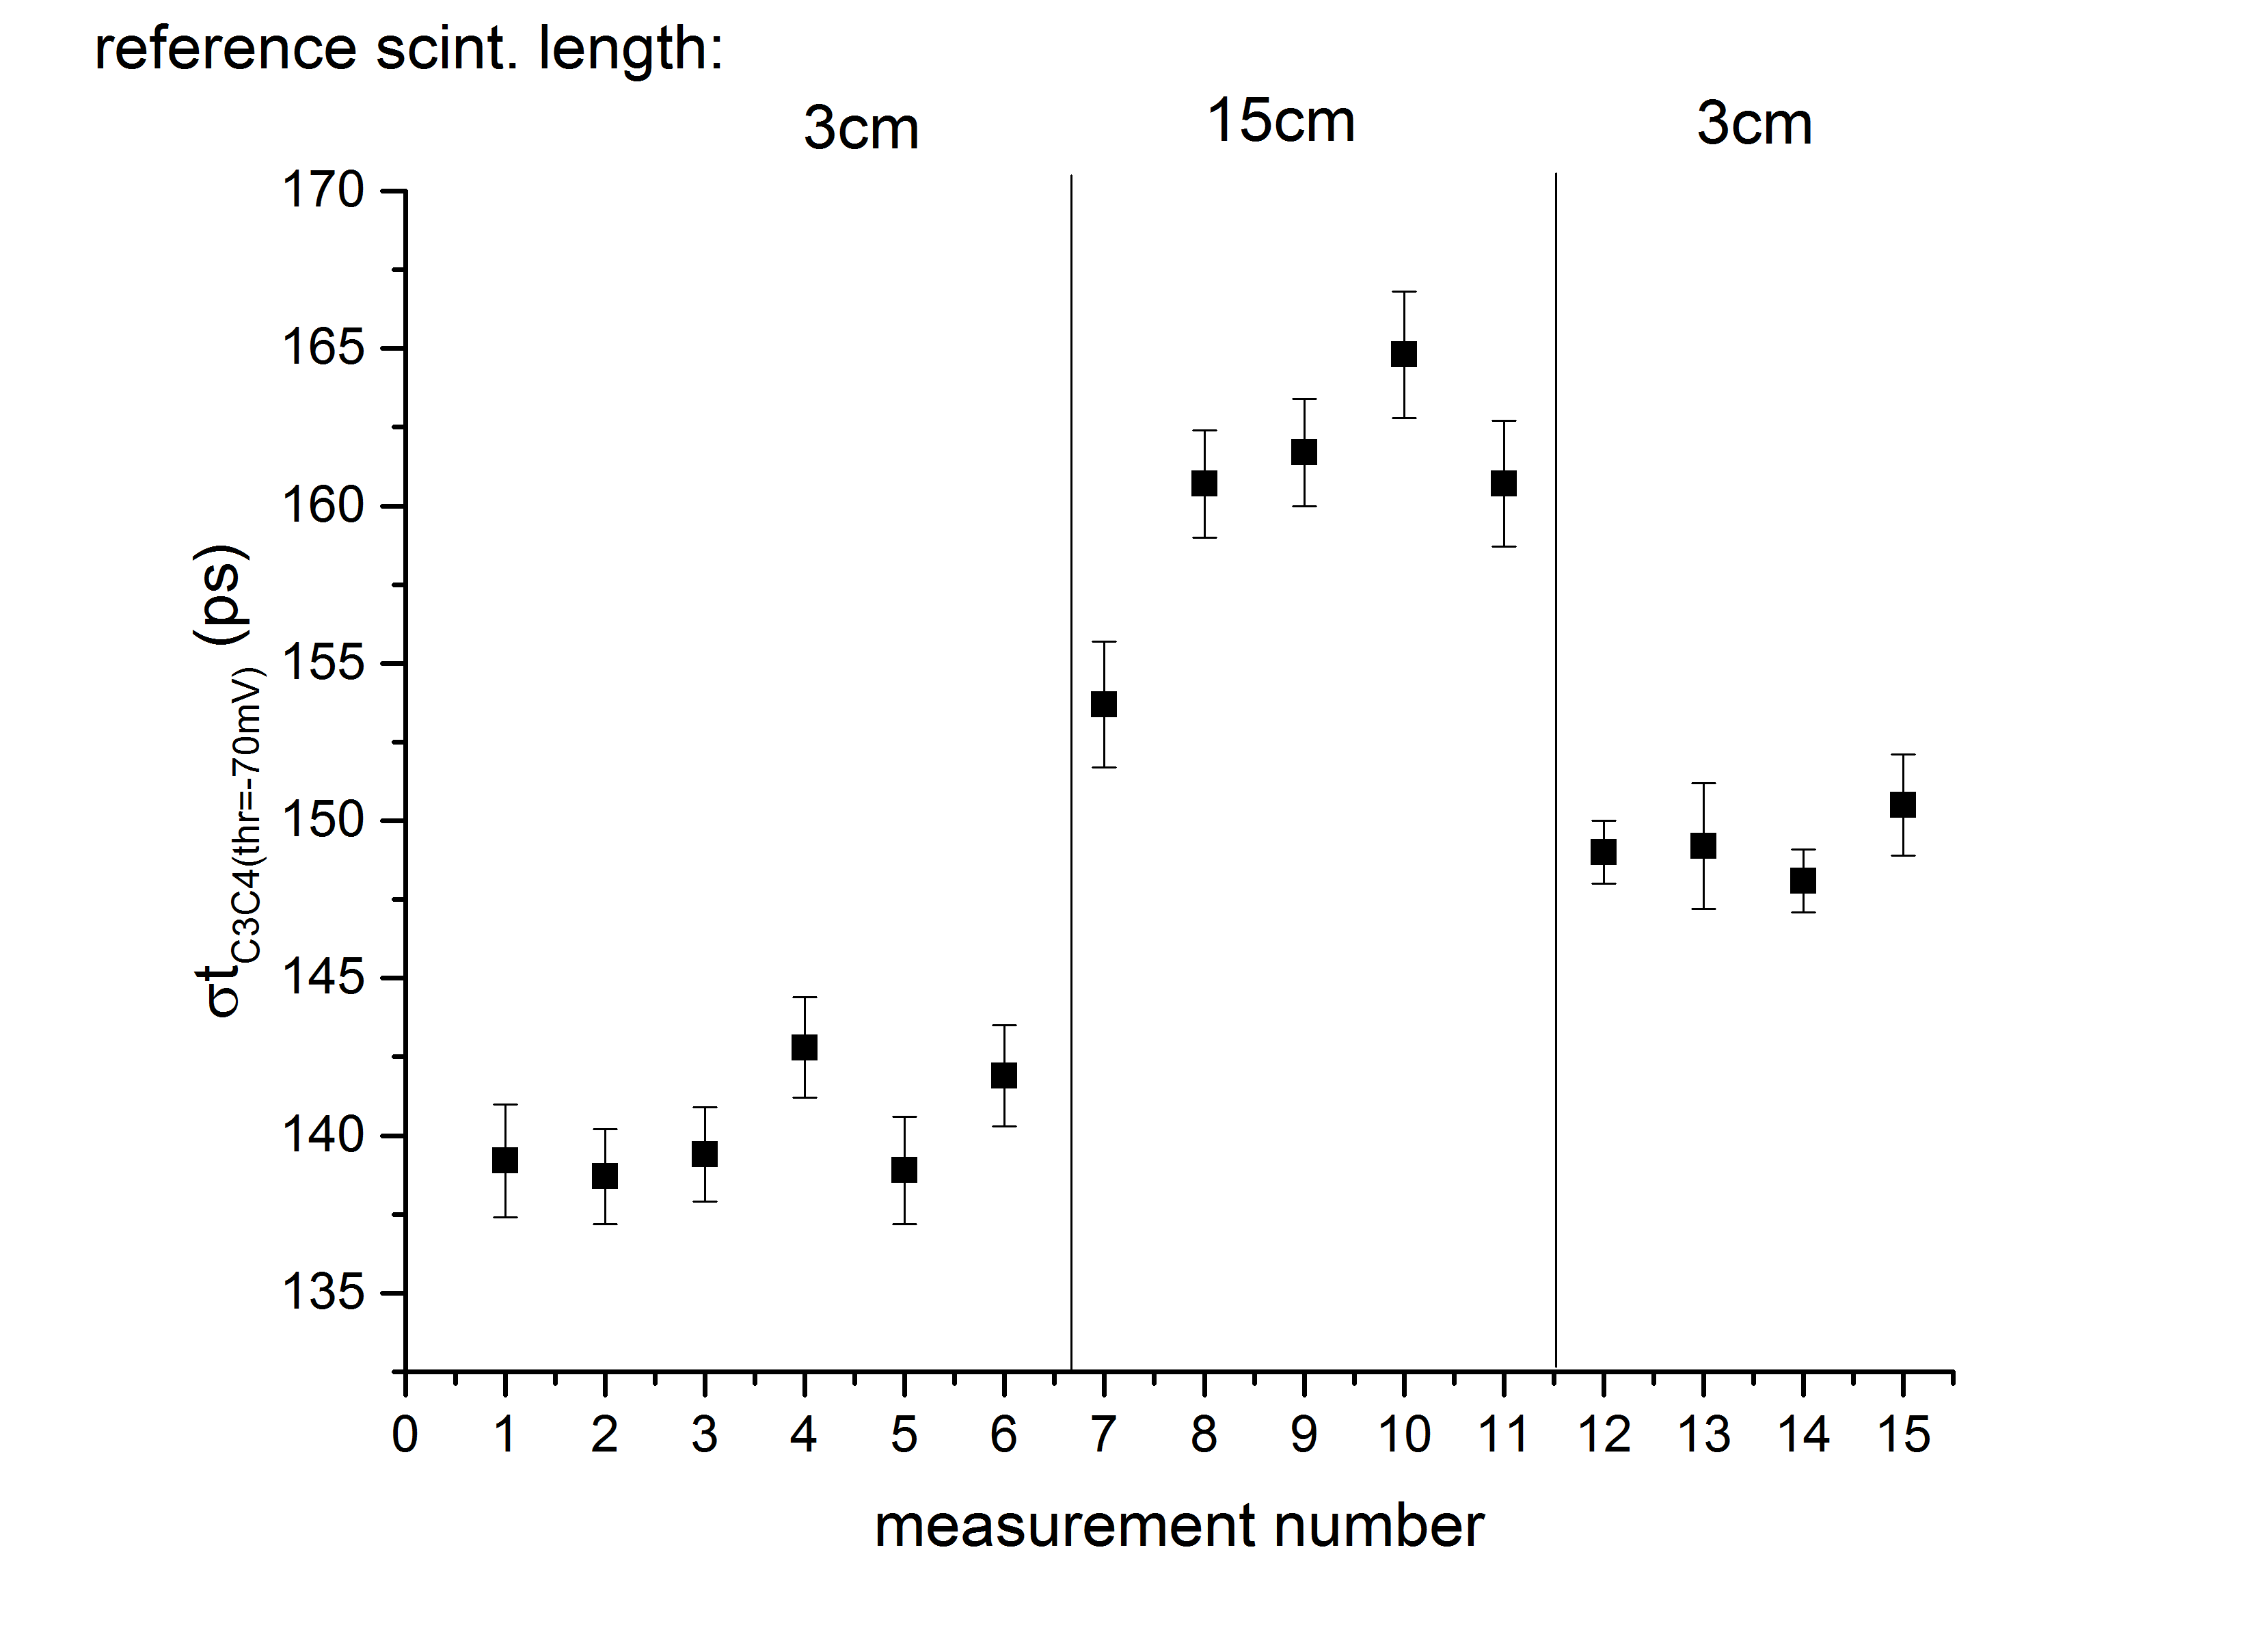
The time resolution for the reference strip is presented in the Figure 6.1 (see also Table 4.3). It is clearly visible that the time resolution for the reference strip is constant within error bars independently from the lightguides measurement in the second strip. On the other hand, as expected, this time resolution depends on the length of the scintillating strips. The 10 ps worse result for the time resolution for the measurements 12-15 (with respect to measurements 1-6) has not been explained however it is negligible with respect to the effects observed at the investigated strip. In addition, the increased length of the scintillating strip from 3 cm to 15 cm increase the time resolution by 20 ps.
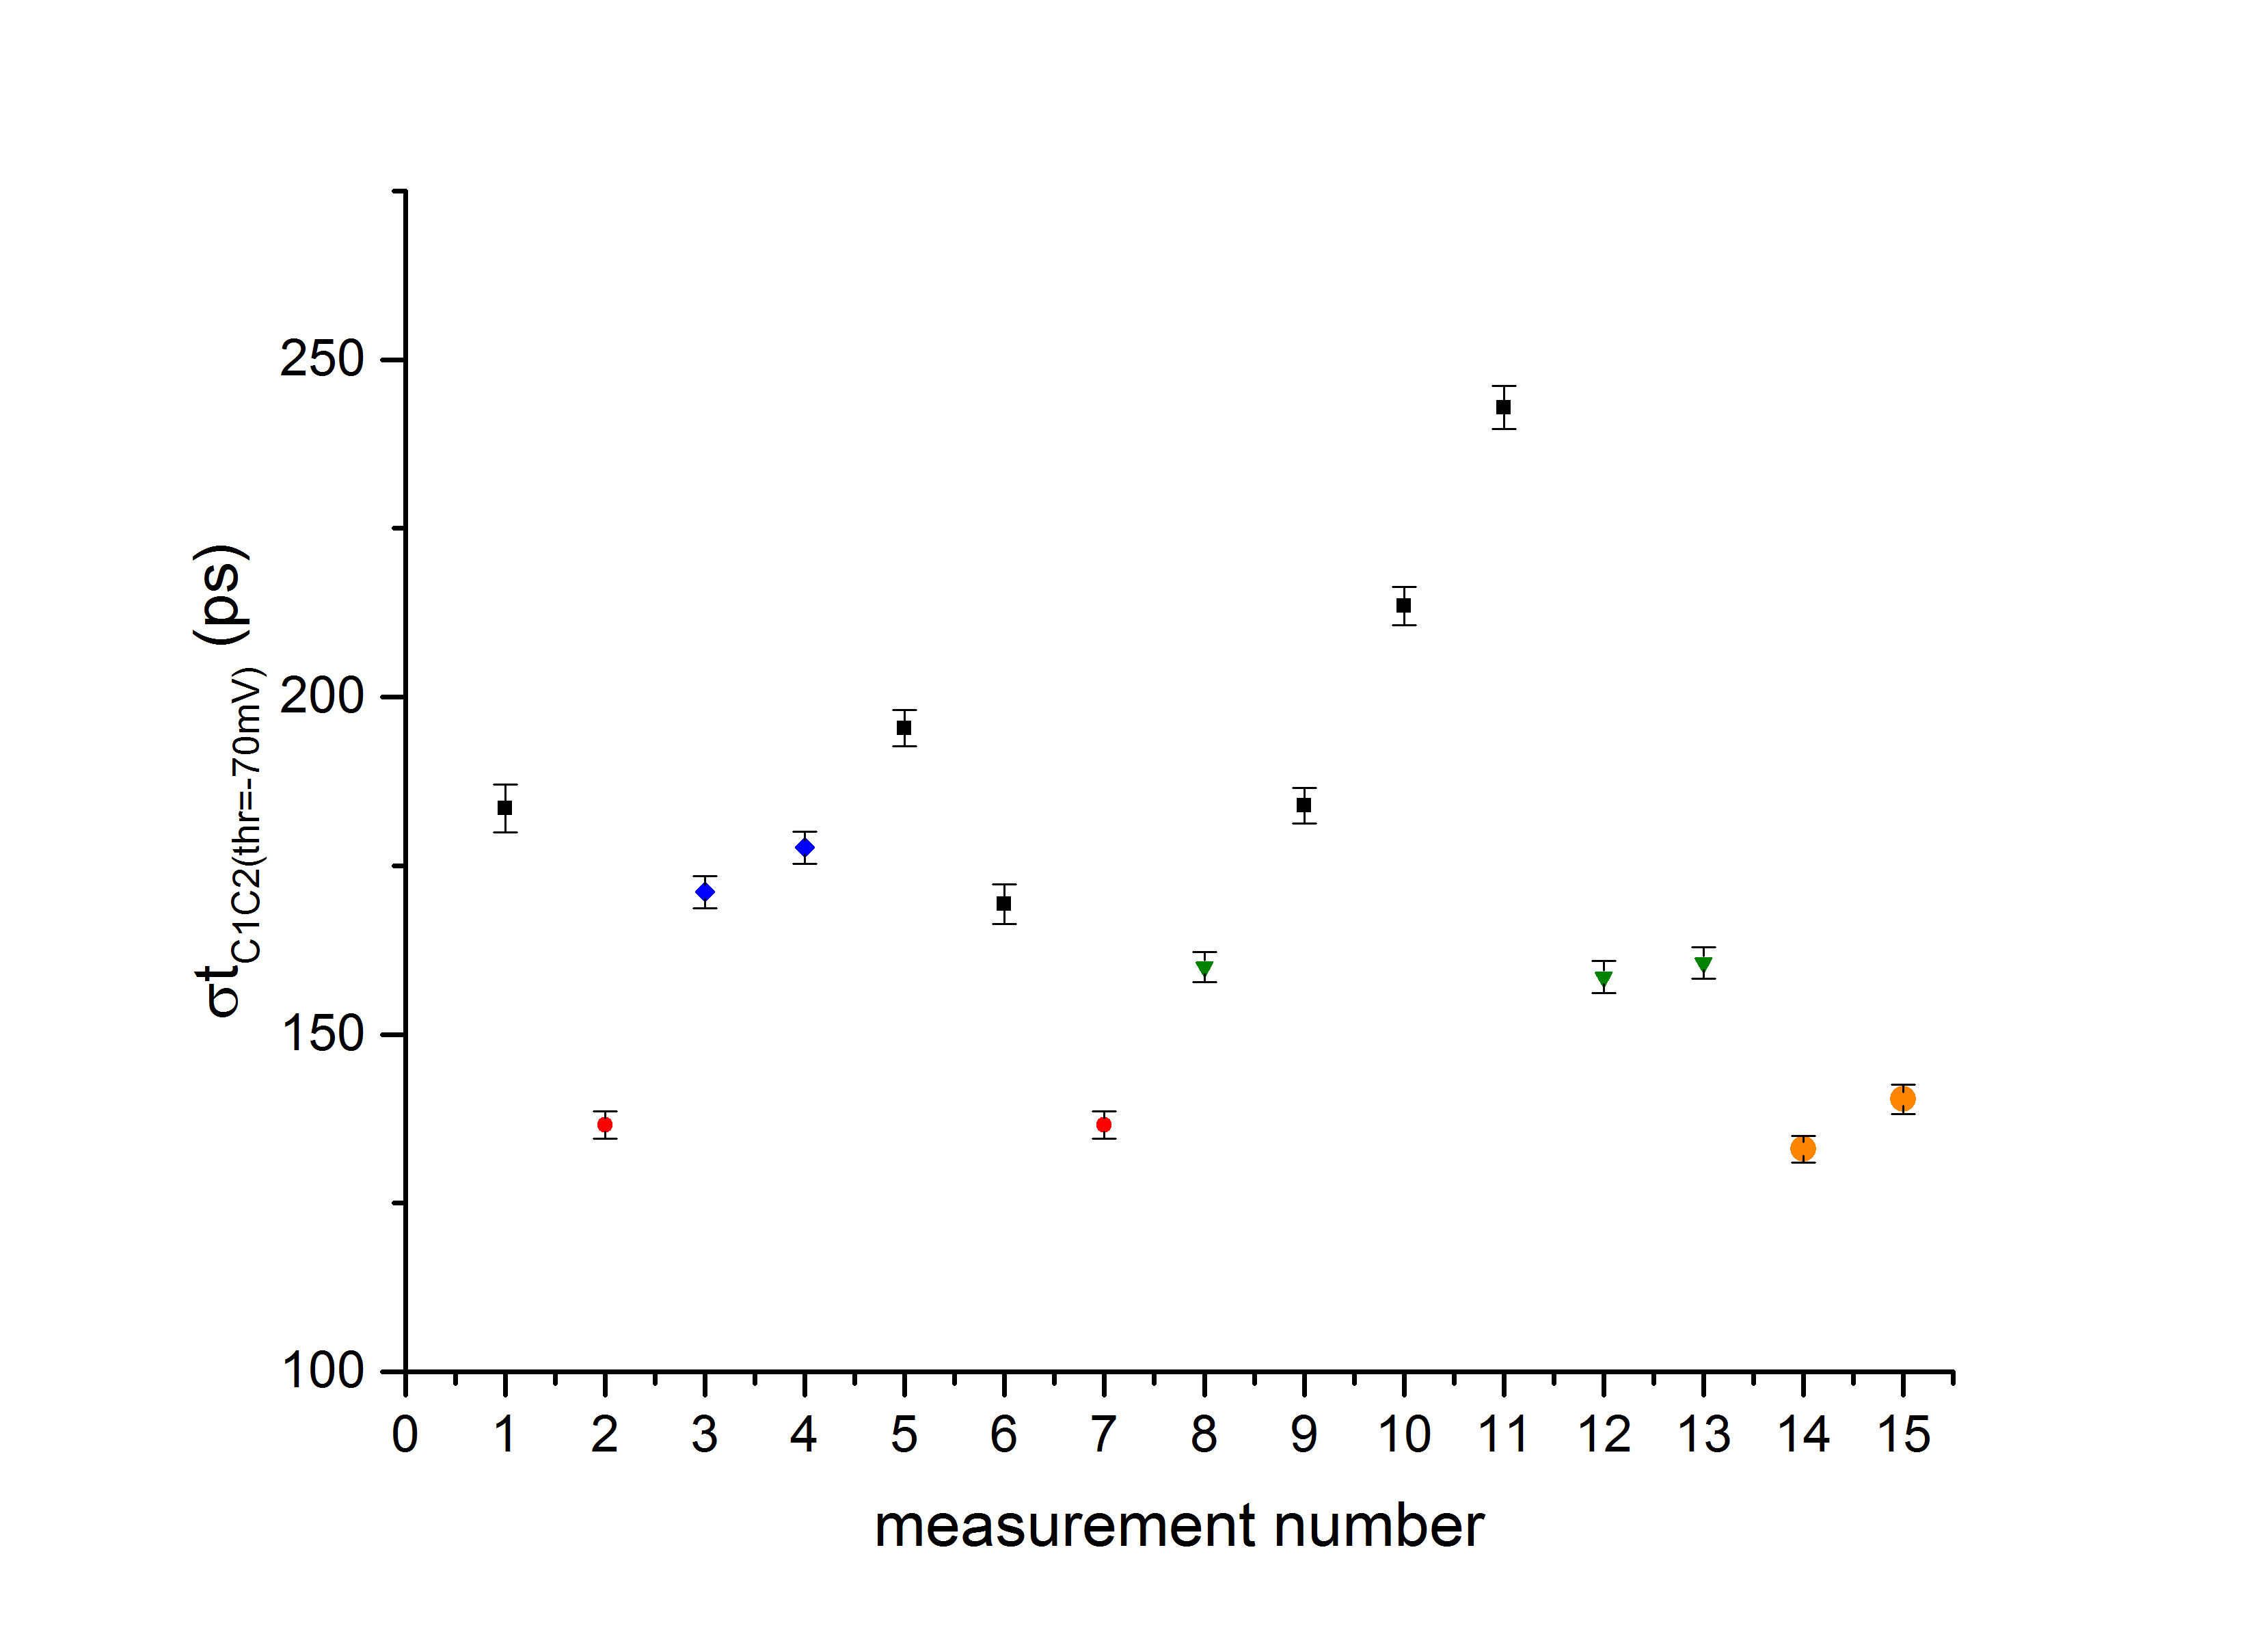
Results of the measurements with lightguides are presented in the Figure 6.2. Measurements 1 and 3 for cylindrical and trapezoidal lightguides respectively show that the latter has better time resolution which is also proved in the measurements with cut lightguides (measurements 5 and 6). On the other hand there is no difference observed between the results for lightguides of the same shape with and without the cuts. The small improvement is visible with the optical glue used instead of gel (measurement 3 and 8, 12, 13 respectively). Results 9-11 show that each 15 cm of additional scintillator length adds 30 ps in the time resolution while application of 3 cm lightguide adds 20 ps in (comparison of the results 2, 7 and 1, 3-6). Finally, the time resolution for the 3 mm lightguides is comparable with the results without any lightguides. Therefore this element is suggested to be used in the full barrel J-PET detector.
In addition the dependence of the signal resolution on the statistical fluctuations of number of photoelectrons (PHE) in the form of PHE-0.5 was checked (6.3).

Acknowledgements
I would like to express my deepest gratitude to my supervisor, Dr Eryk Czerwiński for his effort, valuable suggestions and guidance from the very beginning of my experimental work.
I am also grateful to Prof. Paweł Moskal for all his remarks and the opportunity to work in the J-PET group.
I also thank Ewelina Kubicz, Magdalena Skurzok, Anna Wieczorek and Szymon Niedźwiecki for their advice and patient help even with the simplest things. Each of them contributed something to this work.
I wish to acknowledge financial support by the Polish National Center for Development and Research through grant INNOTECH-K1/IN1/64/159174/NCBR/1.
References
- [1] M. Sandborg, Computed Tomography: Physical principles and biohazards, Department of Medicine and Care Radio Physics, Report, Faculty of Health Sciences, Linköping University, Sweden, (1995)
- [2] P. P. Bruyant, Analytic and Iterative Reconstruction Algorithms in SPECT, Nuclear Spectroscopy and Image Processing Research Group, Biophysics Laboratory, 43(10), 1343-58 (2002)
- [3] L. G. Hanson, Introduction to Magnetic Resonance Imaging Techniques, Danish Research Centre for Magnetic Resonance (DRCMR), Copenhagen University Hospital Hvidovre, (2009)
- [4] P.E. Valk, et al., Positron Emission Tomography. Basic Sciences, Springer: Heidelberg, (2003)
- [5] A. Alessio, P. Kinahan, PET Image Reconstruction, Nuclear Medicine 2, (2006)
- [6] A. Reader, H. Zaidi, Advances in PET Image Reconstruction, PET Clin 2, 173-190 (2007)
- [7] P. Moskal, patent application no. P 388555, (2009)
- [8] P. Moskal, et. al., Strip PET: a novel detectors concept for a TOF-PET scanner, Nuclear Medicine Review 15, Suppl. C: C68–C69, (2012)
- [9] F. A. Mettler, M. J. Guiberteau, M.D., Essentials of Nuclear Medicine Imaging, Saunders, (2012)
- [10] B. Aryal, Transfer of Learning with an Application to the Physics of Positron Emission, Department of Physics, Kansas Stare University, (2007)
- [11] Ł. Kapłon, Plastic scintillators for positron emission tomography obtained by the bulk polymerization method, Bio-Algorithms and Med-Systems 10, 27–31, (2014)
- [12] A. Wieczorek, A Pilot Study of the Novel J-PET Plastic Scintillator with 2-(4-styrylphenyl)benzoxazole as a Wavelength Shifter, Acta Physica Polonica A 127, 1487, (2015)
- [13] A. Heczko, J-PET documentation
- [14] P. Moskal, et. al., TOF-PET detector concept based on organic scintillators, Nuclear Medicine Review 15, C81 (2012)
-
[15]
http://ocw.mit.edu/courses/nuclear-engineering/22-01-introduction
-to-ionizing-radiation-fall-2006/lecture-notes/energy_dep_photo.pdf - [16] P. Moskal, et. al., A novel method for the line-of-response and time-of-flight reconstruction in TOF-PET detectors based on a library of synchronized model signals, Nuclear Instruments and Methods in Physics Research A., 775, 54-62, (2015) (2015)
- [17] N. G. Sharma, Different Foils Tests, PET UJ Report no. 10/2014, Jagiellonian University, (2014)
- [18] T. Bednarski, Photomultipliers gain calibration, PET UJ Report no. 1 - 3/2014, Jagiellonian University
- [19] T. Bednarski et. al., Calibration of photomultipliers gain used in th J-PET detector, Bio-Algorithms and Med-Systems, 10, 13–17, (2014)
- [20] M. Pawlik-Niedźwiecka, Studies of changes of signals shapes in plastic scintillator strips, master thesis, Jagiellonian University (2014)
- [21] Sz. Niedźwiecki, Studies of detection of radiation with use of organic scintillator detectors in view of positron emission tomography, master thesis, Jagiellonian University (2011)
- [22] W. Wiślicki et. al, Computing support for advanced medical data analysis and imaging, Bio-Bio-Algorithms and Med-Systems, 10, 53, (2014)
- [23] W. Krzemień, et. al., Analysis framework for the J-PET scanner, Acta Physica Plonica A, 127, 1491, (2015)
- [24] P. Moskal et. al., Hit time and hit position reconstruction in the J-PET detector based on a library of averaged model signals, Nuclear Instruments and Methods in Physics Research, 10, 1495-99 (2015)
- [25] H. Ikeda et. al., A detailed test of the CsI(T) calorimeter for BELLE with photon beams of energy between 20 MeV and 5.4 GeV, Nuclear Instruments and Methods in Physics Research A, Volume 441, 401-426, (2000)