Two Transiting Earth-size Planets Near Resonance Orbiting a Nearby Cool Star
Abstract
Discoveries from the prime Kepler mission demonstrated that small planets (< 3 ) are common outcomes of planet formation. While Kepler detected many such planets, all but a handful orbit faint, distant stars and are not amenable to precise follow up measurements. Here, we report the discovery of two small planets transiting K2-21, a bright () M0 dwarf located pc from Earth. We detected the transiting planets in photometry collected during Campaign 3 of NASA’s K2 mission. Analysis of transit light curves reveals that the planets have small radii compared to their host star, / = % and %, respectively. We obtained follow up NIR spectroscopy of K2-21 to constrain host star properties, which imply planet sizes of 1.59 0.43 and 1.92 0.53 , respectively, straddling the boundary between high-density, rocky planets and low-density planets with thick gaseous envelopes. The planets have orbital periods of 9.32414 days and 15.50120 days, respectively, and a period ratio = 1.6624, very near to the 5:3 mean motion resonance, which may be a record of the system’s formation history. Transit timing variations (TTVs) due to gravitational interactions between the planets may be detectable using ground-based telescopes. Finally, this system offers a convenient laboratory for studying the bulk composition and atmospheric properties of small planets with low equilibrium temperatures.
Subject headings:
K2-21— EPIC-206011691— techniques: photometric —techniques: spectroscopic1. Introduction
Analysis of photometry collected during the prime Kepler mission (2009–2013) demonstrated that small planets are common around G, K, & M dwarfs (Howard et al., 2012; Fressin et al., 2013; Petigura et al., 2013a; Dressing & Charbonneau, 2013a). Planets that are nearly Earth-size (1–2 ) and orbit close to their host stars ( < 100 days) are abundant around Sun-like stars (26% of G & K dwarfs host such a planet; Petigura et al., 2013a) and nearly ubiquitious around M dwarfs (1.2 planets per star; Dressing & Charbonneau, 2015). The higher occurrence of such planets around M dwarf hosts cannot be explained by higher detection efficiency for small planets around M dwarfs. Both Petigura et al. (2013a) and Dressing & Charbonneau (2015) empirically derived survey completeness by injecting mock transits into Kepler photometry and measuring the recovery rate. Both groups corrected for modest pipeline incompleteness ( for < 100 days, = 1–2 ). An open question is whether small planets are intrinsically more numerous around M dwarfs, or if M dwarf systems are more compact.
M dwarfs offer a convenient laboratory to study the bulk physical properties and atmospheres of small planets. Planet transits are deeper and radial velocity signatures are larger, for a given planet size and orbital period. Planets around M dwarfs having low equilibrium temperatures (e.g. Teq = 200–600 K) have tighter orbits with shorter orbital periods compared to similar planets around solar-type stars. These planets are especially compelling targets for atmospheric transmission spectroscopy by the James Webb Space Telescope (JWST), provided a sample of nearby, bright M dwarfs with warm transiting planets in the 1–3 size range can be identified (Batalha et al., 2015).
Finding planets that transit M dwarfs is difficult because the observable stars are generally faint, and the brightest (nearest) ones are sparsely distributed on the sky. Kepler surveyed a few thousand M dwarfs and only discovered 160 planet candidates, despite the high planet occurrence rate. To capitalize on the follow up opportunities, bright stars are required. Although the Kepler sample of M dwarfs was faint (median Kp = 15.5 mag), the magnitude-limited brightness distribution naturally included some brighter targets. Among the most favorable is Kepler-138 (Kp = 12.9 mag, = 9.5 mag), a system of three transiting planets, including two nearly Earth-size planets (1.2 ) in warm orbits (Jontof-Hutter et al., 2015; Kipping et al., 2014).
Now that Kepler is operating in the K2 mode, we have the opportunity to greatly expand the number of known small planets transiting bright M dwarfs. During K2 observations, the Kepler Space Telescope observes different regions of the ecliptic every 90 days, casting a wider net for nearby transiting planets (Howell et al., 2014). Essentially, each of the planned fourteen K2 pointings offers the possibility of discovering a sample of short-period planets orbiting bright stars that is similar to the ensemble from the prime Kepler mission.
Here we present the discovery of a new multi-planet system orbiting a bright M dwarf in the K2 Campaign 3 field, K2-21, also known as EPIC-206011691. This system is a cousin of Kepler-138, identified during the prime Kepler mission, and K2-3, a system of three transiting super-Earths discovered by our team in an earlier K2 Campaign (Crossfield et al., 2015). It also offers a preview of expected results from the TESS mission, when sky coverage will increase by another order of magnitude (Ricker et al., 2015).
In this paper, we describe our detection of K2-21b and c from K2 photometry along with our spectroscopic and imaging follow up in Section 2. In Section 3, we present our analysis of stellar properties, planet properties, and false positive probability. Finally, we place the K2-21 system in the context of other transiting planets in Section 4 and offer some thoughts regarding the rich follow up potential for this system.
2. Observations
2.1. K2 Photometry
K2-21 was observed during K2 Campaign 3 lasting from 2014 November 14 to 2015 February 3. The star is listed as EPIC-206011691 in the Mikulski Archive for Space Telescopes (MAST). Target properties, including optical and NIR photometry from APASS (Henden et al., 2012) and 2MASS (Skrutskie et al., 2006) are listed in Table 1.
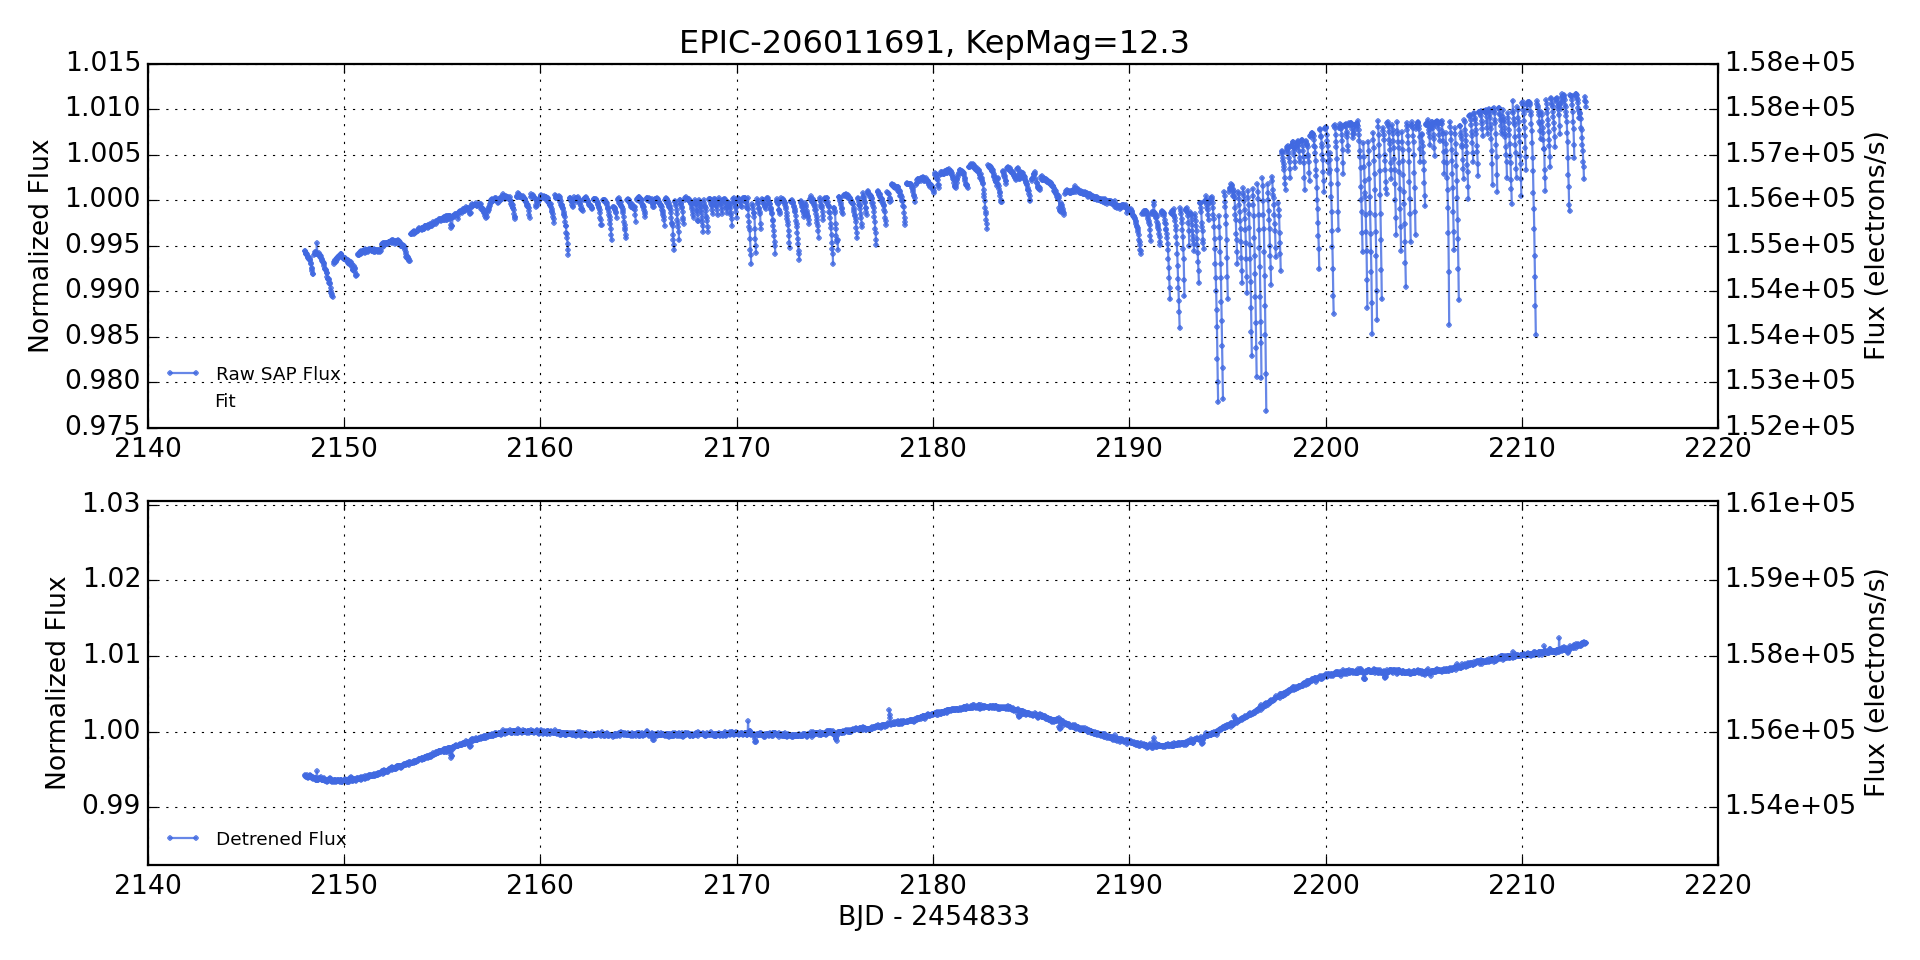
We extracted K2 photometry for the star K2-21 from the Kepler pixel data, which we downloaded from the MAST. Our photometric extraction routine is outlined in Crossfield et al. (2015). In brief, during K2 observations, stars drift across the CCD by 1 pixel every 6 hours. As the stars drift through pixel-phase, intra-pixel sensitivity variations and errors in the flatfield cause the apparent brightness of the target star to change. For every observation we solve for the roll angle between the target frame and an arbitrary reference observation. We model the time- and roll-dependent brightness variations using a Gaussian process. Figure 1 shows both the raw and corrected photometry. We do not see any evidence for stellar variability with timescales of < 5 days, suggesting that K2-21 is a slowly rotating star. The corrected light curve exhibits 1% variability on timescales longer than 10 days. This provides an upper limit on the intrinsic variability of K2-21 over long timescales. However, since stars drift perpendicular to the roll direction over the course of a campaign, it is difficult to disentangle long-term astrophysical variability from position-dependent variability. Our calibrated K2 photometry is included as an electronic supplement.
| Parameter | Units | Value | Source |
|---|---|---|---|
| Identifying information | |||
| EPIC ID | – | 206011691 | EPIC |
| 2MASS ID | – | 22411288-1429202 | 2MASS |
| R.A. | h:m:s | 22:41:12.89 | EPIC |
| Dec. | d:m:s | 14:29:20.35 | EPIC |
| d:m:s | 48:56:11.39 | EPIC | |
| d:m:s | 57:10:44.78 | EPIC | |
| Photometric Properties | |||
| Kp | mag | 12.31 | EPIC |
| B | mag | 14.14 0.06 | APASS |
| V | mag | 12.85 0.02 | APASS |
| g′ | mag | 13.53 0.02 | APASS |
| r′ | mag | 12.32 0.06 | APASS |
| i′ | mag | 11.76 0.06 | APASS |
| J | mag | 10.25 0.02 | 2MASS |
| H | mag | 9.63 0.02 | 2MASS |
| Ks | mag | 2MASS | |
| Spectroscopic and Derived Properties | |||
| mas yr-1 | Zacharias et al. (2012) | ||
| mas yr-1 | Zacharias et al. (2012) | ||
| Spectral Type | – | M0.00.5 | SpeX, this paper |
| Teff | K | SpeX, this paper | |
| Fe/H | dex | SpeX, this paper | |
| SpeX, this paper | |||
| SpeX, this paper | |||
| g cm-3 | SpeX, this paper | ||
| SpeX, this paper | |||
| Distance | pc | this paper | |
| Age | Gyr | 1 | this paper |
2.2. Transit Detection
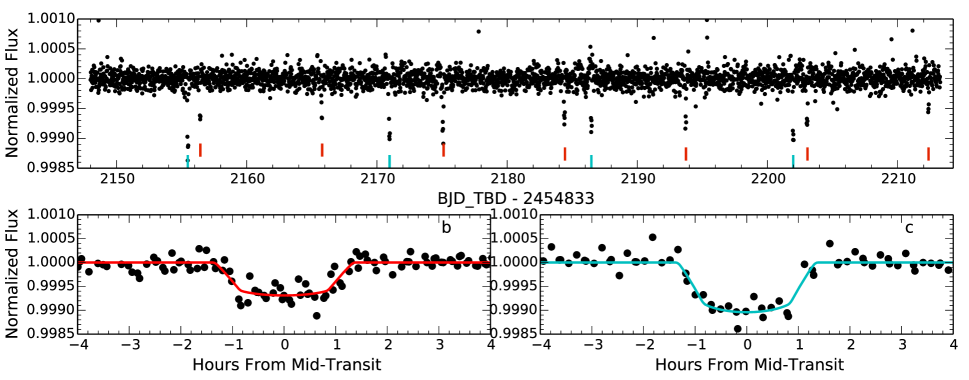
We searched through the calibrated and detrended photometry (top panel of Figure 2) using the TERRA algorithm described in Petigura et al. (2013b). TERRA identified a transit candidate having = 15.50120 days and signal-to-noise ratio (SNR) = 25. We fit this candidate with a Mandel & Agol (2002) model and subtracted the best fit model from the photometry. We reran TERRA on the photometry with the = 15.50120 day candidate removed. We found a second candidate having = 9.32414 days and SNR = 22. Again we removed the best-fitting model. In subsequent searches, TERRA did not find any additional periodic box-shaped signals.
2.3. Infrared and Optical Spectroscopy
We observed K2-21 on 2015 July 23 UT using the recently refurbished SpeX spectrograph (Rayner et al., 2003) on the 3.0 m NASA Infrared Telescope Facility (IRTF). The data were taken under clear skies with an average K-band seeing of 0.4–0.5 arcsec. We observed with the instrument in short cross dispersed mode (SXD) using the 0.3 15 arcsec slit. This setup provides simultaneous wavelength coverage from 0.7 to 2.5 m at a resolution of R 2000. The extended blue wavelength coverage is a result of the recent chip upgrade SpeX received in 2014 July. The target was placed at two positions along the slit and observed in an ABBA pattern for subsequent sky subtraction. The observing sequence consisted of 8 60 s exposures for a total integration time of 480 s. Once the exposures were stacked, this integration time led to a signal-to-noise of per resolution element. We obtained standard SpeX calibration frames consisting of flats and arclamp exposures immediately after observing K2-21.
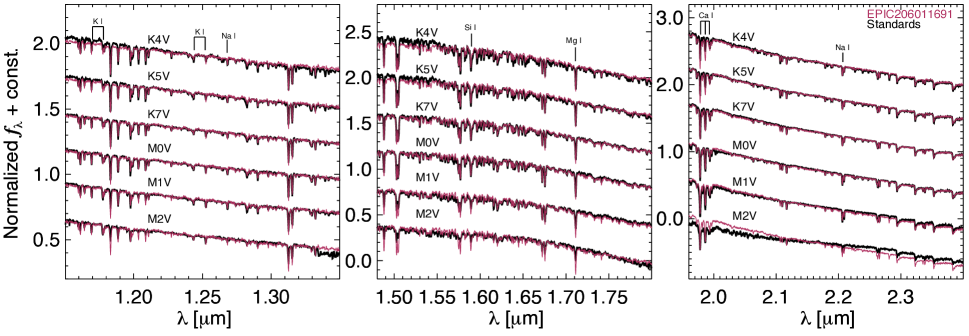
The SpeX spectrum was reduced using the SpeXTool package (Vacca et al., 2003; Cushing et al., 2004). SpeXTool performs flat fielding, bad pixel removal, wavelength calibration, sky subtraction, spectral extraction and combination, telluric correction, flux calibration, and order merging. Flux calibration and telluric corrections were perfomed using the spectrum of the A0V-type star HD 218639 which was observed within 16 minutes and 0.04 airmass of the target. The calibrated spectrum is compared to late-type standards from the IRTF Spectral Library (Cushing et al., 2005; Rayner et al., 2009) in Figure 3. K2-21 is a best visual match to the K7/M0 standards across the near-IR bands. We perform a more detailed spectral typing in Section 3.1.
K2-21 was also observed using Keck/HIRES (Vogt et al., 1994) on 2015 July 24 UT with a total integration time of 216s. HIRES provides wavelength coverage from 3600-8000 Å at . The spectrum was reduced using the standard pipeline of the California Planet Search (Marcy et al., 2008) and has SNR 45/pixel.
2.4. Archival and Adaptive Optics Imaging
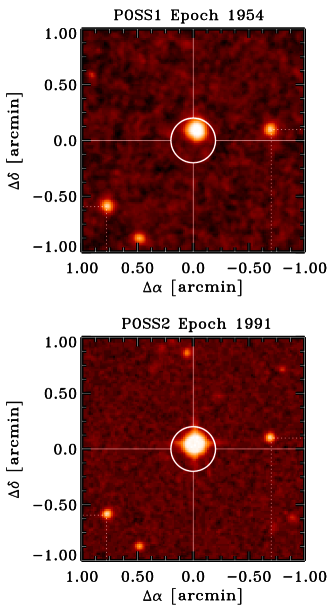
To assess the possibility of background stars falling inside the software aperture of Kepler pixels, we compare two epochs of imaging data from the Digitized Sky Survey (DSS). In Figure 4, we show the DSS-Blue plates taken on 1954 July 25 (top panel) and the DSS-Red plates taken on 1991 July 17 (bottom panel). The images are 22 arcmin and have a pixel scale of 1 arcsec/pixel. The images are centered on the epoch 2015 coordinates of the target as observed by Kepler (: 22:41:12.9, : -14:29:21.9 J2000.0) and the open circle represents the aperture size used when extracting the calibrated photometry.
The DSS images clearly show the proper motion of the primary target, while the nearby stars, located 40″ W and 60″ SE, show no significant astrometric motion. The primary target, in contrast, displays a clear proper motion of 3″ over 37 years, in reasonable agreement with the measured proper motion (Lépine & Gaidos, 2011; Zacharias et al., 2012). In the DSS image there is no evidence of a background star at the 2015 position of K2-21. We estimate that if a star is located this position, that star must be at least 2.5–3 mag fainter than K2-21.
We also obtained near-infrared adaptive optics images of EPIC 206011691 at Keck Observatory on the night of 2015 July 24 UT. Observations were obtained with the 1024 1024 NIRC2 array and the natural guide star system; the target star was bright enough to be used as the guide star. The data were acquired using the Kcont filter using the narrow camera field of view with a pixel scale of 9.942 mas/pixel. The Kcont filter has a narrower bandwidth (2.25–2.32 ) compared the K filter (1.99–2.40 ) and allows for longer integration times before saturation. A 3-point dither pattern was utilized to avoid the noisier lower left quadrant of the NIRC2 array. The 3-point dither pattern was observed thee times with 10 coadds and a 1.5 second integration time for a total on-source exposure time of s = 135 s.
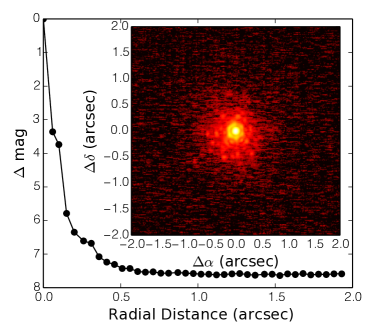
The target star was measured with a resolution of 0.06 arcsec (FWHM). No other stars were detected within the 10 arcsec field of view of the camera. In the Kcont filter, the data are sensitive to stars that have K-band contrast of at a separation of 0.1 arcsec and at 0.5 arcsec from the central star. We estimate the sensitivities by injecting fake sources with a signal-to-noise ratio of 5 into the final combined images at distances of FWHM from the central source, where is an integer. The 5 sensitivities, as a function of radius from the star, are shown in Figure 5.
3. Analysis
3.1. Stellar Parameters
Here, we derive K2-21 effective temperature, metallicity, mass, radius, and age from the IRTF/SpeX and Keck/HIRES spectra described in Section 2.3. Mann et al. (2013b) provide spectral indices and empirical fits to estimate M dwarf effective temperatures from optical and near-IR spectra. These indices and fits are calibrated using the M dwarf sample of Boyajian et al. (2012). Following these methods, we estimate the JHK-band temperatures of K2-21 and calculate a mean Teff and rms scatter to find Teff = K (148 K systematic error, 375 K total error). This range of effective temperatures is consistent with main-sequence dwarfs spanning the transition between K- and M-types (Pecaut & Mamajek, 2013). We use the metallicity calibration and software111https://github.com/awmann/metal of Mann et al. (2013a) to calculate K2-21’s metallicity using the H- and K-bands. The final metallicity is the mean of the H- and K-band estimates and the error is calculated from the quadrature sum of the measurement error and systematic error in each band. We find [Fe/H] = dex, approximately solar. Mann et al. (2013b) also provide empirical calibrations and software222https://github.com/awmann/Teff_rad_mass_lum to calculate the radii, masses, and luminosities of M dwarfs as a function of Teff. Using the most conservative Teff errors, we calculate = , = , and = . These values, and the other fundamental parameters of the star, are tabulated in Table 1 and are used for our calculations of the individual planet properties.
We also use our SpeX spectrum to estimate the spectral type of K2-21. We calculate the spectral type from several temperature sensitive molecular indices across the spectrum. In the optical, the TiO5 and CaH3 indices (Reid et al., 1995; Gizis, 1997) are covered by the spectrum and are calibrated for the earliest M dwarfs (Lépine et al., 2003). We follow the most recent spectral type calibrations of these indices by Lépine et al. (2013) and estimate a spectral type of K7.50.5. In the NIR, the H2O-K2 index of Rojas-Ayala et al. (2012) provides a spectral type of M0.00.5. We combine the optical and infrared types and adopt a final spectral type of M0.00.5V. Our fundamental parameter and spectral type analyses yield consistent results and are also consistent with our visual comparison of K2-21 to M dwarf standards. We compute a distance modulus, , to K2-21 by comparing the observed K-band magnitude to tabulated from Pecaut & Mamajek (2013), which gives a distance of pc.
Our HIRES spectrum provides access to the H line at 6563 Å. Lines in the hydrogen Balmer series are associated with magnetic activity in late-type stars and emission in the H line is used as a coarse age indicator (West et al., 2004, 2008). The HIRES spectrum exhibits H in absorption, consistent with an inactive star. We also investigate magnetic activity in K2-21 by analyzing its UV emission measured by GALEX (Martin et al., 2005). The star is a weak near-UV (NUV) emitter and was only marginally detected (2.5) in the far-UV (FUV). Its low NUV flux and marginal detection in the FUV are consistent with quiescent emission, similar to other nearby field M dwarfs (Shkolnik et al., 2011). For an M0 dwarf, H absorption and small UV flux are indicative of weak chromospheric activity and imply an age 1 Gyr (West et al., 2008).
3.2. Light Curve Fitting
We analyze the transit light curves using the same approach described by Crossfield et al. (2015). In brief, we fit each planet’s transit separately using a minimization and Markov Chain Monte Carlo (MCMC) analysis (Foreman-Mackey et al., 2013), using JKTEBOP (Southworth, 2011) to model the light curves.
When modeling the transit photometry, we adopt a linear limb-darkening law. While more complex (e.g. quadratic) limb-darkening prescriptions yield better fits to high SNR light curves, they are overkill given the shallow depths of the K2-21 transits. We impose Gaussian priors in our analysis. For the limb-darkening parameter, , we assume a distribution with center 0.56 and dispersion 0.13 by referring to the values tabulated by Claret et al. (2012). All of the MCMC parameters show unimodal distributions, and the inferred parameters are consistent with planets on circular orbits (Dawson & Johnson, 2012).
Figure 2 shows the resulting photometry and best-fit models, and Table 2 summarizes the final values and uncertainties. Of particular interest are the small sizes and low equilibrium temperatures of K2-21b and c. K2-21b and c have = 1.59 0.43 and = 1.92 0.53 , respectively. We estimate equilibrium temperature assuming zero albedo according to the following formula:
where is the Stefan-Boltzmann constant and is the incident stellar flux received by the planet. Planets b and c have equilibrium temperatures of K and K, respectively. These planets occupy a domain of planet size and incident stellar radiation which is largely devoid of RV mass measurements and transmission spectra. In Section 4, we place the K2-21 system in the context of the current sample of small transiting planets.
The transit profile constrains mean stellar density if one assumes a circular orbit. Since we fit each planet separately, we obtain two independent measurements for , g cm-3 and g cm-3, which are consistent with = g cm-3, derived from spectroscopy. The transit-derived stellar densities are also consistent with each other at the 1- level, as expected for planets transiting the same star.
| Parameter | Units | b | c |
|---|---|---|---|
| BJD | |||
| d | |||
| deg | |||
| % | |||
| hr | |||
| hr | |||
| – | |||
| – | |||
| – | |||
| g cm-3 | |||
| AU | |||
| Teq | K |
3.3. Ruling Out False Positives
Thus far, we have explained the transits seen in K2-21 photometry with two planets around a single M0 dwarf. Here, we assess the possibility that other “false positive” interpretations can explain the photometry. One such explanation is that the transits are due to background eclipsing binaries where the eclipses are diluted by K2-21. Since an M6 dwarf is fainter than an M0 dwarf in the Kepler band (),333Stellar parameters used in this section are drawn from Pecaut & Mamajek (2013) a pair of maximally eclipsing M6 dwarfs would be diluted to 500 ppm combined with the light of K2-21. Thus, we consider false positive scenarios involving M0–M6 companions.
Experience from the Kepler prime mission has shown that most multi-transiting systems (multis) are bona fide planets. Binary star systems have uniform inclination distributions and are uniformly distributed on the sky. Thus, the probability that two are inclined as seen from Earth and fall in the same software aperture is small. Lissauer et al. (2012) and Rowe et al. (2014) quantified the false positive probability for Kepler prime multis as < 1%. This probability represents an upper limit for Campaign 3 multis, given that the field was out of the plane of the Galaxy (), whereas the original Kepler field was near the plane of the Galaxy, where the density of background stars is higher.
Despite the low probability of the transits being due to background sources, we searched for companion stars falling within the software aperture shown in Figure 4. No such companions separated by more than 5 arcsec are visible in the archival DSS images of K2-21. Our NIRC2 image (Figure 5) rules out companions brighter than outside of 0.15 arcsec. Over the 61 years between 1954 and 2015, K2-21 moved by 5 arcsec relative to distant background stars. Any background stars having > 3 within 0.15 arcsec of the current position of K2-21 would be detectable in the POSS1 plates. The low statistical probability of eclipsing binaries mimicking a multi-transiting system, combined with the non-detection of any background object within our software aperture strongly suggests that the observed transits are not due to background eclipsing binaries.
We now consider the possibility that K2-21 has a bound companion with its own set of transiting companions. An M6 dwarf is 4 magnitudes fainter than an M0 in K-band. Consulting the contrast curve shown in Figure 5, we rule out companions M6 and earlier separated by more than 0.15 arcsec or 10 AU at a distance of pc.
We searched for close companions using our HIRES spectrum of K2-21. Adopting the methodology in Kolbl et al. (2015), we searched for spectroscopic binaries in our HIRES spectrum. We detect no secondary set of lines from a star having mag shifted by more than 15 km/s relative to the lines of the primary star. Shifts of > 15 km/s correspond to orbital separations of AU. Thus, the HIRES spectrum rules out bound dwarfs M4 and earlier within 2 AU.
While we have ruled out most of the parameter space where a companion star could be lurking, our search was not exhaustive. However, many of the remaining scenarios involving companions with intermediate separations do not pass stability considerations. A convenient length scale for considering dynamical interactions between planets is the mutual Hill radius,
where and denote mass and semi-major axis, respectively. The subscripts “in” and “out” correspond to the inner and outer planets, respectively. The separation between planet may be expressed in terms of their mutual Hill radius,
Gladman (1993) showed that two planets on initially circular orbits are unstable if .
Consider the following false positive scenario: K2-21 has a bound M5 companion at AU that hosts its own two-planet system. An M5 dwarf is 5.7 magnitudes fainter than a M0 in -band. In order to reproduce the observed transit depths, the transits across the M5 dwarf must be 190 deeper to account for dilution. The implied planet radii would much larger: 11 and 14 for planets b and c, respectively. In addition to the fact that M dwarfs rarely host planets planets larger than 3 (Dressing & Charbonneau, 2013b), this hypothetical system is dynamically unstable. Such large radii imply planet masses of > 100 and < 3.37. Such a system would not be stable over Gyr timescales. We conclude that the interpretation that K2-21 is a single star orbited by two planets is much more likely than interpretations involving companions that have evaded our follow up imaging and spectroscopy.
4. Discussion
4.1. Planet Masses and Radii at Low Stellar Irradiation
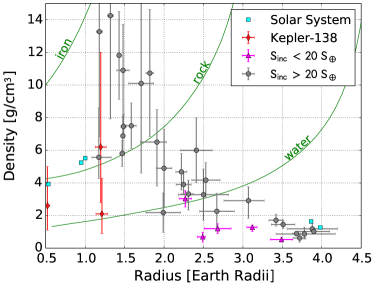
We report two small planets with sizes 1.59 0.43 and 1.92 0.53 orbiting K2-21, a nearby M dwarf. Figure 6 shows a density-radius diagram of all planets with 2- mass and radius measurements.444Data are drawn from the NASA Exoplanet Archive, July 28, 2015, http://exoplanetarchive.ipac.caltech.edu Planets transition from rocky compositions to possessing a significant low-density volatile envelope when their sizes exceed 1.5 (Marcy et al., 2014; Weiss & Marcy, 2014; Rogers, 2014). While the most likely radii of the K2-21 planets are larger than 1.5 , their 1- confidence intervals straddle 1.5 and offer a valuable probe of the densities and bulk compositions near the transition.
We can estimate planet masses using mass-radius studies from the prime Kepler mission. Adopting the empirical average mass-radius relationship from Weiss & Marcy (2014), we estimate K2-21b and c have masses of 4 and 5 , respectively. We emphasize that these mass estimates are crude given the large uncertanties in planet size and the large observed scatter in exoplanet densities for planets having = 1.5–2.0 . Assuming circular orbits, these planets would have RV semi-amplitudes = 1.7 m s-1 and 2.0 m s-1, respectively. Given the brightness of the host star (Kp = 12.3), measuring planet masses with ground-based spectrometers like HIRES and HARPS is possible, albeit challenging, assuming that the star has low levels of jitter. As a point of reference, Howard et al. (2013) and Pepe et al. (2013) measured the mass of Kepler-78b (Kp = 11.6), where m s-1.
In addition to their small size, the K2-21 planets are also noteworthy for their relatively low levels of incident stellar flux. The radii of close-in planets are likely to be actively sculpted by atmospheric mass loss. More than 80% of known planets with 2 receive 100 times more incident stellar radiation than Earth (i.e. > 100 ). Most of the exceptions orbit faint stars for which RV mass measurements and atmospheric characterization is not feasible. K2-21 is the brightest star known to host a planet 2.0 , < 20 , and days. It joins Kepler-138 and K2-3 on the list of bright (J 10.5 mag) stars known to host multiple small planets with low incident flux ( < 20 ). The K2-21 system is a laboratory to study the radii of planets where mass loss plays a weaker role.
TTV measurements of the Kepler-138 system by Jontof-Hutter et al. (2015) showed that at least one of these planets (d) is of surprisingly low density, defying the trend of otherwise rocky planets smaller than 1.5 . It is unclear whether the low measured density of Kepler-138 d is a product of limited photoevaporation, the result of different formation histories of compact multi-planet systems, or a systematic underestimation of planet masses derived by TTVs (see, e.g., Weiss & Marcy, 2014). Combined TTV, RV, and atmospheric follow-up of the K2-21 system has the potential to determine if small, cool, compact planets are typically low-density, informing models of planet formation and evolution.
4.2. Transit Timing Variations
Transit timing variations (TTVs) provide another avenue by which to constrain planet properties. Measuring TTVs with K2 is more challenging compared to the prime Kepler mission because the time baseline over which TTVs can accumulate is much shorter (65 days as opposed to 4 years). Despite these challenges, Armstrong et al. (2015) measured TTVs for K2-19b and c, using photometry from K2 and the ground-based NITES telescope.
For the K2-21 system, the ratio of the mean orbital periods is = 1.6624, close to a 5:3 period commensurability. This proximity indicates that these planets, though low in mass, could interact strongly enough gravitationally to produce observable TTVs. Although a formula for the TTVs of planets near a second order resonance has not yet been derived in the literature, we can use our understanding of TTVs for pairs of planets near first order mean motion resonances to hypothesize the important parameters. The “super-period” of the TTV signal, assuming the pair is not dynamically in the 5:3 resonance, will be given by days. The 65-day K2 time series represents only 7% of this super-period.
The amplitude of the TTV signal will depend linearly on the mass of the perturbing planet, relative to the mass of the host star (Agol et al., 2005) but also on the eccentricities () and longitudes of pericenter () of each planet. For first order resonances, the TTV amplitude and phase depend primarily on the quantities and and not on each of the eccentricities and pericenters individually (Lithwick et al., 2012). A similar result has been found empirically for second order resonances by fitting the TTVs of Kepler-138. Kepler-138c and d are near the 5:3 resonance and have poorly constrained absolute eccentricities and pericenters, though the differences and are measured well (Jontof-Hutter et al., 2015). Therefore, for second order resonances, these may also be the quantities that control the TTV amplitude.
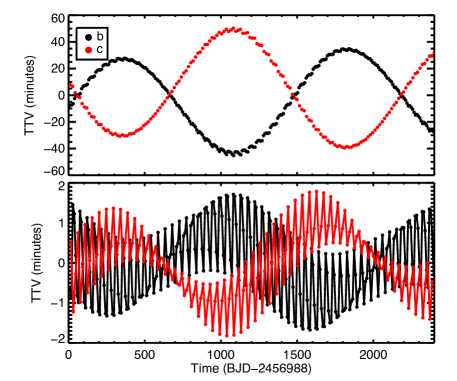
To estimate the amplitude of the TTVs, we assume nominal masses of = 4 and 5 . We choose low but reasonable eccentricities of . Based on the above reasoning, the maximum TTV signal should be achieved when the pericenters are anti-aligned, while it should be near minimized when the pericenters are aligned.
In Figure 7, we show the predicted TTVs in these two limiting cases. These TTVs were calculated with the publicly available n-planet numerical integration and transit timing code TTVFast (Deck et al., 2014). In the bottom panel, the TTVs are dominated by the synodic “chopping” signal associated with planetary conjunctions (Nesvorný & Vokrouhlický, 2014; Deck & Agol, 2015). This chopping pattern oscillates on the resonant timescale because of an aliasing effect (Deck & Agol, 2015).
Assuming nominal masses and eccentricities, TTVs range from 1 min to 1 hr, depending on the angle between planet pericenters. TTVs of 1 hr should be detectable from the ground. A detection of TTVs would further constrain the orbital parameters of the K2-21 planets and compliment RV measurements.
4.3. Formation Scenarios
The proximity of K2-21b and c to the 5:3 resonance may contain clues regarding their formation. The fractional deviation of the current period ratio from exact commensurability is . K2-21b and c may have been in resonance at some point in the past and may still be in resonance today. At this deviation from exact commensurability, the K2-21 pair would need eccentricities of approximately 0.05 to be locked in the resonance, according to the estimate of the width of the resonance derived by Veras & Armitage (2004) and given in Equation 4.46 of that work.
An open question is whether the close-in, small planets shown to be common around G, K, & M dwarfs form in situ (Hansen, 2014; Chiang & Laughlin, 2013) or migrate inward (Izidoro et al., 2014; Schlichting, 2014). Multi-planet systems migrating inward are thought to get trapped in resonance. However, the distribution of period ratios is largely uniform with an excess of planets just outside of first order resonance and a paucity just inside. Theories invoking inward migration have shown that it is possible for planets to break out of resonance (Goldreich & Schlichting, 2014).
Does the close proximity of the pair to the 5:3 resonance indicate that this system must have assembled via convergent migration and subsequent capture into resonance? There are a handful of known pairs of low-mass planets with period ratios that are even closer to the nearest low-order commensurability (within a deviation of 0.001, in a fractional sense; Fabrycky et al. 2014). However, as noted by Fabrycky et al. (2014), even formation processes which produce a smooth background period ratio distribution will contain some pairs that randomly fall very close to resonance. Though the proximity to resonance may dictate the dynamical evolution of these systems, it is not necessarily a smoking gun for assembly via convergent migration.
5. Conclusions
We report two small planet near mean motion resonance orbiting a bright M0 star observed during the K2 mission. This system is a convenient laboratory for studying the bulk compositions and atmospheric properties of small planets with low-equilibrium temperatures. Given that Kepler is expected to observe at least 14 fields in total, we expect many more exciting systems to emerge from the K2 mission.
References
- Agol et al. (2005) Agol, E., Steffen, J., Sari, R., & Clarkson, W. 2005, MNRAS, 359, 567
- Armstrong et al. (2015) Armstrong, D. J., Santerne, A., Veras, D., et al. 2015, ArXiv e-prints, arXiv:1503.00692
- Batalha et al. (2015) Batalha, N., Kalirai, J., Lunine, J., Clampin, M., & Lindler, D. 2015, arXiv:1507.02655, arXiv:1507.02655
- Boyajian et al. (2012) Boyajian, T. S., von Braun, K., van Belle, G., et al. 2012, ApJ, 757, 112
- Chiang & Laughlin (2013) Chiang, E., & Laughlin, G. 2013, MNRAS, 431, 3444
- Claret et al. (2012) Claret, A., Hauschildt, P. H., & Witte, S. 2012, A&A, 546, A14
- Crossfield et al. (2015) Crossfield, I. J. M., Petigura, E., Schlieder, J. E., et al. 2015, ApJ, 804, 10
- Cushing et al. (2005) Cushing, M. C., Rayner, J. T., & Vacca, W. D. 2005, ApJ, 623, 1115
- Cushing et al. (2004) Cushing, M. C., Vacca, W. D., & Rayner, J. T. 2004, PASP, 116, 362
- Dawson & Johnson (2012) Dawson, R. I., & Johnson, J. A. 2012, ApJ, 756, 122
- Deck & Agol (2015) Deck, K. M., & Agol, E. 2015, ApJ, 802, 116
- Deck et al. (2014) Deck, K. M., Agol, E., Holman, M. J., & Nesvorný, D. 2014, ApJ, 787, 132
- Dressing & Charbonneau (2013a) Dressing, C. D., & Charbonneau, D. 2013a, ApJ, 767, 95
- Dressing & Charbonneau (2013b) —. 2013b, ApJ, 767, 95
- Dressing & Charbonneau (2015) —. 2015, arXiv:1501.01623
- Fabrycky et al. (2014) Fabrycky, D. C., Lissauer, J. J., Ragozzine, D., et al. 2014, ApJ, 790, 146
- Foreman-Mackey et al. (2013) Foreman-Mackey, D., Hogg, D. W., Lang, D., & Goodman, J. 2013, PASP, 125, 306
- Fressin et al. (2013) Fressin, F., Torres, G., Charbonneau, D., et al. 2013, ApJ, 766, 81
- Gizis (1997) Gizis, J. E. 1997, AJ, 113, 806
- Gladman (1993) Gladman, B. 1993, Icarus, 106, 247
- Goldreich & Schlichting (2014) Goldreich, P., & Schlichting, H. E. 2014, AJ, 147, 32
- Hansen (2014) Hansen, B. M. S. 2014, arXiv:1403.6553
- Henden et al. (2012) Henden, A. A., Levine, S. E., Terrell, D., Smith, T. C., & Welch, D. 2012, Journal of the American Association of Variable Star Observers (JAAVSO), 40, 430
- Howard et al. (2012) Howard, A. W., Marcy, G. W., Bryson, S. T., et al. 2012, ApJS, 201, 15
- Howard et al. (2013) Howard, A. W., Sanchis-Ojeda, R., Marcy, G. W., et al. 2013, Nature, 503, 381
- Howell et al. (2014) Howell, S. B., Sobeck, C., Haas, M., et al. 2014, PASP, 126, 398
- Izidoro et al. (2014) Izidoro, A., Morbidelli, A., & Raymond, S. N. 2014, ApJ, 794, 11
- Jontof-Hutter et al. (2015) Jontof-Hutter, D., Rowe, J. F., Lissauer, J. J., Fabrycky, D. C., & Ford, E. B. 2015, Nature, 522, 321
- Kipping et al. (2014) Kipping, D. M., Nesvorný, D., Buchhave, L. A., et al. 2014, ApJ, 784, 28
- Kolbl et al. (2015) Kolbl, R., Marcy, G. W., Isaacson, H., & Howard, A. W. 2015, AJ, 149, 18
- Lépine & Gaidos (2011) Lépine, S., & Gaidos, E. 2011, AJ, 142, 138
- Lépine et al. (2013) Lépine, S., Hilton, E. J., Mann, A. W., et al. 2013, AJ, 145, 102
- Lépine et al. (2003) Lépine, S., Shara, M. M., & Rich, R. M. 2003, AJ, 126, 921
- Lissauer et al. (2012) Lissauer, J. J., Marcy, G. W., Rowe, J. F., et al. 2012, ApJ, 750, 112
- Lithwick et al. (2012) Lithwick, Y., Xie, J., & Wu, Y. 2012, ApJ, 761, 122
- Mandel & Agol (2002) Mandel, K., & Agol, E. 2002, ApJ, 580, L171
- Mann et al. (2013a) Mann, A. W., Brewer, J. M., Gaidos, E., Lépine, S., & Hilton, E. J. 2013a, AJ, 145, 52
- Mann et al. (2013b) Mann, A. W., Gaidos, E., & Ansdell, M. 2013b, ApJ, 779, 188
- Marcy et al. (2008) Marcy, G. W., Butler, R. P., Vogt, S. S., et al. 2008, Exoplanet properties from Lick, Keck and AAT, doi:10.1088/0031-8949/2008/T130/014001
- Marcy et al. (2014) Marcy, G. W., Isaacson, H., Howard, A. W., et al. 2014, ApJS, 210, 20
- Martin et al. (2005) Martin, D. C., Fanson, J., Schiminovich, D., et al. 2005, ApJ, 619, L1
- Nesvorný & Vokrouhlický (2014) Nesvorný, D., & Vokrouhlický, D. 2014, ApJ, 790, 58
- Pecaut & Mamajek (2013) Pecaut, M. J., & Mamajek, E. E. 2013, ApJS, 208, 9
- Pepe et al. (2013) Pepe, F., Cameron, A. C., Latham, D. W., et al. 2013, Nature, 503, 377
- Petigura et al. (2013a) Petigura, E. A., Howard, A. W., & Marcy, G. W. 2013a, Proceedings of the National Academy of Science, 110, 19273
- Petigura et al. (2013b) Petigura, E. A., Marcy, G. W., & Howard, A. W. 2013b, ApJ, 770, 69
- Rayner et al. (2009) Rayner, J. T., Cushing, M. C., & Vacca, W. D. 2009, ApJS, 185, 289
- Rayner et al. (2003) Rayner, J. T., Toomey, D. W., Onaka, P. M., et al. 2003, PASP, 115, 362
- Reid et al. (1995) Reid, I. N., Hawley, S. L., & Gizis, J. E. 1995, AJ, 110, 1838
- Ricker et al. (2015) Ricker, G. R., Winn, J. N., Vanderspek, R., et al. 2015, Journal of Astronomical Telescopes, Instruments, and Systems, 1, 014003
- Rogers (2014) Rogers, L. A. 2014, arXiv:1407.4457
- Rojas-Ayala et al. (2012) Rojas-Ayala, B., Covey, K. R., Muirhead, P. S., & Lloyd, J. P. 2012, ApJ, 748, 93
- Rowe et al. (2014) Rowe, J. F., Bryson, S. T., Marcy, G. W., et al. 2014, ApJ, 784, 45
- Schlichting (2014) Schlichting, H. E. 2014, ApJ, 795, L15
- Shkolnik et al. (2011) Shkolnik, E. L., Liu, M. C., Reid, I. N., Dupuy, T., & Weinberger, A. J. 2011, ApJ, 727, 6
- Skrutskie et al. (2006) Skrutskie, M. F., Cutri, R. M., Stiening, R., et al. 2006, AJ, 131, 1163
- Southworth (2011) Southworth, J. 2011, MNRAS, 417, 2166
- Vacca et al. (2003) Vacca, W. D., Cushing, M. C., & Rayner, J. T. 2003, PASP, 115, 389
- Veras & Armitage (2004) Veras, D., & Armitage, P. J. 2004, Icarus, 172, 349
- Vogt et al. (1994) Vogt, S. S., Allen, S. L., Bigelow, B. C., et al. 1994, in Society of Photo-Optical Instrumentation Engineers (SPIE) Conference Series, Vol. 2198, Instrumentation in Astronomy VIII, ed. D. L. Crawford & E. R. Craine, 362
- Weiss & Marcy (2014) Weiss, L. M., & Marcy, G. W. 2014, ApJ, 783, L6
- West et al. (2008) West, A. A., Hawley, S. L., Bochanski, J. J., et al. 2008, AJ, 135, 785
- West et al. (2004) West, A. A., Hawley, S. L., Walkowicz, L. M., et al. 2004, AJ, 128, 426
- Zacharias et al. (2012) Zacharias, N., Finch, C. T., Girard, T. M., et al. 2012, VizieR Online Data Catalog, 1322, 0
- Zeng & Sasselov (2013) Zeng, L., & Sasselov, D. 2013, PASP, 125, 227