Murchison Widefield Array Observations of Anomalous Variability: A Serendipitous Night-time Detection of Interplanetary Scintillation
Abstract
We present observations of high-amplitude rapid (2 s) variability toward two bright, compact extragalactic radio sources out of several hundred of the brightest radio sources in one of the MWA Epoch of Reionization fields using the Murchison Widefield Array (MWA) at 155 MHz. After rejecting intrinsic, instrumental, and ionospheric origins we consider the most likely explanation for this variability to be interplanetary scintillation (IPS), likely the result of a large coronal mass ejection propagating from the Sun. This is confirmed by roughly contemporaneous observations with the Ooty Radio Telescope. We see evidence for structure on spatial scales ranging from 1000 km to km. The serendipitous night-time nature of these detections illustrates the new regime that the MWA has opened for IPS studies with sensitive night-time, wide-field, low-frequency observations. This regime complements traditional dedicated strategies for observing IPS and can be utilized in real-time to facilitate dedicated follow-up observations. At the same time, it allows large-scale surveys for compact (arcsec) structures in low-frequency radio sources despite the resolution of the array.
Subject headings:
scattering — techniques: interferometric — Sun: coronal mass ejections (CMEs) — Sun: heliosphere — radio continuum: galaxies1. Introduction
Interplanetary scintillation (IPS) — the rapid (1 s–s) flux density variability of distant compact radio sources due to radio-wave propagation through inhomogeneities in the ionized solar wind — was discovered by Clarke (1964) and published by Hewish et al. (1964); the discovery led to high-time-resolution instrumentation that, in turn, led to the discovery of pulsars (Hewish et al., 1968). Interplanetary scintillation is an important technique in monitoring the structure and evolution of the solar wind (e.g., Coles, 1978; Manoharan & Ananthakrishnan, 1990; Jackson et al., 1998), particularly as a probe of major perturbations caused by solar flares and Coronal Mass Ejections (CMEs) (e.g., Tokumaru et al., 2003; Manoharan, 2010), and in constraining the nature of background radio sources (Little & Hewish, 1968).
Observations of IPS are typically made at low radio-frequencies, MHz, where the effects of plasma inhomogeneities are most apparent. At facilities such as the Ooty radio telescope (Manoharan, 2010), the Mexican Array Radio Telescope (MEXART; Mejia-Ambriz et al. 2010), and the Solar Wind Imaging Facility, Toyokawa (SWIFT; Tokumaru et al. 2011)/Solar-Terrestrial Environment Laboratory (STEL; Kojima & Kakinuma 1990), observations measure the modulation of hundreds of pre-selected radio sources each day and follow solar-wind events identified elsewhere. The new generation of low-frequency, wide-field radio telescopes such as the Murchison Widefield Array (MWA; Lonsdale et al. 2009; Tingay et al. 2013) and Low Frequency Array (LOFAR; van Haarlem et al., 2013) can undertake both dedicated observations of IPS (Oberoi & Benkevitch, 2010; Bisi et al., 2011; Fallows et al., 2013) — often at high time resolution — and make serendipitous discoveries, as discussed here. These ground-based radio IPS facilities complement space-based heliospheric imagers such as STEREO (Eyles et al., 2009), SDO (Schou et al., 2012), and Hinode (Culhane et al., 2007), and in-situ solar wind measurements from other spacecraft.
The MWA is a low frequency (80–300 MHz) interferometer located in Western Australia, with solar, heliospheric, and ionospheric studies as one of its major focuses (Bowman et al., 2013). The advantages of the MWA for IPS are: its southern hemisphere location (all major IPS facilities are in the northern hemisphere); its very wide field of view (over at 150 MHz); its high sensitivity for short integrations (100 mJy/beam rms for a 1 s integration); and its capability to make sub-second flux density measurements. Here we present the first serendipitous, exploratory observations of IPS using the MWA in its normal imaging mode with 2 s time resolution.
2. Observations and Data Analysis
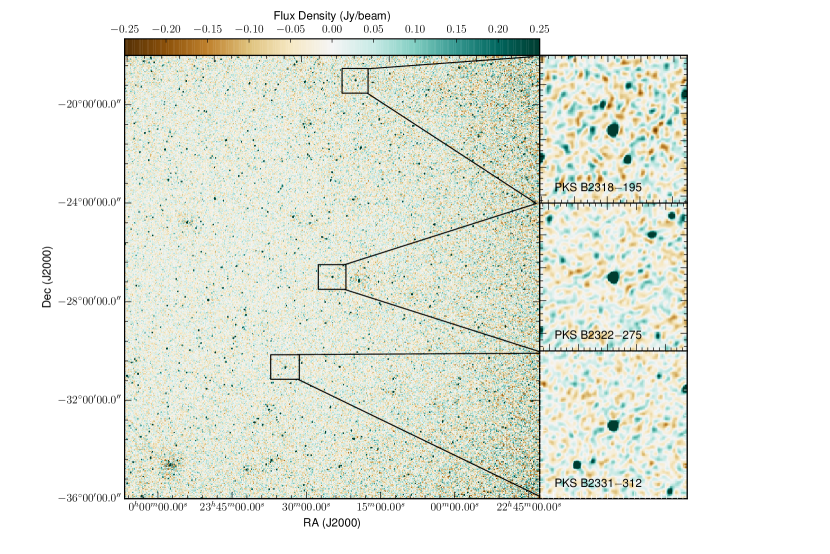
Data for this investigation were from commensal MWA proposals111http://www.mwatelescope.org/astronomers G0009 (“Epoch of Reionisation”) and G0005 (“Search for Variable and Transient Sources in the EoR Fields with the MWA”). The observations are of one of the MWA Epoch of Reionisation (EoR) fields (designated EoR0, and centered at J2000 RA=, Dec=; see Figure 1) and occurred between 11:30 and 14:14 UT on 2014 November 06, while the field was within approximately two hours of transit. The observations (see Loi et al. 2015a for more details) used 40 kHz fine channels across a 30.72 MHz bandwidth centered at 155 MHz and 2 s integrations; the correlated data were written to files of 2 min each, with gaps of 16–24 s between adjacent files.
Images were searched for Fast Radio Bursts (Lorimer et al., 2007; Thornton et al., 2013) using a processing pipeline which will be described elsewhere (Tingay et al., in preparation). A by-product of this processing is the total power variability for every object in the MWA field of view at 2 s cadence. Very strong detections were triggered at the position of PKS B2322275 (a redshift 1.27 quasar; McCarthy et al. 1996) during a two minute period (13:30:00–13:32:00 UT). This variability prompted the detailed follow-up analysis described below.
2.1. Real-Time System analysis
Once the initial variability from PKS B2322275 was identified, we searched for variability from other objects in the field. We analyzed data from the MWA Real-Time System (RTS; Mitchell et al. 2008; Tingay et al. 2013), which derives calibration solutions including flux densities for hundreds of sources over the MWA field-of-view during each integration. For each of the sources measured by the RTS (down to 155-MHz flux densities of about 1 Jy/beam, depending on the position in the MWA primary beam) we examined the modulation during the observation. Most of the sources had no substantial excess variability (confirming the results of Bell et al. 2014 and Hurley-Walker et al. 2014). However, we did identify a second source that had significant (% over a 2-min interval) modulation, which we identified as PKS B2318195. We focus on these two sources; both are bright and have no nearby neighbors to corrupt the flux density measurements (Fig. 1).
2.2. Imaging Analysis
To refine our analysis, we retrieved the observations from 2014 November 06 11:30 UT to 2014 November 06 14:14 UT from the MWA archive. The processing followed standard MWA procedures (e.g., Hurley-Walker et al., 2014). We calibrated the data using an observation of 3C 444, then rotated the phases of the visibilities to center the field on PKS B2322275. We imaged individual 2 s integrations in the XX and YY instrumental polarizations using WSClean (Offringa et al., 2014), performing 200 CLEAN iterations on each and making images with pixels, with synthesized beam full-width at half maximum of . Finally, we corrected the instrumental polarization to Stokes I (total intensity) using the primary beam from Sutinjo et al. (2015). For a single 2-s integration, the average image noise was 0.16 Jy/beam. In Figure 1 we show a 2 min integration with a slightly wider field-of-view, which has a rms noise of about 0.05 Jy/beam.
We then used Aegean (Hancock et al., 2012) to measure the flux densities and positions of PKS B2322275, PKS B2318195, and a number of other sources with comparable (4–10 Jy) flux densities. Both targets had mean flux densities consistent with catalog values (5.8 Jy at 160 MHz for PKS B2322275, and 4.8 Jy at 155 MHz for PKS B2318195; Slee 1995; Hurley-Walker et al. 2014). For each integration we determined the mean fractional variation — caused by residual instrumental/ionospheric effects — of a number of other sources and divided it from each integration. We plot the resulting time series in Figure 2. We also show the modulation index (rms divided by mean over a 2 min interval) for PKS B2322275 and PKS B2318195. For comparison, we plot the flux densities of one of the reference sources (PKS B2331312, also shown in Fig. 1) and of PKS B2322275 on another night with a comparable data-set (2014 October 16, chosen randomly). During the quiescent periods both PKS B2322275 and PKS B2318195 have modulation comparable to that for the reference source and PKS B2322275 on the comparison night (roughly 5%, consistent with the measured noise properties). But at the peak, both PKS B2322275 and PKS B2318195 show modulation of % peak-to-peak on 2-s timescales, corresponding to rms variations of % averaged over 2-min. For PKS B2322275 we see that the brightest spike occurs first at the upper edge of the bandpass before progressing down, giving large apparent swings in the instantaneous spectral index. The variations for PKS B2322275 appear roughly 20 min before those in PKS B2318195, which is about north of PKS B2322275 and at a slightly higher solar elongation ( for PKS B2322275 vs. for PKS B2318195) appears to start 20–30 min after that for PKS B2322275. There is no indication of increases in the amplitude of position fluctuations during the period of most intense variability, with fluctuations of about .
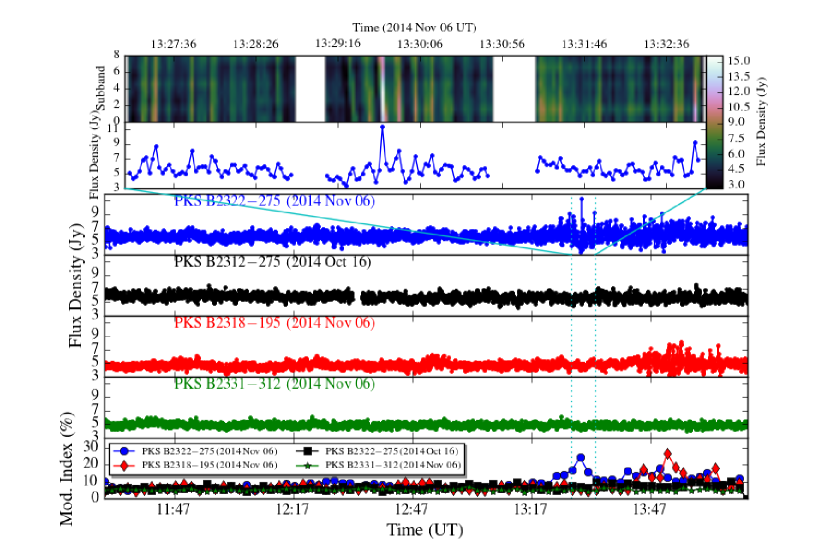
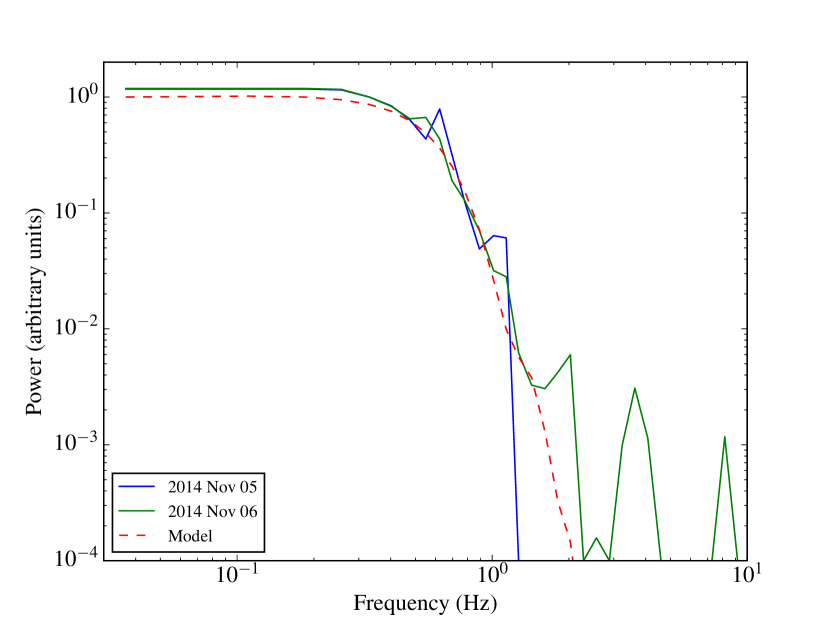
In Figure 3 we show temporal power spectra for PKS B2322275 and PKS B2318195 (again with PKS B2331312 and with PKS B2322275 from another night for comparison) created from the parts of Figure 2 with strong variability. Both PKS B2322275 and PKS B2318195 have considerably more power at frequencies above roughly 0.06 Hz than the comparison observation. Below this point the power spectra are similar, suggesting that this is the transition to “normal” variability (likely dominated by the ionosphere, which should affect all sources roughly equally). Above the transition both scintillating sources are similar, declining with spectral slopes of roughly .
3. Discussion
3.1. Origin of Variability
We can reject intrinsic variability since it appears for more than one source at roughly the same time. Moreover, light travel time arguments for an AGN rule out the 2-s timescale we see, and the extreme apparent spectral swings do not resemble any known source behavior. Instrumental effects are also ruled out, since the timescales for instrumental changes (30 min) are far longer than the fluctuations we see and only two sources vary. We are then left with propagation effects, i.e., scintillation due to inhomogeneous, turbulent plasma along the line of sight. We must consider whether scintillation is of interstellar, interplanetary, or ionospheric origin.
Refractive interstellar scintillation causes much slower (minutes to months) tens-of-percent variations in the flux densities of compact radio sources, with the timescale increasing at lower frequencies (e.g., Rickett, 1986), hence can be clearly ruled out. Diffractive scintillation can be substantially faster (Cordes & Rickett, 1998), but would require sizes that imply brightness temperatures of K — impossible for an AGN (Readhead, 1994).
Ionospheric scintillation affects sources with angular sizes (Loi et al., 2015b), causing joint position- and amplitude fluctuations on timescales of s (Thompson et al., 2001), with the former a significant source of position wander in MWA data (Hurley-Walker et al., 2014; Loi et al., 2015b) and the latter usually not very significant (although see Fallows et al. 2014). Therefore, ionospheric refraction should affect the thousands of unresolved sources in each image. In contrast, here the very strong amplitude fluctuations without any position shifts for unresolved sources and the rather small number of scintillating sources argue strongly against scattering by ionospheric plasma.
In contrast, IPS requires significant source structure on scales (Hewish et al., 1964; Little & Hewish, 1968). All three sources discussed here are regularly monitored for IPS with Ooty: both PKS B2322275 and PKS B2318195 are often seen to scintillate with Ooty, consistent with angular sizes of (at 327 MHz), while Ooty sees very little (if any) scintillation toward PKS B2331312. Note that Ooty does not observe past , so it could not monitor PKS B2322275 during this event, although it did observe a number of nearby sources at (Figs. 3 and 4) that showed enhanced scintillation on 2014 November 06 at frequencies Hz.
Moreover, the two scintillating sources are detected at frequencies up to 20 GHz (Murphy et al., 2010), suggesting the presence of compact structure222PKS B2322275 is one of only two sources in this field brighter than 5 Jy at 180 MHz which is unresolved at 20 GHz (determined by its 6 km-baseline flux density). PKS B2318195 is partially resolved at 20 GHz, suggesting some arcsecond-scale structure but also significant compact emission. (Chhetri et al., 2013). In contrast, PKS B2331312 has a similar flux density at 155 MHz (Hurley-Walker et al., 2014) but is not detected above 5 GHz (implying a steeper spectral index , with ) and hence likely has more extended emission. This can explain why PKS B2322275 and PKS B2318195 were observed to be the only significant bright scintillators. That would not be the case for an ionospheric origin.
Finally, NASA’s Omniweb database333See http://omniweb.gsfc.nasa.gov/. suggests that only weak auroral and ionospheric activity occurred on both nights, with no clear CME arriving at Earth, modest indices444See http://www.ngdc.noaa.gov/stp/GEOMAG/kp_ap.html. (global average magnetic activity) of about 2, and temporal behavior over the whole field typical of quiet ionospheric conditions555While we do see a modest enhancement in the auroral activity (given by the AE index) that peaks near 13:25 UT, the enhancement is not very notable, there are multiple enhancements that day, and there are even more significant enhancements on our comparison night which are not coincident with scintillation. (S. T. Loi 2015, pers. comm.). Absent any other viable explanation for what we see, and since what we see agrees with all of the known properties (amplitude, time-scale, and source selection) of IPS (as in Hewish et al. 1964), we conclude IPS the most likely origin of the anomalous variability. This is largely confirmed by the Ooty Radio Telescope observations.

3.2. Variability Properties
The modulation of PKS B2318195 appears to start 20–30 min after that for PKS B2322275, and that the period of enhanced modulation lasts for about 30 min for both sources (although some of the modulation may extend past the end of our observing period). Assuming the modulation is caused by IPS from a CME, the elongation difference implies a speed of for a distance of 0.1 AU. This speed is consistent with those inferred from Ooty observations on 2014 November 06, where a number of sources at elongations that were in the same direction as PKS B2322275 and PKS B2318195 showed significantly enhanced scintillation (see Fig. 3 for an example). For a solar wind speed of , we infer a minimum transverse size of the CME of km from the duration of the modulation. However, given typical radial expansion of CMEs (e.g., Manoharan et al., 2000) we expect radial sizes of 0.2–0.4 AU. Therefore we believe that the duration of the IPS is set by the thickness of some sub-structure within the putative CME.
As there is significant variability down to our sampling of 2 s, we infer CME structure on scales down to 1000 km. We see an apparent transition from a flat power spectrum to a decline in Figure 3. This may be associated with the Fresnel scale, above which IPS is suppressed (Manoharan & Ananthakrishnan, 1990). However, actually measuring the Fresnel scale and directly constraining the turbulent properties generally requires considerably faster sampling. Instead, since the rms fluctuations are %, it is likely that the sources are partially resolved by IPS, the change in spectral slope could have more to do more with intrinsic source sub-structure (this would be consistent with the change in scintillation with radio frequency in Fig. 2).
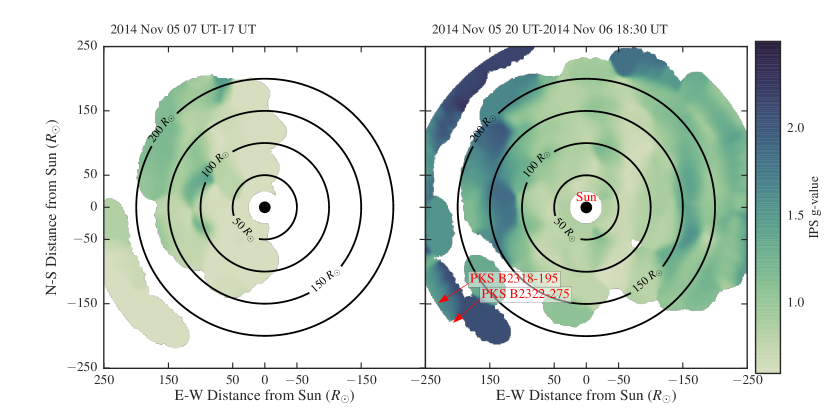
3.3. Identification of Candidate CMEs
At the time of the observation, PKS B2322275 was at and a position angle of about (east of north). So any plasma structure that caused the scintillation would have to have been outside the orbit of the Earth and below the ecliptic (Fig. 4). With typical speeds of 500–1000 , we searched for CMEs that were observed to occur around 3–5 days before our observations. Among the CMEs identified by Computer Aided CME Tracking software (CACTus; Robbrecht, Berghmans, & Van der Linden 2009) we identified a number with reasonable ejection times and angles. The scintillation image produced by the Ooty Radio Telescope (Fig. 4) for 2014 November 05 up to 17:00 UT shows little scintillation in the direction towards PKS B2322275, while the scintillation increased significantly after 20:00 UT and contiuing on 2014 November 06. Without more detailed tracking or simulation of heliospheric structures, especially beyond Earth, we cannot conclusively determine whether a specific CME or region resulting from multiple CME interactions caused the observed scintillations.
4. Conclusions
Plans for observations of IPS with the new generation of low-frequency radio telescopes, namely LOFAR and the MWA, concentrate on dedicated high-time-resolution (ms) observations of pre-selected sources. The temporal and frequency dependence of IPS flux variations help probe the structure of the solar wind (including possible CMEs) (e.g., Oberoi & Benkevitch, 2010; Fallows et al., 2013; Bowman et al., 2013). These observations are similar in strategy to dedicated programs with existing facilities like the Ooty radio telescope (Manoharan, 2010), which measures scintillation of 400–800 sources each day distributed over .
Assuming the variability we see is related to IPS, we have discussed a different regime. First, we used commensal night-time observations with the MWA, so . Second, the sources observed at facilities like Ooty correspond to 155 MHz flux densities Jy, which have an areal density of (Williams et al., 2012). Over the 600 MWA field-of-view that means we would detect at least 20 of these bright sources. In fact, we can sensitively probe flux density variations of 20% in a single 2-s integration for sources as weak as 1 Jy, which have a sky density higher. Therefore, the density of sight-lines on the sky available to probe IPS is a factor of five finer, and in fact weaker sources are observed to vary (at lower confidence) along with the sources discussed here. While the 2 s integrations used here average over much of the higher-time-resolution IPS structure, quasi-real time analysis (as in Mitchell et al. 2008) can be used to identify scintillating sources which can then be followed at higher time resolution using dedicated observations (Tremblay et al., 2015).
One difficulty in interpreting our results, though, comes from the fact that we are looking outside the Earth’s orbit, where the geometry does not allow easy identification of the distances to turbulent structures (cf., Armstrong & Coles, 1978). Even so, we can still examine the statistics of IPS-like variability over multi-year timescales, correlating it with dedicated ground- and space-based solar observing. We can also probe the fraction of compact (arcsec) emission from the roughly bright, high-latitude (where scatter broadening will not matter; Cordes & Lazio 2002) sources to be observed in various MWA surveys (cf. hundreds of sources in Little & Hewish 1968; Jeyakumar et al. 2000, although see Hajivassiliou & Duffett-Smith 1990), providing a useful adjunct to calibrator surveys and allowing connections between spectral and spatial properties of sources.
Finally, we note that the existence of strong IPS in nighttime observations of a primary field for the MWA EoR experiment using nominal imaging parameters may be concerning. However, a detailed analysis by Trott & Tingay (2015) shows that under all but extreme conditions, IPS will not affect the detectability of the EoR signal.
References
- Armstrong & Coles (1978) Armstrong, J. W. & Coles, W. A. 1978, ApJ, 220, 346
- Bell et al. (2014) Bell, M. E., Murphy, T., Kaplan, D. L., et al. 2014, MNRAS, 438, 352
- Bisi et al. (2011) Bisi, M. M., Fallows, R. A., Jensen, E. A., Breen, A., Xiong, M., & Jackson, B. V. 2011, AGU Fall Meeting Abstracts, C2020
- Bowman et al. (2013) Bowman, J. D., Cairns, I., Kaplan, D. L., et al. 2013, PASA, 30, 31
- Chhetri et al. (2013) Chhetri, R., Ekers, R. D., Jones, P. A., & Ricci, R. 2013, MNRAS, 434, 956
- Clarke (1964) Clarke, M. 1964, PhD thesis, Cambridge University
- Coles (1978) Coles, W. A. 1978, Space Sci. Rev., 21, 411
- Cordes & Lazio (2002) Cordes, J. M. & Lazio, T. J. W. 2002, ArXiv Astrophysics e-prints
- Cordes & Rickett (1998) Cordes, J. M. & Rickett, B. J. 1998, ApJ, 507, 846
- Culhane et al. (2007) Culhane, J. L., Harra, L. K., James, A. M., et al. 2007, Sol. Phys., 243, 19
- Eyles et al. (2009) Eyles, C. J., Harrison, R. A., Davis, C. J., et al. 2009, Sol. Phys., 254, 387
- Fallows et al. (2013) Fallows, R. A., Asgekar, A., Bisi, M. M., Breen, A. R., & ter-Veen, S. 2013, Sol. Phys., 285, 127
- Fallows et al. (2014) Fallows, R. A., Coles, W. A., McKay-Bukowski, D., & others. 2014, Journal of Geophysical Research (Space Physics), 119, 10544
- Hajivassiliou & Duffett-Smith (1990) Hajivassiliou, C. A. & Duffett-Smith, P. J. 1990, MNRAS, 247, 491
- Hancock et al. (2012) Hancock, P. J., Murphy, T., Gaensler, B. M., Hopkins, A., & Curran, J. R. 2012, MNRAS, 422, 1812
- Hewish et al. (1968) Hewish, A., Bell, S. J., Pilkington, J. D. H., Scott, P. F., & Collins, R. A. 1968, Nature, 217, 709
- Hewish et al. (1964) Hewish, A., Scott, P. F., & Wills, D. 1964, Nature, 203, 1214
- Hurley-Walker et al. (2014) Hurley-Walker, N., Morgan, J., Wayth, R. B., et al. 2014, PASA, 31, 45
- Jackson et al. (1998) Jackson, B. V., Hick, P. L., Kojima, M., & Yokobe, A. 1998, J. Geophys. Res., 103, 12049
- Jeyakumar et al. (2000) Jeyakumar, S., Saikia, D. J., Pramesh Rao, A., & Balasubramanian, V. 2000, A&A, 362, 27
- Kojima & Kakinuma (1990) Kojima, M. & Kakinuma, T. 1990, Space Sci. Rev., 53, 173
- Little & Hewish (1968) Little, L. T. & Hewish, E. 1968, MNRAS, 138, 393
- Loi et al. (2015a) Loi, S. T., Murphy, T., Cairns, I. H., et al. 2015a, Geophys. Res. Lett., 42, 3707
- Loi et al. (2015b) Loi, S. T. et al. 2015b, MNRAS, submitted
- Lonsdale et al. (2009) Lonsdale, C. J., Cappallo, R. J., Morales, M. F., et al. 2009, IEEE Proceedings, 97, 1497
- Lorimer et al. (2007) Lorimer, D. R., Bailes, M., McLaughlin, M. A., Narkevic, D. J., & Crawford, F. 2007, Science, 318, 777
- Manoharan (2010) Manoharan, P. K. 2010, Sol. Phys., 265, 137
- Manoharan & Ananthakrishnan (1990) Manoharan, P. K. & Ananthakrishnan, S. 1990, MNRAS, 244, 691
- Manoharan et al. (2000) Manoharan, P. K., Kojima, M., Gopalswamy, N., Kondo, T., & Smith, Z. 2000, ApJ, 530, 1061
- McCarthy et al. (1996) McCarthy, P. J., Kapahi, V. K., van Breugel, W., Persson, S. E., Athreya, R., & Subrahmanya, C. R. 1996, ApJS, 107, 19
- Mejia-Ambriz et al. (2010) Mejia-Ambriz, J. C., Villanueva-Hernandez, P., Gonzalez-Esparza, J. A., Aguilar-Rodriguez, E., & Jeyakumar, S. 2010, Sol. Phys., 265, 309
- Mitchell et al. (2008) Mitchell, D. A., Greenhill, L. J., Wayth, R. B., et al. 2008, IEEE Journal of Selected Topics in Signal Processing, 2, 707
- Murphy et al. (2010) Murphy, T., Sadler, E. M., Ekers, R. D., et al. 2010, MNRAS, 402, 2403
- Oberoi & Benkevitch (2010) Oberoi, D. & Benkevitch, L. 2010, Sol. Phys., 265, 293
- Offringa et al. (2014) Offringa, A. R., McKinley, B., Hurley-Walker, N., et al. 2014, MNRAS, 444, 606
- Readhead (1994) Readhead, A. C. S. 1994, ApJ, 426, 51
- Rickett (1986) Rickett, B. J. 1986, ApJ, 307, 564
- Robbrecht et al. (2009) Robbrecht, E., Berghmans, D., & Van der Linden, R. A. M. 2009, ApJ, 691, 1222
- Schou et al. (2012) Schou, J., Scherrer, P. H., Bush, R. I., et al. 2012, Sol. Phys., 275, 229
- Slee (1995) Slee, O. B. 1995, Australian Journal of Physics, 48, 143
- Sutinjo et al. (2015) Sutinjo, A., O’Sullivan, J., Lenc, E., Wayth, R. B., Padhi, S., Hall, P., & Tingay, S. J. 2015, Radio Science, 50, 52
- Thompson et al. (2001) Thompson, A. R., Moran, J. M., & Swenson, Jr., G. W. 2001, Interferometry and Synthesis in Radio Astronomy, 2nd edn. (New York: Wiley)
- Thornton et al. (2013) Thornton, D., Stappers, B., Bailes, M., et al. 2013, Science, 341, 53
- Tingay et al. (2013) Tingay, S. J., Goeke, R., Bowman, J. D., et al. 2013, PASA, 30, 7
- Tokumaru et al. (2011) Tokumaru, M., Kojima, M., Fujiki, K., Maruyama, K., Maruyama, Y., Ito, H., & Iju, T. 2011, Radio Science, 46, 0
- Tokumaru et al. (2003) Tokumaru, M., Kojima, M., Fujiki, K., Yamashita, M., & Yokobe, A. 2003, Journal of Geophysical Research (Space Physics), 108, 1220
- Tremblay et al. (2015) Tremblay, S. E., Ord, S. M., Bhat, N. D. R., et al. 2015, PASA, 32, 5
- Trott & Tingay (2015) Trott, C. & Tingay, S. J. 2015, ApJ, submitted
- van Haarlem et al. (2013) van Haarlem, M. P., Wise, M. W., Gunst, A. W., et al. 2013, A&A, 556, A2
- Williams et al. (2012) Williams, C. L., Hewitt, J. N., Levine, A. M., et al. 2012, ApJ, 755, 47