Nuclear shape coexistence in Po isotopes: An interacting boson model study
Abstract
- Background:
-
The lead region, Po, Pb, Hg, and Pt, shows up the presence of coexisting structures having different deformation and corresponding to different particle-hole configurations in the Shell Model language.
- Purpose:
-
We intend to study the importance of configuration mixing in the understanding of the nuclear structure of even-even Po isotopes, where the shape coexistence phenomena are not clear enough.
- Method:
-
We study in detail a long chain of polonium isotopes, 190-208Po, using the interacting boson model with configuration mixing (IBM-CM). We fix the parameters of the Hamiltonians through a least-squares fit to the known energies and absolute B(E2) transition rates of states up to MeV.
- Results:
-
We obtained the IBM-CM Hamiltonians and we calculate excitation energies, B(E2)’s, electric quadrupole moments, nuclear radii and isotopic shifts, quadrupole shape invariants, wave functions, and deformations.
- Conclusions:
-
We obtain a good agreement with the experimental data for all the studied observables and we conclude that shape coexistence phenomenon is hidden in Po isotopes, very much as in the case of the Pt isotopes.
pacs:
21.10.-k, 21.60.-n, 21.60.FwI Introduction
Shape coexistence has been observed by now all through the nuclear mass region, encompassing both light nuclei (16O region) morinaga56 , proceeding up to the region of very heavy nuclei in the Pb region duppen84 ; andrei00 , and have been reviewed in a number of papers over a period spanning about 3 decades hey83 ; wood92 ; heyde11 . Recent advances in experimental methods to explore nuclei, removed far from the region of -stable nuclei, have opened up possibilities to explore the appearance and behavior of shape coexistence in series of isotopes and isotones blum13 . A wealth of new data, on both energy systematics, but, more important, on observables such as in-beam spectroscopy and lifetime data jul01 ; gade08 , Coulomb excitation using inverse kinematics gorgen10 , direct reactions on unstable nuclei hansen03 , radioactive decay modes at the limits of nuclear stability pfutz12 , and break-up reactions bauman12 have been at the basis of recognizing the rather universal appearance of shape coexisting phenomena heyde11 . Moreover, measurement of the essential ground-state properties, such as masses blaum13 , charge radii cheal10 and nuclear moments neyens03 , as well as the possibilities to study monopole E0 transitions in nuclei wood99 ; kib05 , helped completing the data basis in such a way as to confront theoretical modelling of nuclear structure properties in greater detail than before.
From a theoretical side, present-day methods starting from both the nuclear shell model, or approaching the atomic nucleus using mean-field methods have resulted in developments of both new algorithms as well as making use of the increased computing possibilities (see caurier99 ; brown14 ; shimi12 and references therein). The present status has evolved in a situation where the conditions for shape coexistence to occur are becoming understood. It looks like a balance between two opposing nuclear force components, i.e., on one side the stabilizing effect caused by the presence of closed shells (the monopole part), aiming at stabilizing the nucleus into a spherical shape, versus the low-multipole (mainly quadrupole) components redistributing protons and neutrons into a deformed shape is at the origin of the appearance of shape coexistence in a given mass region. Recent large-scale shell-model studies (LSSM), using diagonalization in a very large many-open shell basis in various mass regions caurier05 or making use of an advanced Monte-Carlo shell-model approach (MCSM) shimi12 , have been carried out. Besides, the concept to start from deformed average potentials and calculating the total energy curves as a function of deformation has been explored, in particular, for nuclei in the Pb region bengt87 ; bengt89 ; naza93 . However, recent studies bender03 , using a microscopic approach to determine the optimal mean fields, even going beyond when bringing in the nuclear dynamics, have given quantitative results - using both Skyrme forces Skyr59 ; Vaut72 ; bender03 ; erler11 and Gogny forces gogny73 ; gogny75 ; gogny80 ; gogny88 ; liber99 , as well as making use of a relativistic mean-field approach walecka74 ; serot86 ; reinhard89 ; serot92 ; ring96 ; niksic11 - that are indicative of the above mechanism. Moreover, attempts have been made and are still improved to extract a Bohr Hamiltonian bomot75 ; rowe10 starting from a microscopic basis proc09 ; dela10 ; matsu10 .
From a microscopic shell-model point of view, the hope to treat on equal footing the large open neutron shell from N=126 down to and beyond the mid-shell N=104 region, jointly with the valence protons in the Pt, Hg, Po, and Rn nuclei, even including proton multi-particle multi-hole (mp-nh) excitations across the Z=82 shell closure, is beyond present computational possibilities. The truncation of the model space, however, by concentrating on nucleon pair modes (mainly and coupled pairs, to be treated as bosons within the interacting boson approximation (IBM) iach87 ), has made calculations feasible, even including pair excitations across the Z=82 shell closure duval81 ; duval82 in the Pb region in a transparent way. More in particular, the Pb nuclei have been extensively studied giving rise to bands with varying collectivity depending on the nature of the excitations treated in the model space hey87 ; hey91 ; fossion03 ; helle05 ; paka07 ; helle08 . More recently, detailed studies of the Pt nuclei have been carried out king98 ; harder97 ; García-Ramos and Heyde (2009); Garc11 ; Garc14a ; cutcham05a ; cutcham05 as well as for the Hg nuclei bar83 ; bar84 ; Garc14 in an attempt to describe the large amount of low-lying states and their E2 decay properties, explicitly including particle-hole excitations across the Z=82 shell closure. A novel mapping procedure to determine an algebraic IBM Hamiltonan has been proposed by Nomura et al. nomura08 ; nomura10 . In contrast to the standard shell-model to boson model mapping method arima77 ; otsuka78 , it has been shown that an IBM Hamiltonian can be determined, mapping a self-consistent mean-field total energy surface E() (over the full plane) onto the corresponding IBM mean-field energy. Very recently, this method was extended to include intruder mp-nh configurations, with a detailed coverage of the Pt, Pb and Hg isotopes nomura11a ; nomura11b ; nomura12a ; nomura13 .
Recently, a lot of new experimental results have become available in the Pb region, encompassing, besides the Pb isotopes, the nearby Hg, Pt and Po isotopes (see Section II for references on the Po nuclei). In both the Pb and Hg isotopes, there is overwhelming information (excitation energies, B(E2) values, isotopic shifts, -hindrance factors, etc.) by now that highlights the presence of shape coexistence, which is associated with the presence of prolate, oblate and spherical bands in the case of the Pb nuclei, and with the presence of a prolate deformed band together with a less deformed oblate structure, forming the yrast band in the case of Hg jul01 . Whereas the intruder bands are easily singled out for the Pb and Hg nuclei in which the excitation energies display the characteristic parabolic pattern with minimal excitation energy around the N=104 neutron mid-shell nucleus, this structure is not immediate in both the Pt and the Po nuclei. Therefore, in the present paper, we carry out an extensive study of the Po nuclei within the context of the interacting boson model, including 2p-2h excitations across the Z=82 proton closed shell, thereby extending the regular IBM model space, containing N bosons, with the intruder N+2 IBM model space, also taking into account the interaction between both subspaces, which is called the IBM-CM approach.
The paper is organized as follows: in Section II, we describe the experimental situation in the Po isotopes whereas in Section III, we present the various theoretical approaches that have been used in the literature to study the Po nuclei; in Section IV, we succinctly present the IBM-CM formalism as well as the fitting methodology used; here, we also discuss the main outcome of the calculations on energy spectra, electric quadrupole properties (B(E2) values, quadrupole moments), and its comparison with the available experimental data; in Section V, we discuss the results on -hindrance factors as well as on the isotopic shifts; Section VI is devoted to the description of nuclear deformation properties of Po nuclei as derived from the IBM-CM mean-field energy, from the study of the quadrupole shape invariants and from the study of the kinematic moments of inertia, characterizing the yrast band structure of Po nuclei. Moreover, we compare the present results with the nearby Pb, Hg and Pt isotopes. Finally, in Section VII, both the main conclusions as well as an outlook for further studies are presented.
II Experimental data: situation in the Po nuclei
The even-even Po nuclei span a large region of isotopes, starting with the lightest presently know 190Po nucleus (N=106), passing through the end of the shell, 210Po, all the way up to N=134 at 218Po.
Many experimental complementary methods have been used to disentangle the properties over such a large interval. These nuclei are extensively covered in the Nuclear Data Sheet reviews for A=190 Sing03 , A=192 Bagl12 , A=194 Sing06 , A=196 Xia07 , A=198 Xia02 , A=200 Kondev07 , A=202 Zhu08 , A=204 Chia10 , A=206 Kondev08 , A=208 Martin07 , and A=210 Basa14 , and span the region we concentrate on in the present paper.
The experimental information (up to the end of the 90’s), down to A=192 (N=108), was obtained mainly using early fusion-evaporation reactions, followed by in-beam -ray spectroscopy, with, in particular, information on energy spectra systematics for A=192,194 fot97 ; hela96 ; hela99 , A=194 youn95 , A=196,198 alber91 , A=196,198 bern95 , A=198 lach94 , and A=198,200 maj90 . This particular part of the mass region has also been analyzed using and decay studies of mass-separated Rn an At nuclei, resulting in information about excited 0+ states in the isotopes with A=196-202 bijn95 and in energy spectra of the isotopes A=200,202 bijn98 , as well as making use of -decay studies from the Rn nuclei for A=198 waut92 . Alpha decay studies, moving from the Po nuclei into the Pb nuclei, have been a major fingerprint, in particular, in view of the shape coexisting structure in the daughter Pb nuclei. There exists an extensive set of results that has been accumulated during a period of about two decades waut93 ; waut94 ; wauters94a ; bijn96 ; andrey99 ; allatt98 ; andrey99a ; andrey02 ; andrey06 ; vande03 ; vande05 ; duppen00 ; huyse01 ; delion14 ; delion13 .
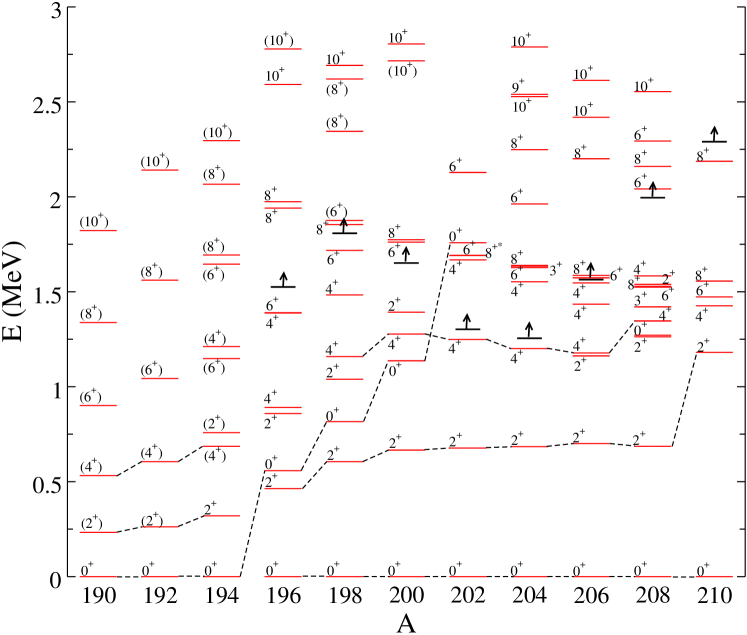
It was observed that mass A=194 (see Fig. 1) indicated a break in the energy scale observed for the heavier masses, where the energy of the 2 level is typically of the order of keV, going down to an energy of about keV, therefore, dropping by a factor two. More recenty, experimental studies spanning the 1999-2009 period have been performed at the JYFL at the University of Jyvs̈kylä using the recoil-decay-tagging (RDT) technique, studying prompt and delayed -rays down to mass A=190 vande03a ; wise07 . Moreover, lifetimes could be derived making use of the RDT technique in recoil distance Doppler-shift experiments for masses A=194 grahn06 ; grahn08 ) and A=196 grahn09 . The experimental situation for the Po isotones down to A=190 has been summarized by Julin et al. jul01 . Very recently, Coulomb excitation experiments have been performed using post-accelerated 196,198,200,202Po beams at REX-ISOLDE, resulting in an important set of specific reduced E2 matrix elements, connecting the 0 ground state with the excited 2 states (as well as for other combinations) keste15 . Charge radii have been measured for both the odd-A A=191-211 Po nuclei seliv13 ; seliv14 as well as for the even-even A=192-210, 216, and 218 Po nuclei cocio11 , extending the ground-state information in a major way.
III Theoretical approaches: the evolving situation in the Po nuclei
The experimental situation, as discussed before, hints for a particular change in the structure moving down in mass number A. The energy scale, which starts at the N=126 closed neutron shell, set by the seniority scheme shalit63 ; talmi93 ; ressler04 , with a first excited state at keV, quickly sets in a rather constant value of the energy at keV. However, over the span of a few mass units one notices (i) a quick drop of the first excited from mass A=202 ( keV), down to mass A=196 ( keV), and (ii) starting at mass A=196, the energy (at keV) drops considerably setting into a new energy scale for the lower masses (known only down to A=190 at present), of keV.
In the early works of bern95 ; youn95 a description using a particle-core coupling model approach was proposed, resulting from coupling the 2 proton particles with a vibrational core system. With the experimental information on masses A=196, and later A=194, a systematic study was carried out in youn97 ; cizew97 for the mass region A=210 down to A=194. Here, it was pointed out that the quick drop of, in particular, the first excited state, arose because of the need of using an enhanced particle-core coupling strength. This point was later stressed by Oros et al. oros99 who showed that a consistent set of coupling strengths was unable to describe the observed properties, in particular, below mass A=200.
Calculations using a deformed average field may77 indicated that in studying the energy surfaces, while at mass A=196, a soft spherical result was obtained, at mass A=192, an oblate minimum appeared, becoming the lowest minimum at a value of =-0.2 and an almost degenerate situation at A=190 with both oblate and prolate minima with both values of . Energy surface calculations, covering the plane were carried out using a deformed Woods-Saxon potential, resulting in the presence of three minima in the mass region A=190 to A=186 oros99 . The above results were confirmed later by Smirnova et al. smirnova03 , this time using a self-consistent HFB approach using the SLy4 Skyrme force bender03 , indicating rather wide minima in A=196-194, a lowest oblate minimum at A=192 and A=190, turning into prolate at A=188. Triggered by the new data on masses A=196 and A=194, more detailed beyond mean-field studies were carried out grahn06 ; grahn08 ; grahn09 highlighting a detailed comparison on energy spectra and E2 properties, indicating the interplay of an oblate and a more spherical structure (vibrational). In their analysis, the authors point towards a rather pure intruder character of the whole yrast band, including the ground state. In our analysis (see Section IV.5), we come to the conclusion that the ground state exhibits a rather mixed character instead of being of pure intruder nature. More recently, a full study of even-even nuclei in the Pb region yao13 , showing specific results for the Po nuclei is presented. It is interesting to point out that high-spin isomers have been studied in the Po too, making use of a deformed Woods-Saxon potential, showing the effects of deformation on the specific excitation energy shi10 ; shi12 .
Most of the mean-field studies point towards the existence of rather complex energy surfaces with the presence of several minima, although in many cases separated by small barriers. Anyhow, a common denominator is the presence of a regular configuration, slightly deformed (oblate or gamma unstable) or spherical, coexisting with an intruder configuration of prolate nature, corresponding with a larger deformation as compared with the regular configuration. The lack of full calculations in the plane makes difficult to formulate more precise conclusion about the particular shape of the coexisting minima.
Within the framework of the shell-model and allowing for both the full neutron open shell, covering N=126 to N=82, as well as allowing proton mp-mh excitations across the Z=82 closed shell, the calculations are unfeasible nowadays. Therefore a truncated approach can be used starting from the standard IBM allowing for the presence of extra pairs. This method, called IBM-CM was proposed by Duval and Barrett duval81 ; duval82 and has been used in the study of shape coexistence in various mass region. Some early studies were carried out within the idea of a possible symmetry to be used within an extended version of the IBM, including particle-hole pairs (namely intruder I-spin hey92 ; hey94 ), with specific applications to the Po nuclei (references coster99 ; oros99 ) in which the coupling between U(5) and SU(3) symmetries were explored and compared to the then existing data (mass A=200 down to A=192)). Besides, a different symmetry, i.e., F-spin symmetry iach87 , was proposed to relate energy spectra in nuclei with different number of protons, Nπ, and neutrons pairs, Nν, outside of the nearest closed shells, however keeping the sum F=(Nπ + Nν)/2 constant. An application to the Pb region was carried out by Barrett et al. barrett91 . The data obtained recently else11 ; page11 ; scheck11 ; bree14 ; liam14 ; kasia15 ; rapi15 from detailed studies of the Hg nuclei on energy spectra and electric quadrupole properties (B(E2) values, Q-moments), however, do indicate that the more simple idea of I-spin is not holding so well.
IV The Interacting Boson Model with configuration mixing formalism
IV.1 The formalism
The IBM-CM is an extension of the original IBM allowing to treat simultaneously several boson configurations which correspond to different particle–hole (p–h) shell-model excitations duval82 . In our case, the model space includes the regular proton 2p configurations and a number of valence neutrons outside of the Z=82, N=126 closed shells (corresponding to the standard IBM treatment for the Po even-even nuclei) as well as the proton 2h-4p configurations and the same number of valence neutrons corresponding to a boson space ( being the number of active protons, counting both proton holes and particles, plus the number of valence neutrons outside the Z=82,N=126 closed shells, divided by as the boson number). Consequently, the Hamiltonian for two configuration mixing can be written as
| (1) |
where and are projection operators onto the and the boson spaces, respectively, describes the mixing between the and the boson subspaces, and
| (2) |
is a restricted IBM Hamiltonian called extended consistent-Q Hamiltonian (ECQF) warner83 ; lipas85 with , the boson number operator,
| (3) |
the angular momentum operator, and
| (4) |
the quadrupole operator. This approach has been proven to be a good approximation in several recent papers on Pt García-Ramos and Heyde (2009); Garc11 and Hg isotopes Garc14 .
The parameter can be associated with the energy needed to excite two proton particles across the Z=82 shell gap, giving rise to 2p-2h excitations, corrected for the pairing interaction gain and including monopole effects hey85 ; hey87 . The operator describes the mixing between the and the configurations and is defined as
| (5) |
The E2 transition operator for two-configuration mixing is subsequently defined as
| (6) |
where the () are the effective boson charges and the quadrupole operator defined in equation (4).
In section IV.2 we present the methods used in order to determine the parameters appearing in the IBM-CM Hamiltonian as well as in the operator.
The wave function, within the IBM-CM, can be described as
| (7) | |||||
where , , and are rank numbers. The weight of the wave function contained within the -boson subspace, can then be defined as the sum of the squared amplitudes . Likewise, one obtains the content in the -boson subspace.
IV.2 The fitting procedure: energy spectra and absolute B(E2) reduced transition probabilities
Here, we present the way in which the parameters of the Hamiltonian (1), (2), (4), and (5) and the effective charges in the transition operator (6) have been determined. We study the range 190Po to 208Po, thereby, covering almost the whole second half of the neutron shell N=82-126.
| Error (keV) | States |
|---|---|
In the fitting procedure carried out here, we try to obtain the best possible agreement with the experimental data including both the excitation energies and the B(E2) reduced transition probabilities. Using the expression of the IBM-CM Hamiltonian, as given in equation (1), and of the E2 operator, as given in equation (6), in the most general case parameters show up. We impose as a constraint to obtain parameters that change smoothly in passing from isotope to isotope. Note also that we constrained and . We have explored in detail the validity of this assumption and we have found very little improvement in the value of (see Eq. (8)) when releasing those parameters. On the other hand, we have kept the value that describes the energy needed to create an extra particle-hole pair ( extra bosons) constant, i.e., keV, and have also put the constraint of keeping the mixing strengths constant too, i.e., keV for all the Po isotopes. We also have to determine for each isotope the effective charges of the operator. This finally leads to parameters to be varied in each nucleus.
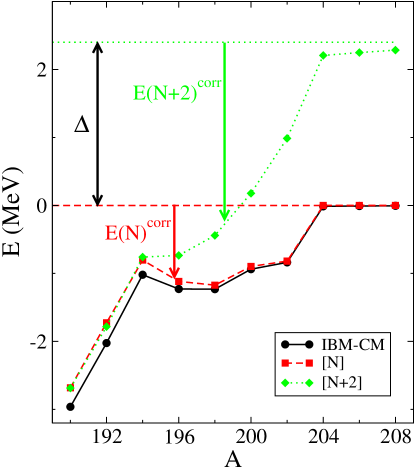
To determine the value of we considered as a reference the already known values for Pt and Hg, which are keV and keV, respectively. On one hand, we expect to get a value closer to Pt than to Hg because the intruder states for Po are supposed to be very close to the regular ones and even become the ground state around the mid-shell. That constrains our value to be not much higher than keV. On the other hand, we know that the heavier isotopes, near the closed shell, should have an energy gap between the regular and the intruder states which is equal, at maximum, to (see Fig. 2 on correlation energy) and, moreover, experimentally the intruder states should appear above keV.
To determine the value of the mixing strengths, we considered that the corresponding value for the Pt nuclei was fixed to keV García-Ramos and Heyde (2009), while for the Pb, to a smaller strength of keV fossion03 ; helle05 , and for Hg to keV. We performed a set of exploratory calculations between keV and found that the best overall agreement corresponds to keV, although the agreement is quite similar over the whole range.
| Nucleus | ||||||||
|---|---|---|---|---|---|---|---|---|
| 190Po | 712.6 | -29.41 | 6.34 | 285.43 | -28.56 | 0.22 | 2.88111The effective charges have been taken the same as the corresponding values obtained for 194Po. | 1.86111The effective charges have been taken the same as the corresponding values obtained for 194Po. |
| 192Po | 731.8 | -24.20 | 0.43 | 402.67 | -30.09 | 0.21 | 2.88111The effective charges have been taken the same as the corresponding values obtained for 194Po. | 1.86111The effective charges have been taken the same as the corresponding values obtained for 194Po. |
| 194Po | 800.3 | -15.12 | -16.00 | 518.23 | -28.92 | 0.41 | 2.88 | 1.86 |
| 196Po | 845.0 | -22.76 | -10.96 | 373.16 | -31.02 | 0.15 | 1.86 | 1.86 |
| 198Po | 982.3 | -28.00 | -25.74 | 854.82 | -34.51 | 1.33 | 2.05 | 1.10 |
| 200Po | 955.8 | -26.05 | -25.00 | 843.48 | -34.55 | 1.31 | 2.01 | 1.10222 corresponding to 198Po. |
| 202Po | 942.1 | -29.06 | -28.46 | 236.30 | -20.63 | 1.09 | 2.28 | 1.10222 corresponding to 198Po. |
| 204Po | 810.4 | -0.00 | -21.09 | 100.00 | -5.00 | 0.50 | 2.28333 corresponding to 202Po. | 1.10222 corresponding to 198Po. |
| 206Po | 717.1 | -0.00 | -4.30 | 100.00 | -5.00 | 0.50 | 2.28333 corresponding to 202Po. | 1.10222 corresponding to 198Po. |
| 208Po | 643.4 | -0.00 | 6.52 | 100.00 | -5.00 | 0.50 | 2.28333 corresponding to 202Po. | 1.10222 corresponding to 198Po. |
The test is used in the fitting procedure in order to extract the optimal solution. The function is defined in the standard way as
| (8) |
where is the number of experimental data, is the number of parameters used in the IBM fit, describes the experimental excitation energy of a given excited state (or an experimental B(E2) value), denotes the corresponding calculated IBM-CM value, and is an error (theoretical) assigned to each point. We minimize the function for each isotope separately using the package MINUIT minuit which allows to minimize any multi-variable function.
In some of the lighter Po isotopes, due to the small number of experimental data, the values of some of the free parameters could not be fixed unambiguously using the above fitting procedure. Moreover, for the heavier isotopes (A202), that part of the Hamiltonian corresponding to the intruder states is fixed such as to guarantee that those states appear well above the regular ones, that is, above MeV. In some cases due to the lack of experimental data the effective charges could not be determined.
As input values, we have used the excitation energies of the levels presented in Table 1. In this table we also give the corresponding values. We stress that the values do not correspond to experimental error bars, but they are related with the expected accuracy of the IBM-CM calculation to reproduce a particular experimental data point. Thus, they act as a guide so that a given calculated level converges towards the corresponding experimental level. The ( keV) value for the state guarantees the exact reproduction of this experimental most important excitation energy, i.e., the whole energy spectrum is normalized to this experimental energy. The states and are considered as the most important ones to be reproduced ( keV). The group of states , , , , and ( keV) and ( keV) should also be well reproduced by the calculation to guarantee a correct moment of inertia for the yrast band and the structure of the band. Note that we only considered states in the fit with angular momentum and parity unambiguously determined.
In the case of the transitions rates, we have used the available experimental data involving the states presented in Table 1, restricted to those transitions for which absolute B(E2) values are known, except if serious hints that the states involved present non-collective degrees of freedom exist. Additionally, we have taken a value of that corresponds to of the B(E2) values or to the experimental error bar if larger, except for the transition where a smaller value of ( W.u.) was taken, thereby normalizing, in most of cases, our calculated values to the experimental value.
This has resulted in the values of the parameters for the IBM-CM Hamiltonian, as given in Table 2. In the case of 190-192Po and 200-208Po, the value of the effective charges, or part of them, cannot be determined because not a single absolute B(E2) value is known or is insensitive to their values. However, for completeness we have taken the effective charges of 194Po for 190-192Po, of 198Po for 200-208Po, and of 202Po for 204-208Po.
IV.3 Correlation energy in the configuration mixing approach
Intruder states are expected to appear, in principle, at an excitation energy well above the corresponding regular ones with identical angular momentum. The reason is that these configurations are related to the creation of a 2p-2h excitation across the Z=82 closed shell. In the case of Po this energy would correspond to keV. However, according to reference hey87 , the single-particle energy cost has to be corrected because of the strong pairing energy gain when forming two extra coupled (particle and hole) pairs, by the quadrupole energy gain when opening up the proton shell, as well as by the monopole correction caused by a change in the single-particle energy gap at Z=82 as a function of the neutron number. In particular, around the midshell point at N=104, where the number of active nucleons becomes maximal, the energy gain due to the strong correlation energy is such that the energy of the intruder configurations becomes close to the energy of the regular ones. It may even be that a crossing results making the intruder state forming a ground state. For instance, in the case of Pt isotopes, the nuclei around the midshell point at N=104 exhibit a ground state of intruder nature García-Ramos and Heyde (2009); Garc11 .
The experimental states can present a strong mixing because of the interaction between both families of configurations (regular and intruder). Therefore, it is not simple in many cases to find out which configurations are dominant in the ground-state wavefunction. In order to take advantage of the IBM-CM calculations, we calculate explicitly the “absolute” energy of the lowest state belonging to both the regular [N] and [N+2] intruder configuration spaces, turning off the interaction among the two families. We choose as the reference energy, the energy of the regular Hamiltonian describing the [N] space for the 210Po nucleus. This nucleus only consists of a single boson, with the s-boson as the lowest energy state, resulting in the zero-energy line (horizontal dashed red line in Fig. 2). The energy of the lowest 0+ state in the regular configuration space [N], E(0,N), is lowered with respect to the reference energy because of the correlation energy and is described by the wave function (see also expression (9)). The lowering depends on the number of bosons. On the other hand, the energy of the lowest 0+ state in the intruder configuration space [N+2], E(0,N+2), is described by the wave function (see also expression (10)) and appears at the energy corresponding to . This energy will subsequently be lowered by its specific correlation energy too. In most cases, the regular configuration with N bosons corresponds to a spherical or slightly deformed shape, while the intruder ones, with N+2 bosons, to a more deformed shape. Therefore, the energy gain for the lowest intruder state, described by the wave function , uses to be larger than for the lowest regular state, described by the wave function . The relative position of these lowest regular and intruder states is plotted in Fig. 2. Here, it can be clearly appreciated how the energies of both configurations can become very close, depending on the balance between the off-set, , and the difference in the correlation energy .
One notices how the energies become really close near midshell (N=106, A=190), where the number of active nucleons is maximal, showing that the lowest intruder state can determine the character of the lowest 0 state. From A=196, and moving towards the heavier masses, the energy difference starts to increase and both states appear to be very well separated. Note that once the isotopes approach the end of the shell, at N=126, the number of active bosons is drastically reduced and, therefore, the correlation energy is reduced dramatically. In particular, the energy of the regular state reaches the reference energy, which means that it corresponds to essentially a spherical shape, while the energy of the intruder state approaches the energy quite closely. Consequently, at the end (or at the beginning) of the shell, the maximum energy difference between both states will correspond to . The existence of a ceiling for the energy difference modulates the parabolic behavior of the energy systematics of the intruder states, transforming it into a flat shape and, therefore, leading to an energy for the intruder states lower than experimentally observed. Clearly, this is a deficiency of the IBM-CM calculations near the shell closure.
| Isotope | Transition | Experiment | IBM-CM |
|---|---|---|---|
| 194Po | 90(20) | 90 | |
| 120(40) | 156 | ||
| 196Po | 47(6) | 47 | |
| 103(15) | 92 | ||
| 130(60) | 125 | ||
| 5.7(10)111Data taken from Ref. keste15 . | 2.1 | ||
| 130(25)111Data taken from Ref. keste15 . | 36 | ||
| 198Po | 39(9) | 39 | |
| 177(53) | 61 | ||
| 2.0(1)222Experimental data not included in the fit., 333Data taken from Ref. maj90 . | 72 | ||
| 285111Data taken from Ref. keste15 . | 7 | ||
| 1.8111Data taken from Ref. keste15 . | 1.7 | ||
| 229(147)111Data taken from Ref. keste15 . | 13 | ||
| 42(56)111Data taken from Ref. keste15 . | 33 | ||
| 200Po | 31(2) | 31 | |
| 9.4(5)222Experimental data not included in the fit. | 52 | ||
| 202Po | 32(8) | 32 |
IV.4 Detailed comparison between the experimental data and the IBM-CM results: energy spectra and electric quadrupole properties
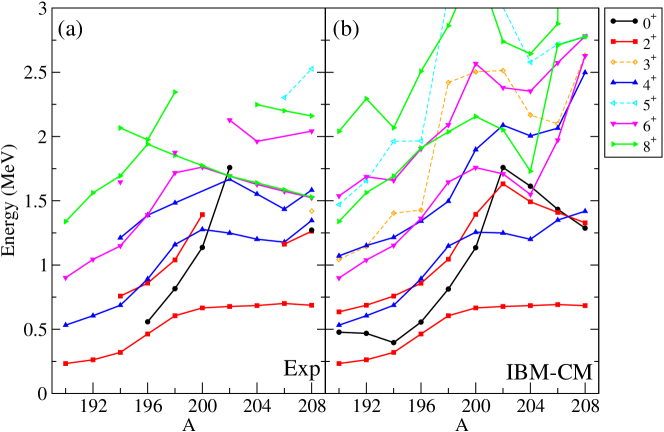
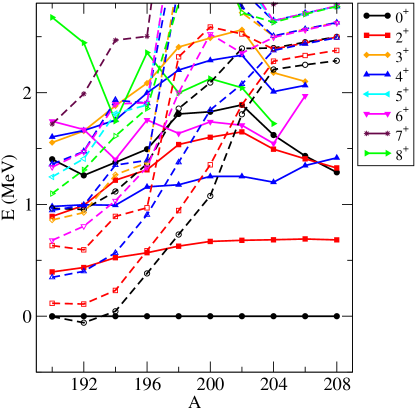
In this subsection, we compare in detail the experimental energy spectra with the theoretical ones up to an excitation energy below MeV. In Fig. 3a we plot the experimental data set, while in Fig. 3b the theoretical values are depicted. Note that the energy corresponding to the state perfectly agrees with the theoretical one because this level was used to normalize the energies, in other words, we used in the fitting procedure for this level a very small value for ( keV) in order to exactly reproduce the experimental energy. Comparing the energy spectra, one can distinguish two regions, and , with an overall better agreement in the first region as compared to the second. A most probable reason for this is the fact that in the lightest isotopes the number of active bosons is substantially larger and the collectivity is enhanced. As we discuss later, in the heavier Po isotopes, non-collective broken-pair states (with a v=2 seniority character) do appear in the low-energy part of the energy spectrum. Those states are not well reproduced within the IBM space because of the restriction to a set of interacting s and d bosons.
One observes in Fig. 3 how the compression of the energy spectrum, with decreasing mass number, is well reproduced. The same happens for the systematic dropping of the energy of the states, and the energy of the yrast band, more generally. Note that the agreement is better for those states with low and even angular momenta.
Next, we carry out a comparison for the B(E2) values, which is a much more stringent test than the excitation energy, because these numbers are highly dependent on the detailed structure of the wave function. Although the existing experimental information on B(E2) values is rather scarce, recent new results from Coulomb excitation experiments at REX-ISOLDE, in particular for the 196-198Po isotopes, have appeared keste15 , improving the experimental knowledge of this mass region.
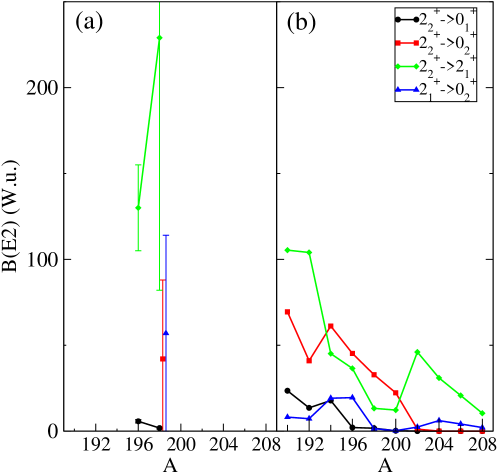
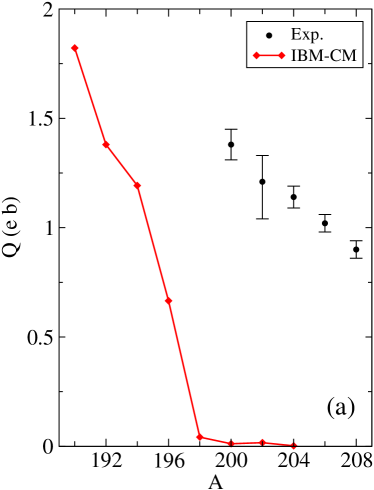
In Figs. 4 and 5 we compare the B(E2) reduced transition probabilities, while in Fig. 6 we compare the electric quadrupole moments. We also present a more detailed comparison on B(E2) values in Table 3.
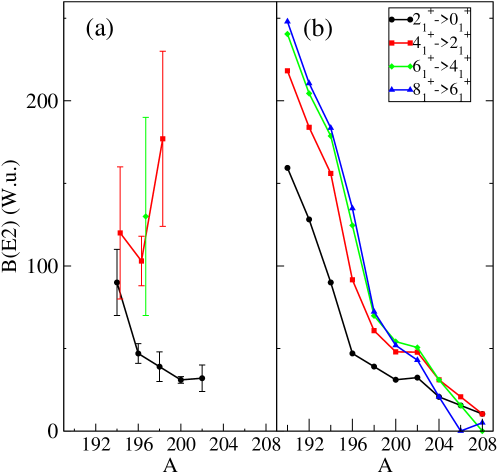
In Fig. 4 we present the intraband B(E2) values along the yrast band, for which the most complete experimental information exists. In a similar way as for the excitation energies, we used the reduced transition probability to normalize the theoretical results. Note that for some nuclei, where experimental information is scarce, we have used the corresponding values of the neighboring isotopes to determine the effective charges (as explained in Sec. IV.2). On the experimental side, the value of is systematically dropping, which denotes a reduction of the collectivity of the states when approaching the end of the neutron shell. However, this is not the case for in 198Po, where an unexpected large value is observed. On the other hand, the theoretical results show a continous drop of all the intraband transitions, resulting from the reduction of the collectivity of the states (in line with a decreasing number of active bosons).
In Fig. 5 we study the systematics of some interband transitions involving the states and . Because of the lack of experimental data and the large error bars, it is difficult to extract any trend. Regarding the theoretical results, once more, one notices an overall reduction of the B(E2) values. We point out that for , the observed B(E2) values are of the same order as the observed B(E2) values in the yrast band. This represents a hint about the changing mixing character of the states as a function of mass number A (see Fig. 12 as illustration of the changing structure of the wave function).
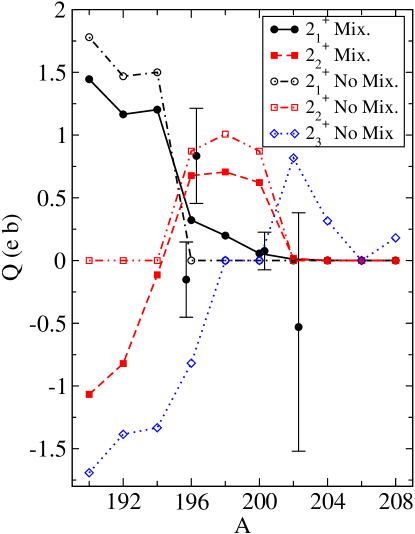
A different way to extract information on the changing character of the wave functions for the lowest two states is comparing the spectroscopic quadrupole moments, shown in Fig. 6. Here, we compare the theoretical and the experimental values of the quadrupole moment for the states and . Moreover, we present the values corresponding to the unperturbed lowest-lying three states. One notices that the state corresponds to a well deformed and oblate shape for the lightest isotopes, which is smoothly changing into a rather spherical shape for A=202 and onwards. On the other hand, the state corresponds to a prolate shape for the lightest isotopes, changing into an oblate shape for A=196-200, and into a spherical shape for A=202 and the still heavier isotopes. When comparing with the unperturbed values, one can see how the state is built up as a mixture of the first two unperturbed states. However, in order to understand the second state, we have to resort to a mixture of the second and third unperturbed states mainly. This figure presents a clear proof of the changing character for the first two states as a function of mass number. This issue will be discussed in section IV.5 in a more quantitative way.
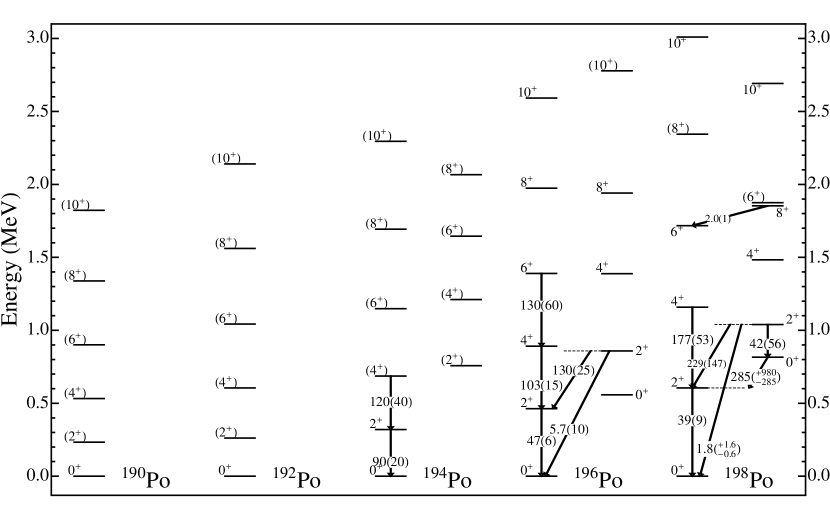
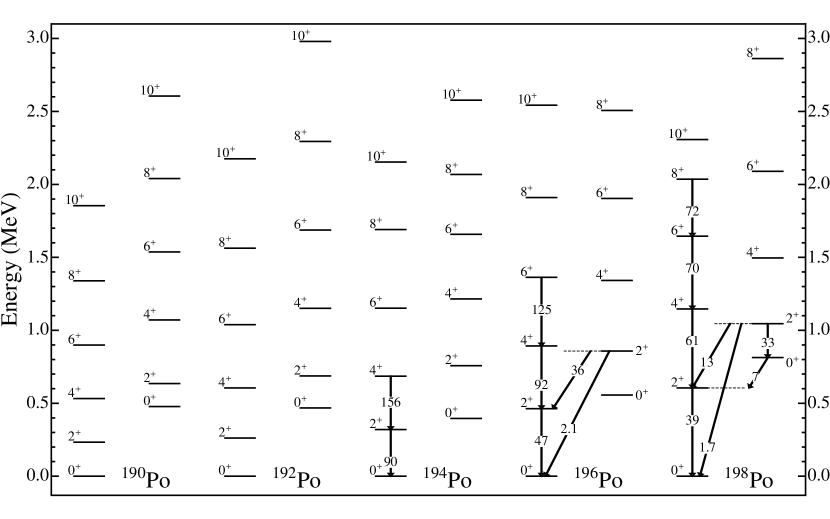
In Figs. 7 and 8 we present the experimental and theoretical energy spectra (up to MeV) for masses A=190-198, which is the region where the coexistence should be more evident. We include in the comparison the known absolute B(E2) values. One observes a rather distinct rotational structure (along the yrast band) for A=190-194, followed by a structure that is changing into a more vibrational behavior for masses A=196-198.
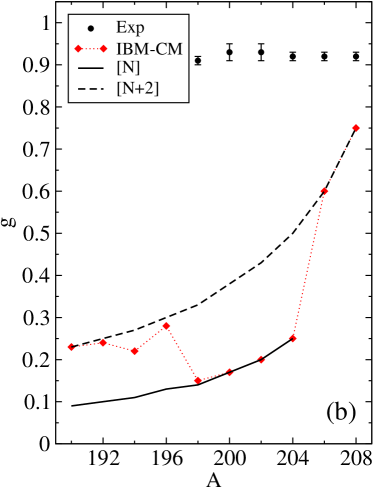
The Po energy spectra show some other most interesting structural changes starting at the neutron N=126 shell closure, moving towards the neutron-deficient region (decreasing towards mid-shell at A=188) (see Figs. 1 and 3). One starts with the typical two-particle spectrum governed by the seniority characteristics of the two-body proton-proton interaction. An energy gap of 0.8 MeV is observed from the 8 to the 8 state energy difference (see Fig. 1), which most probably results from a configuration, as a measure of the single-particle energy gap. Next, one observes the remaining characteristics of a senority v=2 spectrum, albeit with an immediate drop of the 2 state, when removing two neutrons from the closed N=126 shell, which then keeps a remarkably constant energy down to mass A=200 (N=116). The energy of the 4 slighty drops but also remains at an approximate constant energy. The higher spin members 6, 8 are shifted upwards in a rather regular way down to mass A=198 (N=114), before first the 6 starts dropping systematically down in excitation energy at A=196 (N=112), followed by the 8 dropping too from A=194 (N=110) (see Figs. 1 and 3) . Therefore, it looks like the region 208 A 198 is reminiscent of a vibrational pattern where the specific two-nucleon properties of the high-spin proton pair remain rather well intact down to the lower value at A=198. An interesting test to gain deeper insight in this region, and the connection to the yet lower mass region 196 A 190 where a dominant rotational-like and more collective pattern is showing up, can be derived from a study of, e.g., the B(E2;8 6) value, as well as, of the g-factor and the quadrupole moment of the high-spin 8 state (see Table 3 and Fig. 9). Experiments Stone05 ; Stone14 have shown that the g-factor stays remarkably constant going down to A=198, at a value consistent with the 8+ configuration (for a pure v=2 configuration, as a function of n, the number of holes in the orbital, the g-factor remains constant), indicating a minor influence of collective admixtures into this state. Maj et al. maj90 have analyzed the B(E2;8 6) value as well as the 8 quadrupole moment in order to extract an effective charge (see e.g., Fig. 9 in maj90 ). The influence of particle-core coupling on the quadrupole moment of the 8 state has been studied for the Po nuclei with A=202 and 204 indicating an increase in the quadrupole moment as low as A =200 ney97 . The effective charge shows a steady increase of 2 from A=210 down to mass A=200, from which a sharp drop is observed moving towards A=198. This seems to support the idea that, in particular for the high-spin members with a seniority v=2 character, those states only couple weakly with collective quadrupole excitations. Moreover, these results also corroborate the fact that from A=196 and onwards with decreasing A value, large collective components should appear in the 6 state, even though the g-factor of the 8 remains constant between A=200 and A=198 Stone05 ; Stone14 . In view of the discrepancies between the IBM-CM calculations and the experimental data concerning the g-factor and the B(E2;8 6) value, those states should have a very weak coupling with the quadrupole collective excitations, and genuinly correspond to almost pure v=2 seniority configurations (see Fig. 9).
Finally, it is worth to note a recent beyond-mean-field calculation performed for the lead region by Yao et al. yao13 and, in particular, with results for the even-even Po isotopes (A=186-204). They have calculated energy spectra (general systematics), as well as charge radii, , quadrupole moments for the lowest and states, and (with ). Comparisons with existing data have also been carried out for 190Po and 194Po in Ref. grahn08 and for 196Po in Ref. grahn09 ). Because their formulation is within a mean-field context, invoking the concept of nuclear shapes (spherical, oblate, prolate), it is not always possible to compare with the present IBM-CM approach in which the model space is restricted to 0p-0h and 2p-2h excitations across the Z=82 closed shell. A few general remarks are in place. Regarding the energy spectra the main conclusion of the calculations are the overestimation of the energy (which is predicted to be oblate), though the slope of the variation with respect to A is well reproduced and, moreover, that the calculation is not able to reproduce the almost constant value of the excitation energy, giving rise to a steady increase of the energy as a function of A. Another very interesting outcome of the calculation is the spectroscopic quadrupole moment (note that in yao13 an equivalent magnitude is provided, ) for the and states. The calculation predicts a prolate shape for the state while oblate for the state up to N=106 (A=190), interchanging at this point their character, becoming almost spherical (but slightly oblate) for N=114 (A=198) and onwards. In the case of A=190, the calculation exhibits the presence of a prolate and an oblate band structure, very much like the IBM-CM model results. The results for the charge radii give an overall correct trend. However, the upsloping trend in (relative to the value for 210Po), starting at N=112 (A=196) is not well described within the BMF description as compared with the IBM-CM.
IV.5 Wave function structure: from the unperturbed structure to configuration mixing
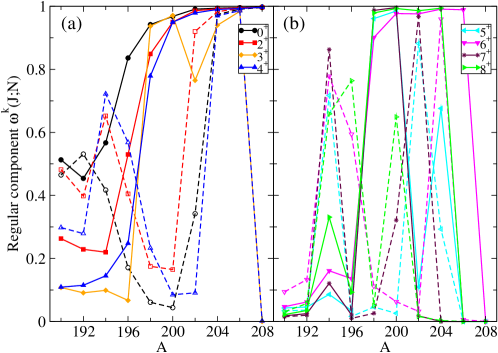
We start our analysis with the structure of the configuration-mixed wave functions along the yrast levels, expressed as a function of the and basis states, as given in eq. (7). In Fig. 10a and Fig. 10b, we present the weight of the wave functions contained within the -boson subspace, defined as the sum of the squared amplitudes , for both the yrast states, , and the states (the latter are indicated with a dashed line) for spins in panel (a) and in panel (b). The results exhibit an interesting behavior: the yrast states show rather an intruder character for mass A=190 that quickly are changing into a regular one in the mass interval A=194-200. For the states, they are fully mixed for A=190 and subsequently, the state is changing into a pure regular one, while the character of the state is essentially purely intruder for A=200, later on changing into a pure regular character for A=204. The behavior for the and states is very similar. The first ( or ) state starts as a dominant intruder state for the lighter isotopes, steadily changing with an increase of its regular component, becoming a fully regular configuration for A=200 and onwards to the heavier masses. The second and state start with a regular component of and , respectively, reaching a maximal value for A=194 (), then decreasing when moving to A=200, increasing up to reach a purely regular character by mass A=202. Indeed, the , , and states exhibit a similar trend. The other states exhibit a more erratic behavior, mainly because of the many crossings in the unperturbed energy spectra of the regular and intruder states, although appearing at very similar energies. Finally, note that the results for A=208 should all correspond to pure regular states because the intruder states appear at a much higher energy at N=126. Because of the constraint put on the value of (see the discussion in section IV.3), the intruder states appear too low in the energy spectra. Moreover, because of the reduced number of bosons in 208Po (Z=84, N=124), , only regular states up to spin J=4 can be constructed within the IBM. Consequently, it is not possible to describe the higher-spin (J=8 and beyond) states showing up in the mass region 204 A 208 in a reasonable way within the IBM, in view of the specific high-spin broken-pair states appearing at 1.5-2 MeV.
Regarding the energy systematics of the intruder states, one expects a parabolic shape centered around N=104, as is the case of Hg and Pb. However, this is not the case for Po, neither for Pt isotopes. The reason for not observing the parabolic shape is the rather strong interaction between regular and intruder configurations and the crossing of the intruder and regular states in the ground state. Therefore, it is very enlightening to calculate the energy spectra as a function of A switching off the mixing part of the Hamiltonian, i.e. keeping . These spectra are depicted in Fig. 11 where we show the lowest two regular and the lowest two intruder states for different angular momenta. One observes a rather flat behavior of the energy for the regular states, still indicating a down-sloping tendency when moving towards the lighter Po isotopes. The energy of the intruder states is smoothly decreasing down to neutron mid-shell (N=106). In this region, the parabola become very flat (A=190-194). This results mainly from the smooth change of the Hamiltonian parameters when passing from isotope to isotope. A striking fact is the almost degeneracy of the unperturbed regular and intruder states for A=190-194, with the intruder configuration becoming the lowest one in the energy spectrum for A=190-192. The crossing of a regular and a intruder configuration with the same angular momentum has a strong influence on the regular component of the states resulting from the full IBM-CM calculation (see Fig. 10) inducing an interchange of character between the two states. In the situation of the unperturbed energy spectrum, the closest approach happens at A=196 and in Fig. 10 one notices that the states interchange their character at this point. The same happens for the states at A=196-198.
A most interesting decomposition of the wavefunction is obtained by first calculating the wavefunctions within the N subspace as
| (9) |
and likewise for the intruder (or N+2 subspace) as
| (10) |
defining an “intermediate” basis helle05 ; helle08 . This generates a set of bands within the 0p-0h and 2p-2h subspaces, corresponding to the unperturbed bands that are extracted in schematic two-level phenomenological model calculations (as discussed in references bree14 ; liam14 ; kasia15 ; duppen90 ; drac88 ; drac94 ; allatt98 ; page03 ; drac04 ), and indeed correspond to the unperturbed energy levels depicted in Fig. 11.
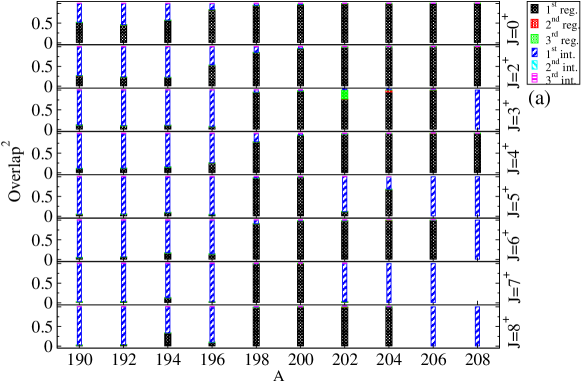
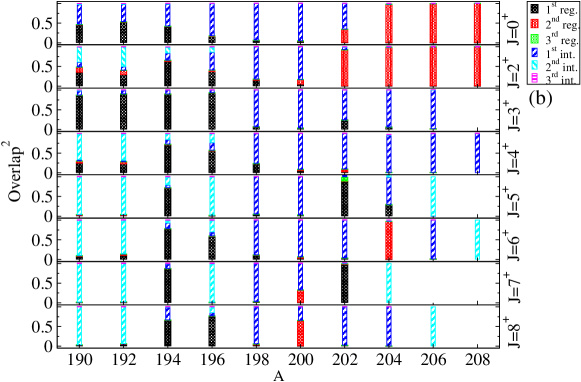
The overlaps and can then be expressed as,
| (11) |
and
| (12) |
(see expressions (9) and (10)). In Fig. 12 we show these overlaps, but squared, where we restrict ourselves to the first and second state () with angular momentum Jπ=0+,2+,3+,4+,5+,6+,7+,8+, and give the overlaps with the lowest three bands within the regular and intruder spaces ( and ). Since these figures are given as a function of mass number, one obtains a graphical insight into the changing wave function content. In panel (a), which corresponds to the first state, one observes for the state a strong mixing between the first regular and first intruder unmixed states (also called the “intermediate basis”) for A=190-194, while for the heaviest isotopes the state is mainly of regular character. For the states the situation is very much the same though the mixing is much more reduced. For the higher spin states one observes a sharp border at A=198, in such a way that for A the states correspond to the first intruder configuration, while for A they correspond to the first regular configuration. Note that the intruder character observed for the heavier isotopes is somehow artificial because of the reduced number of bosons and also to the reduced excitation energy of the intruder configurations. In panel (b) the situation becomes rather fuzzy especially for . For the state one observes a mixture between the first regular and intruder configurations up to A=196, then the composition changes into a pure first intruder configuration and finally ends up as the second regular configuration. Concerning the state, the lighter isotopes correspond to a mixture of the second intruder and the first and second regular configuration, the composition changing into the first intruder for A=198-200, finally ending as the second regular configuration. For the higher-spin states, the pattern is not so clear. In general, the states become rather pure and the changes in their composition is mainly due to the many crossings between the unperturbed regular and intruder configurations.
V Study of other observables: alpha-decay hindrance factors and isotopic shifts
V.1 -decay hindrance factors
The -decay process can be used as an important tool to probe nuclear structure, in particular the overlap factor between the initial and final wave functions has the character of an - particle spectroscopic factor. Because calculations of the absolute decay rate are very difficult, most often one studies decay branches, characterized by a hindrance factor described by the expression
| (13) |
where is the reduced width, the penetration probability through the combined Coulomb and centrifugal barrier duppen00 and the -decay intensity (with for the ground state and excited state, respectively) duppen00 .
The Pb-region has been studied intensively and hindrance factors have been used to obtain valuable information on shape coexistence, and mixing of various nuclear shapes. In particular, a two-level mixing model, suggested by Wauters et al. wauters94a , has been used to analyze the experimental hindrance factors and extract complementary information on mixing between different nuclear configurations.
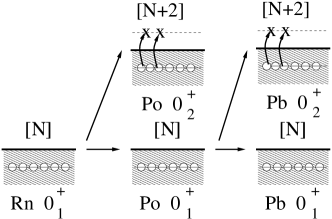
The structure information on the composition of the ground state in the 190-198Po nuclei is derived from the specific decay hindrance factors into both the and states into the corresponding daughter 186-194Pb nuclei (see Fig. 13). Use is made of the fact that for the Pb nuclei, it was shown, through study of the Pb nuclear charge radii heyde11 and very weak E0 decay strength from the transtion, that the Pb nuclei retain a spherical ground-state structure. The experimental results on these Po nuclei waut93 ; waut94 ; wauters94a ; bijn96 ; allatt98 ; andrey99a ; duppen00 ; huyse01 have been analyzed in these papers resulting in hindrance factors of , , , and for A=198, 196, 194, and 192, respectively. The major result is the decreasing trend in these hindrance factors, even favoring decay to the excited excited state at keV in 188Pb starting from 192Po. In those studies, and using a two-state mixing model wauters94a , an intruder character for the ground state state in 192Po turns out to be 63% allatt98 , or, even larger andrey99a . More recently, -decay from 188,192Po has been observed into the final excited states in 184,188Pb vande03 . Their analyses results in hindrance factors into the first excited state of and , respectively, which may well turn out as in indication of a very large overlap of the wavefunctions in initial and excited state in the final nucleus. In that latter paper, an analyses was carried out from inspecting the various energy minima in both the Po and Pb nuclei, obtaining qualitative information on overlaps of the corresponding wave functions, derived from the Nilsson-Strutinsky approach satula95 . An analysis of hindrance factors was also carried out using a similar method, making use of deformed mean-field wave functions at the energy minima of the total energy surfaces, pointing out that this approach, albeit different from an approach explicitely including mp-nh excitations across the closed Z=82 shell closure, renders quite similar resuls karl06 .
The wavefunctions, obtained from the IBM-CM (see also similar results on the study of the Pt Garc11 and Hg Garc14 nuclei on -decay hindrance factors), give rise to the following theoretical values of , corresponding with the weight factors of the intruder component (see Fig. 10) for the masses A=198, 196, 194, and 192, respectively. These numbers can be compared with the experimental relative hindrance factors as discussed before, with a rather good agreement.
On the other side, -decay starting from the even-even ARn nuclei (see Fig. 13), into the A-4Po nuclei, gives very strong fingerprints for observing excited states, in particular, experiments studying the decay of 202Rn into 198Po waut92 and of 198,200Rnbijn95 into the 194,196Po nuclei. The analysis of these data, using a two-state mixing model duppen90 , resulted in detailed information on the more deformed intruder configuration in the state. Its weight factor is changing from , passing by and , towards the value of , for A=200, 198, 196, 194, respectively. It is interesting to compare these results with the present IBM-CM calculations resulting in a variation of the intruder weight factor of , , , and (see Fig. 10) for the same mass values. This again indicates a rather good description of the changing wave function structure for the state in the Po even-even nuclei.
Studies on -decay from the odd-mass Po nuclei have been carried out for the same mass region, with now an extra neutron coupled to the underlying Po even-even core andrey99 ; andrey02 ; andrey06 ; vande05 . These experiments show the presence of rather weakly particle-core coupled states, associated with a spherical configuration for the even-even underlying core, as well the appearance of a more strongly coupled structure, associated with coupling of the odd particle with the more deformed configuration of the even-even core.
A lot of effort has been invested into going beyond the more simplified two-state mixing model that has been extensively studied analysing the -decay hindrance factors related to the decay into the excited states in the daughter nuclei. In particular, more detailed calculations have been carried out by Delion et al. delion95 ; delion96 , and more recently in delion14 , emphasizing the need for a microscopic QRPA description that encompasses both nedutron and proton pairing vibrations as well as including proton 2p-2h excitations across the closed shell. More in particular, calculations have mainly concentrated in order to better understand the observed hindrance factors for -decay leading into the neutron-deficient Po, Pb, Hg, and Pt nuclei. Karlgren et al. karl06 use the information on the energy minima in the plane of the total energy surface as the essential input to calculate the hindrance factors. They also discuss a possible connection between the present deformed mean-field approach with a picture in which specific particle-hole excitations are invoked within a shell-model approach. Moreover, Xu et al. xu07 formulates the -decay hindrance factors within a density-dependent cluster model to describe the tunneling of a preformed cluster through the deformed Coulomb barrier.
V.2 Isotopic shifts
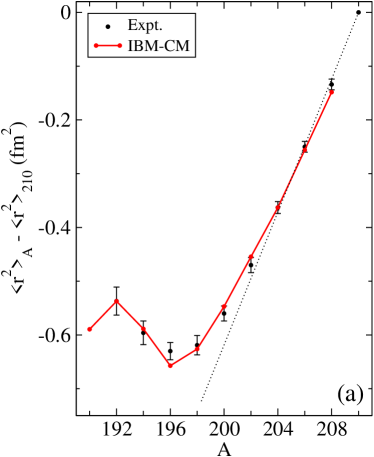
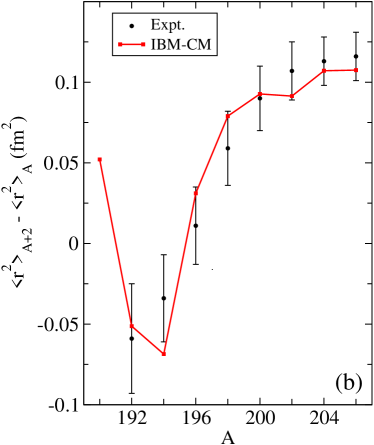
Experimental information about ground-state charge radii is also available for both the even-even cocio11 and odd-mass seliv13 ; seliv14 Po nuclei. Combined with similar data for the adjacent Po, Pb, and Pt nuclei, as well as for the odd-mass Bi, Tl and Au nuclei, the systematic variation of the charge radii supplies invaluable information on the ground-state wave function ulm86 ; otten89 ; kluge03 . We illustrate the overall behavior of relative to the radius at mass A=210 in Fig. 14a and the relative changes defined as - in Fig. 14b. The experimental data are taken from Cocolios et al. cocio11 .
To calculate the isotope shifts, we have used the standard IBM-CM expression for the nuclear radius
| (14) |
The four parameters appearing in this expression are fitted to the experimental data, corresponding to the radii of A=192-198 even-even Po isotopes cocio11 . The resulting values are fm2, fm2, fm2, and fm2. Note that in determining these parameters we took as reference point 204Po instead of 210Po which is the reference for the experimental data.
Panel (a) of Fig. 14 shows the value of the radius relative to A=210. The first important fact is the strong deviation from the linear trend (marked with the dotted line) at A=198 and downwards which is showing the onset of deformation confirmed in several recent experimental papers seliv13 ; cocio11 . To see this fact more clearly, we also present the value of the isotopic shift which enhances the appearance of the deformation. We mention the very good quantitative agreement between the IBM-CM and the experimental data, which confirms that the interplay between the and contributions in the ground state wave function along the whole chain of Po isotopes is well described by the model. Comparing with the data for the nearby Hg and Pt isotopes, one notices that the range of variation of the isotopic shift for Hg is only fm2, while for Pt this amounts to fm2 and, finally, for Po becomes fm2. This fact is telling us how abrupt the onset of deformation in the Po is. Note the strong similarity of Fig. 14b with Pt case Garc11 , where there is also an abrupt drop of the isotopic shift at A=184-186.
VI Quadrupole invariants and nuclear deformation
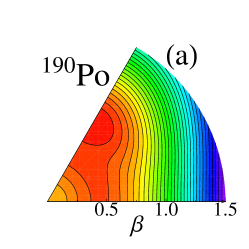
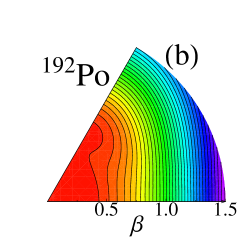
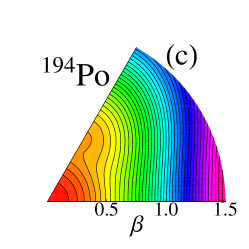
The IBM can provide us with both the energy spectra and the corresponding wave functions, as well as all derived observables (B(E2)’s, quadrupole moments, radii, …), working within the laboratory frame, as well as the corresponding mean-field energy surface, defining a nuclear shape over the intrinsic frame. This geometric interpretation of the IBM can be constructed using the intrinsic state formalism, as proposed in Refs. Bohr80 ; gino80 ; diep80a ; diep80b ; gil74 . The extension of this formalism to describe simultaneously regular and intruder configurations was proposed by Frank et al., introducing a matrix coherent-state method Frank02 ; Frank04 ; Frank06 ; Mora08 . In Refs. Garc14a ; Garc14b a detailed description of the method and its application to Pt and Hg isotopes, respectively, can be found. In Figs. 16a, 16b, and 16c the IBM-CM mean-field energy surfaces are depicted for 190Po, 192Po, and 194Po, respectively. In 190Po the energy surface presents an oblate minimum, that evolves into a very flat surface for 192Po and in a spherical shape for 194Po. Note that from Fig. 3 in Ref. yao13 , the 192Po and 194Po nuclei exhibit an oblate minimum, however, in reaching 190Po, the energy minimum switches over to become a prolate minimum, with a very similar deformation.
Even though the shape of the nucleus is not an experimental observable, it is still possible to extract from the data direct information about various moments characterizing the nuclear shape corresponding with a given eigenstate. Using Coulomb excitation, it is possible to extract the most important diagonal and non-diagonal quadrupole and octupole matrix elements, including their relative signs and, in a model independent way, extract information about nuclear deformation as shown by Kumar, Cline and co-workers kumar72 ; Cline86 ; Wu96 ; clement07 ; sreb11 .
The essential point is the introduction of an “equivalent ellipsoid” view of a given nucleus kumar72 corresponding to a uniformly charged ellipsoid with the same charge, , and E2 moments as the nucleus characterized by a specific eigenstate kumar72 ; wood12 .
From the theoretical point of view the nuclear shape can be calculated using the quadrupole shape invariants. The quadrupole deformation corresponds to
| (15) |
For the triaxial rigid rotor model wood09 it is directly connected with the deformation parameter
| (16) |
where denotes the nuclear intrinsic quadrupole moment.
| Isotope | State | (e2 b2) | Isotope | State | (e2 b2) |
|---|---|---|---|---|---|
| 6.2111The effective charges have been taken from neighboring isotopes (see Table 2). | 1.1111The effective charges have been taken from neighboring isotopes (see Table 2). | ||||
| 5.7111The effective charges have been taken from neighboring isotopes (see Table 2). | 0.9111The effective charges have been taken from neighboring isotopes (see Table 2). | ||||
| 4.8111The effective charges have been taken from neighboring isotopes (see Table 2). | 1.1 111The effective charges have been taken from neighboring isotopes (see Table 2). | ||||
| 4.5111The effective charges have been taken from neighboring isotopes (see Table 2). | 0.9111The effective charges have been taken from neighboring isotopes (see Table 2). | ||||
| 3.6 | 0.7111The effective charges have been taken from neighboring isotopes (see Table 2). | ||||
| 3.5 | 0.7111The effective charges have been taken from neighboring isotopes (see Table 2). | ||||
| 1.7 | 0.6 111The effective charges have been taken from neighboring isotopes (see Table 2). | ||||
| 2.8 | 0.4111The effective charges have been taken from neighboring isotopes (see Table 2). | ||||
| 1.4 | 0.4111The effective charges have been taken from neighboring isotopes (see Table 2). | ||||
| 1.2 | 0.1111The effective charges have been taken from neighboring isotopes (see Table 2). |
To calculate analytically the quadrupole shape invariants characterizing the nucleus in its ground-state and low-lying excited states, it is necessary to resort to a closure relation, , leading to the expression
| (17) |
In Table 4, we present the theoretical value of corresponding to the and states, for the whole chain of Po isotopes. In this case, only very few experimental values of the reduced E2 matrix elements have been measured keste15 besides the strongest and dominating matrix element. Because of the limited number of reduced E2 matrix elements, going into r=2,3,.. final states, it is not possible to extract reliable experimental values. For the same reason it is not possible to extract the triaxial shape variable , this is the reason for not including this variable in the discussion. The main conclusion of this table is that the deformation of both 0 states is very similar and is dropping when moving from mid-shell, at N=104, to the end of the shell at N=126 keste15 .
Starting from the quadrupole invariant (15), one can extract a value of the deformation (see, e.g., references Srebrny06 ; clement07 ; Wrzo12 )
| (18) |
where is the proton charge and fm. Thus, we can extract values for corresponding to the ground-state and the first excited state.
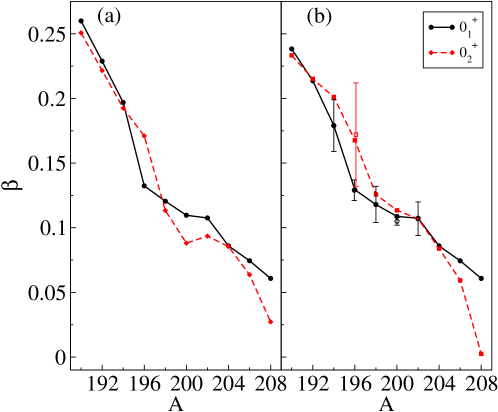
The resulting values, extracted from (18) are shown in Fig. 15(a), and one notices an overall decrease, albeit with a plateau in the mass region 194 A 202, which is the region corresponding with an overall change in the energy scale for the first excited state.
We also provide a different measure of the deformation value and extract a value of starting from a given B(E2) value through the expression:
| (19) |
where is a Clebsch-Gordan coefficient.
In particular, we extract the value of , derived from the value, but also for any other value along the yrast band. The extracted values then give interesting information about a possible variation along the band. Note that we extract the value for from and for from . The corresponding values are plotted in Fig. 15(b) and are fully consistent with the results, as shown in Fig. 15(a). They are slightly smaller because of using only a single but dominant reduced transition probability.
The results for the Po nuclei are contrasting with the nearby Hg and Pt isotopes. In a similar analysis as the one carried out here, but for the Hg isotopes (see Figs. 2 and 3 in reference Garc15 ), the values extracted from the IBM-CM results exhibit a strong difference in the interval 180 A 190. This is consistent with the values extracted from the (showing the less deformed oblate structure) and from the (associated with a more deformed prolate structure) and quite different from the overall smooth drop in the values extracted in the Po isotopes. Comparing with the Pt nuclei, in which fewer data were available (see figure 3.27 in wood92 ), down to mass A=188, values extracted from the and the reduced E2 transition probabilities do not show the same large separation as in the case of the Hg isotopes. In the Pt case, a rather smooth transition (a bump) from the region with A 188 moving towards the mid-shell region exists. This was shown to be a consequence of the rather strong mixing between regular and intruder configurations García-Ramos and Heyde (2009); Garc11 . The behavior of , within the context of the IBM-CM, indicated a similar bump as a function of mass number Garc14a .
Interesting information about the changing collective structure along the yrast band for the Po can be extracted studying the variation of the moment of inertia as one moves up the band structure. A quantitative measure, that is often used, is the kinematic moment of inertia J(1), which is defined as bomot75 ; nils95
| (20) |
where is the energy diffence . For an ideal rigid rotor, with a moment of inertia that is independent of the angular momentum J, the kinematic moment of inertia reduces to a constant.
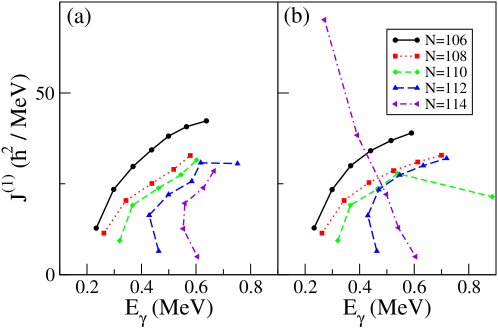
In constructing the experimental J(1) values, we use the yrast band energies for the corresponding Jπ values. However, approaching the high-spin levels with 8+, 10+,12+, it can happen that non-collective (mainly broken-pair configurations) do cross the collective structure, giving also rise to isomeric states as a fingerprint. Consequently, considering those states, the smooth variation of J(1) will change into a backbending pattern. Experimental data on lifetimes, -ray intensities characterizing the decay within a band structure, as well the coincidence data with -rays from the low-energy transitions in the experimental yrast bands, have been used to construct the resulting J(1) values. In particular, for the Po nuclei (see references jul01 ; wise07 ; hela96 ; grahn09 ; bern95 ; lach94 ), we cover the 106 N 114 (190 A 198), region, with the results presented in Fig. 17. A similar analysis spanning a smaller set of Po nuclei, was carried out in references jul01 ; hela99 ; vande03a ; wise07 . One observes a very smooth increase along the yrast band, moving up to rather high spin values in the A=190 (up to spin 14+), 192 and 194 (up to spin 10+) isotopes, consistent with the energy spectra as shown in Fig. 1. It is only for the higher-spin states, which are of a non-collective broken-pair nature, that very small energy differences appear, not at all consistent with collective excitations and giving rise to strong back-bending (not shown here). From A=198, and onwards, a different energy pattern for J(1) is observed. For the lower part of the band, up to the 6 level, the values of Eγ are roughly constant, indicating the typical energy differences of a vibrational structure. The fairly correct reproduction of this trend by the IBM-CM results indicates that the major physics content is rather well described.
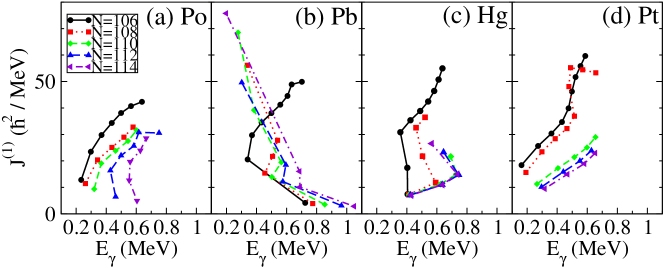
It is also interesting to compare - making use of the experimental data on band structure and shape coexistence in the Pb region - the Po nuclei, with the neighboring Pb, Hg and Pt isotopes in order to appreciate similarities and differences, covering the same neutron interval 106 N 114, as shown in Fig. 18. The data used to construct the J(1) band for the Po, Pb, Hg, and Pt isotopes have been taken from the references given in Section II and drac98 .
An obvious observation from Fig. 18, is the fact that at N=106, i.e. the nuclei 190Po,188Pb,186Hg and 184Pt, from Jπ= 6+ onwards, a very similar variation in the value of J(1) results. The starting point in these nuclei is 30 MeV-1, followed by a similar slope up to spins 12+ and 14+. In view of the well-established prolate character in the case of 188Pb and 186Hg, it is a convincing argument that the ground-state band in both 190Po and 184Pt, from spin 4+, 6+, and onwards, behave like a prolate band too. One also notices that since the ground state 0+ and first excited 2+ state in 188Pb retain mainly a spherical character, the low Eγ part exhibits a different sloping start, very much like it is the case in 186Hg. In the latter nucleus, there appears an off-set of the prolate band versus the ground-state less deformed band (oblate, anharmonic vibrational) causing almost constant values of J(1) to result for the 2+,4+ states. In 190Po and 184Pt, a very smooth behavior results along the yrast band, extending up to rather high-spin states and this for the whole region 106 N 114. One also observes a considerable drop in the value of J(1) in this interval, which is of the order of 10 MeV-1. In this respect, the Po and Pt nuclei exhibit a rather similar collective behavior, with the ”intruder” states being not that obvious from the experimental data on excitation energies nor the corresponding B(E2) electromagnetic properties. Only radii and alpha-decay hindrance factors point towards the need to consider both configuration (regular [N] and intruder [N+2]) spaces.
VII Conclusions and outlook
The Po region constitutes one of the clearer examples where shape coexistence plays a key role in explainig the major observed features such as the evolving energy spectra, with mass number decreasing from the neutron closed shell at N=126, approaching the mid-shell region at N=104, the electromagnetic properties, in particular the B(E2) systematics, nuclear mean-square charge radii, -decay hindrance factors, etc. These isotopes are situated in the region of the Pb, Hg and Pt isotopes where the proximity of the Z=82 proton closed shell, and its stabilizing effect to keep nuclei mainly into a spherical shape, in particular for the Pb nuclei, is very evident. These series of isotopes can be divided in two groups: on the one hand, the Pb and Hg nuclei, in which two (or even three for the Pb nuclei) types of configurations coexist and are experimentally well documented, characterized by energy spectra that exhibit the characteristic parabolic behavior of the intruder band structure, minimizing its excitation energy at the mid-shell, N=104 fossion03 ; Garc14a . On the other hand, the Pt and Po isotopes for which one cannot disentangle easily the presence of two distinct band structures. Still, in both the Pt and Po isotopes, approaching the mid-shell point, the first excited 0+ state behaves in an unexpected way, dropping seriously in excitation energy which can be used as an indirect hint for the presence of shape coexistence, however in a concealed way Garc11 .
In the present paper, we have carried out an extensive study of the chain of isotopes 190-208Po using the Interacting Boson Model, including pair boson excitations across the Z=82 proton closed shell (called the intruder configuration space), and their interaction with the regular configuration space, called the IBM-CM. We have determined the Hamiltonian and the E2 operator describing this interacting system of bosons, through a least-squares fit to the known experimental data. This then results in the energy spectra, and, moreover, the calculation of many different observables such as the B(E2) values, nuclear mean-square charge radii, gyromagnetic factors and -decay hindrance factors give the possibility to test the nuclear dynamics. In particular, the latter three observables are shown to serve as fingerprints to test the relative composition of the nuclear wave function into its ”regular” and ”intruder” components, and thus are strong indicators for the presence of shape coexisting structures.
A very important issue concerns deriving information on the nuclear deformation properties. In particular, recent Coulomb excitation experiments on nuclei far from stability made it possible to extract a set of reduced E2 matrix elements . These matrix elements can be used to construct the so-called ”quadrupole shape invariants” for the 0 and 0 states. We have given particular attention to how -values can be derived from these invariants, or alternatively, from known experimental B(E2) values, and compared both approaches in the case of the Po nuclei. Thereby, a clear picture of the shape coexistence phenomenon in Po arises. There are two families of configurations, one slightly deformed (rather -unstable) or spherical that corresponds to the regular configurations, while the other more deformed and corresponding to the intruder configurations. Because of the lack of experimental information it is not possible to determine unambiguously the shape connected to the two families of configurations and, indeed, through the use of mean-field results (see section III) we assume an oblate shape for the intruder states, although the moment of inertia seems to suggest a prolate shape for the ground state of 190Po. Both configurations have a rather large interplay and in the mid-shell region with the two unperturbed bandheads being degenerate in energy implying important mixing between the two configuration spaces. We have found that, in contrast with the Hg nuclei, the difference in the quadrupole deformation extracted for the 0 and 0 states is quite small and the mass dependence very similar, independent of the method used to extract the quadrupole deformation.
Concluding, it looks like the data available at present, based on our present study of the Po isotopes and a comparison with the Pt isotopes points towards rather similar structures. In both cases the ground-state at the mid-shell is composed mainly from the intruder configurations, although in the Po isotopes, only the second part of the neutron shell N=82-126 has been studied experimentally. For the Pt isotopes, almost the whole shell has been covered, but for the Po nuclei, because of the sparse character of the known data in and below N=106, A=190, a detailed comparison is very difficult. Moreover, the similar character of the Po and Pt isotopes is supported from a comparison of the kinematic moments of inertia for the Po and Pt isotopes: both exhibit a smooth variation as a function of neutron number in the interval 106 N 114. Comparing with the corresponding moments of inertia in the Pb and Hg isotopes, the nuclei 190Po, 188Pb, 186Hg, and 184Pt (starting at spin 6+) are very similar, resulting in the suggestion that from that spin, and onwards, the 190Po ground band behaves like a prolate band. This is further corroborated by a comparison of the known experimental excitation energies for the prolate bands that have been observed in 186Hg and in 188Pb for states with spin from 6+ to 10+. They match very well the corresponding energies in the yrast band structure in 190Po. Possibilities to test this proposal might come partly from multiple Coulomb excitation with higher energy projectile ions (HIE-ISOLDE), and, possibly at a later stage, using one and two nucleon transfer reactions and studying E0 properties for the Po nuclei, which may lead to the direct observation of a low-lying excited 0+ state, as suggested by the present study.
VIII Acknowledgment
We are very grateful to N. Kesteloot for generous sharing of their most recent results on Coulomb excitation (A=196-198). We thank M. Huyse, P. Van Duppen for continuous interest in this research topic and J.L. Wood for stimulating discussions in various stages of this work. Financial support from the “FWO-Vlaanderen” (KH and JEGR) and the InterUniversity Attraction Poles Programme - Belgian State - Federal Office for Scientific, Technical and Cultural Affairs (IAP Grant No. P7/12) is acknowledged. This work has also been partially supported by the Spanish Ministerio de Economía y Competitividad and the European regional development fund (FEDER) under Project No. FIS2011-28738-C02-02 and by Spanish Consolider-Ingenio 2010 (CPANCSD2007-00042).
References
- (1) H. Morinaga, Phys. Rev. 101 254 (1956).
- (2) P. Van Duppen, E. Coenen, K. Deneffe, M. Huyse, K. Heyde, and P. Van Isacker, Phys. Rev. Lett. 52, 1974 (1984).
- (3) A.N. Andreyev et al., Nature 405, 430 (2000).
- (4) K. Heyde, P. Van Isacker, M. Waroquier, J.L. Wood, and R.A. Meyer, Phys. Rep. 102, 291 (1983).
- (5) J.L. Wood, K. Heyde, W. Nazarewicz, M. Huyse, and P. Van Duppen, Phys. Rep. 215, 101 (1992).
- (6) K. Heyde and J.L. Wood, Rev. Mod. Phys. 83, 1467 (2011).
- (7) Y. Blumenfeld, T. Nilsson, and P. Van Duppen, Nobel Symposium 152: Physics with Radioactive Beams, eds. C. Fahlander, and B. Jonson, Phys. Scr. T 152 014023 (2013).
- (8) R. Julin, K. Helariutta, and M. Muikku, J. Phys. G 27, R109 (2001).
- (9) A. Gade, and Th. Glasmachter, Progr. Part. Nucl. Phys. 60, 161 (2008).
- (10) A. Görgen, J. Phys. 37, 103101 (2010).
- (11) P. G. Hansen, and J.A. Tostevin, Ann. Rev. Nucl. Part. Sci. 53, 219 (2003)
- (12) M. Pfützner, M. Karny, L. V. Grgigorenko, and K. Riisager, Rev. Mod. Phys. 84, 567 (2012).
- (13) T. Baumann, A. Spyrou, and M. Thoennessen, Rep. Progr. Phys. 75, 036301 (2012).
- (14) K. Blaum, J. Dilling, and W. Nörtershäuser, Nobel Symposium 152: Physics with Radioactive Beams, eds. C. Fahlander, and B. Jonson, Phys. Scr. T 152 014017 (2013).
- (15) B. Cheal and K. T. Flanagan, J. Phys. 37, 113101 (2010).
- (16) G. Neyens, Rep. Progr. Phys. 66, 633 (2003).
- (17) J.L. Wood, E. F. Zganjar, C. De Coster, and K. Heyde, Nucl. Phys. A 651, 323 (1999).
- (18) T. Kibédi, and R. H. Spear, At. Data Nucl. Data Tab. 89, 77 (2005) ,
- (19) E. Caurier, and F. Nowacki, Acta Phys. Pol. B 30, 705 (1999)
- (20) B. A. Brown, and W. D. M. Rae Nucl. Data Sheets 120, 115 (2014)
- (21) N. Shimizu, T. Abe, Y. Tsunoda, Y. Utsuno, T. Yoshida, T. Mizusaki, M. Honma, and T. Otsuka Progr. Theor. Exp. Phys. 2012, 01A205 (2012)
- (22) E. Caurier and G. Martínez-Pinedo and F. Nowacki and A. Poves and A. P. Zuker, Rev. Mod. Phys. 77, 427 2005.
- (23) R. Bengtsson, T. Bengtsson, J. Dudek, G. Leander, W. Nazarewicz, and Jing-Ye Zhang, Phys. Lett. B 183, 1 (1987).
- (24) R. Bengtsson and W. Nazarewicz, Z. Phys. A 334, 269 (1989).
- (25) W. Nazarewicz, Phys. Lett. B 305, 195 (1993).
- (26) M. Bender, P.-H. Heenen, and P.-G. Reinhard, Rev. Mod. Phys. 75, 121 (2003).
- (27) T.H.R. Skyrme, Nucl. Phys. 9, 615 (1959).
- (28) D. Vautherin and D.M. Brink, Phys. Rev. C 5, 626 (1972).
- (29) J. Erler, P. Klüpfel, and P.-G. Reinhard, J. Phys. 38, 033101 (2011).
- (30) D. Gogny in Proceedings of the International Conference on Nuclear Physics, M nich, 1973, eds. J. De Boer and H.J.Mang, North Holland, Amsterdam (1973).
- (31) D. Gogny in Proceedings of the International Conference on Nuclear Selfconsistent Fields, 1975, Trieste, eds. G Ripka and M. Porneuf, North-Holland, Amsterdam (1975).
- (32) J. Dechargé and D. Gogny, Phys. Rev. C 21, 1568 (1980).
- (33) M. Girod, P. Dessagne, M. Bernas, M. Langevin, F. Pougheon, and P. Roussel, Phys. Rev. C 37, 2600 (1988).
- (34) J. Libert, M. Girod, and J.-P. Delaroche, Phys. Rev. C 60, 054301
- (35) J. D. Walecka, Ann. Phys. (N. Y.) 83 491 (1974).
- (36) B. D. Serot, Rep. Prog. Phys. 55, 1855 (1992).
- (37) P.-G. Reinhard, Rep. Progr. Phys. 52 439 (1989).
- (38) B. D. Serot, and J. D. Walecka, Advances in Nuclear Physics (Plenum Press, New York), vol.16 1 (1986).
- (39) P. Ring, Progr. Part. Nucl. Phys. 37, 193 (1996).
- (40) T. Nikšić, D. Vretenar, and P. Ring, Progr. Part. Nucl. Phys. 66, 519 (2011).
- (41) A. Bohr, B.R. Mottelson, Nuclear structure Vol. II, W.A. Benjamin Inc. Advanced Book Program Reading Massachusetts (1975).
- (42) D.J. Rowe, and J. L. Wood, Fundamentals of Nuclear Models: Foundational Models, World. Scient. Publ. (2010).
- (43) L. Próchniak, and S. G. Rohozinski, J. Phys. 36, 123101 (2009).
- (44) J. P. Delaroche, M. Girod, J. Libert, H. Goutte, S. Hilaire, S. Péru, N. Pillet, and G. F. Bertsch, Phys. Rev. C 81, 014303 (2010).
- (45) M. Matsuyanagi, M. Matsuo, T. Nakatsukasa, N. Hinohara, and K. Sato, J. Phys. 37, 064018 (2010).
- (46) F. Iachello and A. Arima, The Interacting Boson Model, Cambridge University Press (1987).
- (47) P.D. Duval and B.R. Barrett, Phys. Lett. B 100, 223 (1981).
- (48) P.D. Duval and B.R. Barrett, Nucl. Phys. A 376, 213 (1982).
- (49) K. Heyde, J. Jolie, J. Moreau, J. Ryckebusch, M. Waroquier, P. Van Duppen, M. Huyse, and J.L. Wood, Nucl. Phys. A 466, 189 (1987).
- (50) K. Heyde, J. Schietse, and C. De Coster, Phys. Rev. C 44, 2216 (1991).
- (51) J. Pakarinen et al., Phys. Rev. C 75, 014302 (2007).
- (52) R. Fossion, K. Heyde, G. Thiamova, and P. Van Isacker, Phys. Rev. C 67, 024306 (2003).
- (53) V. Hellemans, R. Fossion, S. De Baerdemacker, and K. Heyde, Phys. Rev. C 71, 034308 (2005).
- (54) V. Hellemans, S. De Baerdemacker, and K. Heyde, Phys. Rev. C 77, 064324 (2008).
- (55) M.K. Harder, K.T. Tang, and P. Van Isacker, Phys. Lett. B 405, 25 (1997).
- (56) S.L. King et al., Phys. Lett. B 433, 82 (1998).
- García-Ramos and Heyde (2009) J.E. García-Ramos and K. Heyde, Nucl. Phys. A 825, 39 (2009).
- (58) J.E. García-Ramos, V. Hellemans, and K. Heyde, Phys. Rev. C 84, 014331 (2011).
- (59) J.E. García-Ramos, K. Heyde, L. M. Robledo, and R. Rodriguez-Guzmán, Phys. Rev. C 89, 034313 (2014).
- (60) E.A. McCutchan and N.V. Zamfir, Phys. Rev. C 71, 054306 (2005) and private communication.
- (61) E. A. McCutchan, R.F. Casten, and N.V. Zamfir, Phys. Rev. C 71, 061301(R) (2005).
- (62) A. Barfield, B.R. Barrett, K. A. Sage and P. D. Duval, Z. Phys. A 311, 205 (1983).
- (63) A. Barfield, and B.R. Barrett, Phys. Lett. B 149, 277 (1984).
- (64) J.E. García-Ramos, and K. Heyde, Phys. Rev. C 89, 014306 (2014).
- (65) K. Nomura, N. Shimizu, and T. Otsuka, Phys. Rev. Lett. 101, 142501 (2008).
- (66) K. Nomura, N. Shimizu, and T. Otsuka, Phys. Rev. C 81, 044307 (2010).
- (67) A. Arima, T. Otsuka,F. Iachello, and I. Talmi, Phys. Lett B 66, 205 (1977).
- (68) T. Otsuka, A. Arima, F. Iachello, and I. Talmi, Phys. Lett B 76, 139 (1978).
- (69) K. Nomura, T. Otsuka, R. Rodríguez-Guzmán, L. M. Robledo, and P. Sarriguren, Phys. Rev. C 83, 014309 (2011).
- (70) K. Nomura, T. Nikšić, T. Otsuka, N. Shimizu, and D. Vretenar, Phys. Rev. C 84, 014302 (2011).
- (71) K. Nomura, R. Rodríguez-Guzmán, and L. M. Robledo, Phys. Rev. C 87, 064313 (2013).
- (72) K. Nomura, R. Rodríguez-Guzmán, L. M. Robledo, and N. Shimizu, Phys. Rev. C 86, 034322 (2012).
- (73) B. Singh, Nucl. Data Sheets 99, 275 (2003).
- (74) C.M. Baglin, Nucl. Data Sheets 113, 1871 (2012).
- (75) B. Singh, Nucl. Data Sheets 107, 1531 (2006).
- (76) H. Xiaolong, Nucl. Data Sheets 108, 1093 (2007).
- (77) H. Xiaolong, Nucl. Data Sheets 95, 59 (1995).
- (78) F. G. Kondev, and S. Lalkovski, Nucl. Data Sheets 108, 1471 (2007).
- (79) S. Zhu, and F. G. Kondev, Nucl. Data Sheets 109, 699 (2008).
- (80) C. J. Chiara, and F. G. Kondev, Nucl. Data Sheets 111, 141 (2010).
- (81) F. G. Kondev, Nucl. Data Sheets 109, 1527 (2008).
- (82) M. J. Martin, Nucl. Data Sheets 108, 1583 (2007).
- (83) M. S. Basania, Nucl. Data Sheets 121, 561 (2014).
- (84) N. Fotiades et al., Phys. Rev. C 55, 1724 (1997).
- (85) K. Helariutta et al., Phys. Rev. C 54, R2799 (1996).
- (86) K. Helariutta et al., Eur. Phys. J. A 6, 289 (1999).
- (87) W. Younes et al., Phys. Rev. C 52, R1723 (1995).
- (88) D. Alber, R. Alfier, C. E. Bach, D. B. Fossan, H. Grawe, H. Kluge, M. Lach, K. H. Maier, M. Schramm, R. Schubart, M. P. Waring, L. Wood, H. Hübel, and Jing-ye Zhang, Z. Phys. A 339, 225 (1991).
- (89) L.A. Bernstein et al., Phys. Rev. C 52, 621 (1995)
- (90) M. Lach et al., Z. Phys. A 350, 207 (1994).
- (91) A. Maj, H. Grawe, H. Kluge, A. Kuhnert, K.H. Mayer, J. Recht, N. Roy, H. Hübel, and M. Guttormsen, Nucl. Phys. A 509, 413 (1990).
- (92) N. Bijnens et al., Phys. Rev. Lett. 75, 4571 (1995).
- (93) N. Bijnens et al., Phys. Rev. C 58, 754 (1998).
- (94) J. Wauters, P. Dendooven, M. Huyse, G. Reusen, P. Lievens, P. Van Duppen, and the ISOLDE Collaboration, Z. Phys. A 344, 29 (1992).
- (95) J. Wauters, P. Dendooven, M. Huyse, G. Reusen, and P. Van Duppen, P. Lievens and the ISOLDE Collaboration, Phys. Rev. C 47, 1447 (1993).
- (96) J. Wauters, N. Bijnens, P. Dendooven, M. Huyse, Han Yull Hwang, G. Reusen, J. von Schwarzenberg, P. Van Duppen, R. Kirchner, and E. Roeckl, Phys. Rev. Lett. 72, 1329 (1994).
- (97) J. Wauters, N. Bijnens, H. Folger, M. Huyse, Han Yull Hwang, R. Kirchner, J. von Schwarzenberg, and P. Van Duppen, Phys. Rev. C 50, 2768 (1994).
- (98) A. N. Andreyev et al., Phys. Rev. Lett. 82, 1819 (1999)
- (99) N. Bijnens et.al. Z. Phys. A 356, 3 (1996)
- (100) R. G. Allatt et al., Phys. Lett. B 437, 29 (1998).
- (101) A. N. Andreyev et al., J. Phys. G 25, 835 (1999)
- (102) A. N. Andreyev et al., Phys. Rev. C 66, 014313 (2002)
- (103) A. N. Andreyev et al., Phys. Rev. C 73, 044324 (2006)
- (104) K. Van de Vel et al., Phys. Rev. C 68, 054311 (2003)
- (105) K. Van de Vel et al., Eur. Phys. J. A 24, 57 (2005).
- (106) P. Van Duppen and M. Huyse, Hyperf. Interact. 129, 149 (2000).
- (107) M. Huyse, A. Andreyev, K. Van De Vel, P. Van Duppen and R. Wyss, Hyperf. Interact. 132, 141 (2001).
- (108) D. S. Delion, R. J. Liotta, Chong Qi, and R. Wyss, Phys. Rev. C 90, 061303(R) (2014)
- (109) D. S. Delion and R. J. Liotta, Phys. Rev. C 87, 041302(R) (2013).
- (110) K. Van de Vel et al., Eur. Phys. J. A 17, 167 (2003).
- (111) D. R. Wiseman et al., Eur. Phys. J. A 34, 275 (2007).
- (112) T. Grahn et al., Phys. Rev. Lett. 97, 062501 (2006).
- (113) T. Grahn et al., Nucl. Phys. A 801, 83 (2008).
- (114) T. Grahn et al., Phys. Rev. C 80, 014324 (2009).
- (115) N. Kesteloot et al., Phys. Rev. C, submitted to Phys. Rev. C (2015).
- (116) M. D. Seliverstov et al., Phys. Lett. B 719, 362 (2013).
- (117) M. D. Seliverstov et al., Phys. Rev. C 89, 034323 (2014).
- (118) T.E. Cocolios et al., Phys. Rev. Lett. 106, 052503 (2011).
- (119) A. de Shalit, and I. Talmi, Nuclear Shell Theory (Academic Press, New York, 1963)
- (120) I. Talmi, Simple Models of Complex Nuclei, Harwood Academic Press, Switzerland, 1993)
- (121) J. J. Ressler et al., Phys. Rev. C 69, 034317 (2004)
- (122) W. Younes, and J. A. Cizewski, Phys. Rev. C 55, 1218 (1997)
- (123) J. A. Cizewski, and W. Younes, Z. Phys. A 358, 133 (1997)
- (124) A.M. Oros, K. Heyde, C. De Coster, B. Decroix, R. Wyss, B.R. Barrett and P. Navratil, Nucl. Phys. A 465, 107 (1999).
- (125) F.R. May, V.V. Pashkevich, and S. Frauendorf, Phys. Lett. B 68, 113 (1977).
- (126) N.A. Smirnova, P.-H. Heenen, and G. Neyens, Phys. Lett. B 569, 151 (2003).
- (127) J.M. Yao, M. Bender, and P.-H. Heenen, Phys. Rev. C 87, 034322 (2013).
- (128) Yue Shi, F. R. Xu, H. L. Liu, and P. M. Walker, Phys. Rev. C 82, 044314 (2010).
- (129) Yue Shi, F. R. Xu, P. M. Walker, and G. D. Dracoulis, Phys. Rev. C 85, 064304 (2012).
- (130) K. Heyde, C. De Coster, J. Jolie, and J.L. Wood, Phys. Rev. C 46, 541 (1992).
- (131) K. Heyde, P. Van Isacker, J.L. Wood, Phys. Rev. C 49, 559 (1994).
- (132) C. De Coster, B. Decroix, K. Heyde, J. Jolie, H. Lehmann, and J.L. Wood, Nucl. Phys. A 651, 31 (1999).
- (133) B.R. Barrett, G.D. Dracoulis, and R.A. Bark, Phys. Rev. C 43, R926 (1991).
- (134) M. Scheck et al., Phys. Rev. C 83, 037303 (2011).
- (135) J. Elseviers et al., Phys. Rev. C 84, 034307 (2011).
- (136) R. D. Page et al., Phys. Rev. C 84, 034308 (2011).
- (137) N. Bree et al., Phys. Rev. Lett. 112, 162701 (2014).
- (138) L. Gaffney et al., Phys. Rev. C 89, 024307 (2014).
- (139) K. Wrzosek-Lipska et al., Phys. Rev. C, in preparation (2015).
- (140) E. Rapisarda, priv. comm. and Phys. Rev. C in preparation (2015).
- (141) D.D. Warner and R.F. Casten, Phys. Rev. C 28, 1798 (1983).
- (142) P.O. Lipas, P. Toivonen, and D.D. Warner, Phys. Lett. B 155, 295 (1985).
- (143) K. Heyde, P. Van Isacker, R.F. Casten and J.L. Wood, Phys. Lett. B 155, 303 (1985).
- (144) F. James, Minuit: Function Minimization and Error Analysis Reference Manual, Version 94.1, CERN, 1994.
- (145) N.J. Stone, Atomic Data and Nuclear Data Tables 90, 75 (2005).
- (146) N.J. Stone, Hyperfine Int. Springer DOI 10.1007/s10751-014-1094-8 (2014).
- (147) G. Neyens, S. Ternier, N. Coulier, K. Vyvey, R. Coussement, and D. L. Balabanski, Nucl. Phys. A 625, 668 (1997)
- (148) P. Van Duppen, M. Huyse, and J. L. Wood, J. Phys. G 16, 441 (1990).
- (149) G. D. Dracoulis, A. E. Stuchbery, A. O. Machiavelli, C. W. Beausang, J. Burde, M. A. Deleplanque, R. M. Diamond, and F. S. Stephens, Phys. Lett. B 208, 365 (1988).
- (150) G.D. Dracoulis, Phys. Rev. C 49, 3324 (1994).
- (151) R.D. Page et al., Proc. Of the 3rd International Conference on Exotic Nuclei and Atomic Masses ENAM, Hämeenlinna, Finland, July 2001, eds. J. Äystö, P. Dendooven, A. Jokinen, and M. Leino, Springer-Verlag, Berlin Heidelberg, p. 309 (2003).
- (152) G. D. Dracoulis, G. J. Lane, A. P. Byrne, T. Kibedi, A.M. Baxter, A.O. Macchiavelli,P. Fallon, and R.M. Clark Phys. Rev. C 69, 054318 (2004).
- (153) W. Satula, and R. Wyss, Phys. Scr. T 56, 159 (1995)
- (154) D. Karlgren, R. J. Liotta, R. Wyss, M. Huyse, K. Van de Vel, and P. Van Duppen, Phys. Rev. C 73, 064304 (2006)
- (155) D.S. Delion, A. Florescu, M. Huyse, J. Wauters, P. Van Duppen, A. Insolia, and R.J. Liotta, Phys. Rev. Lett. 74, 3939 (1995)
- (156) D. S. Delion, A. Florescu, M. Huyse, J. Wauters, P. Van Duppen, A. Insola, and R. J. Liotta, Phys. Rev. C 54, 1169 (1996)
- (157) Chang Xu, and Zhongzhou Ren, Phys. Rev. C 75, 044301 (2007)
- (158) G. Ulm, et al., Z. Phys. A 325 247 (1986).
- (159) E. Otten, Nuclear Radii and Moments of Unstable Isotopes, Treatise on Heavy-Ion Science, vol. 8, Nuclei Far from Stability, ed. D.A. Bromley Plenum Press, New York and London, 517 (1989).
- (160) H.-J. Kluge, and W. Nötershäuser, Spectrochim. Acta, Part B: At. Spectrosc. 58, 1031 (2003).
- (161) A. Bohr and B. R. Mottelson, Phys. Scr. 22, 468 (1980).
- (162) J.N. Ginocchio and M.W. Kirson, Nucl. Phys. A 350, 31, (1980).
- (163) A.E.L. Dieperink and O. Scholten, Nucl. Phys. A 346, 125, (1980).
- (164) A.E.L. Dieperink, O. Scholten, and F. Iachello, Phys. Rev. Lett. 44, 1747, (1980).
- (165) R. Gilmore, Lie Groups, Lie Algebras and Some of Their Applications, Wiley (1974).
- (166) A. Frank, O. Castaños, P. Van Isacker, and E. Padilla, in Mapping the Triangle, edited by A. Aprahamian, J.A. Cizewski, S. Pittel, and N.V. Zamfir, AIP Conf. Proc. No 638 (AIP, Melville, NY, 2002), p. 23.
- (167) A. Frank, P. Van Isacker, and C.E. Vargas, Phys. Rev. C 69, 034323 (2004).
- (168) A. Frank, P. Van Isacker, and F. Iachello, Phys. Rev. C73, 061302(R) (2006).
- (169) I.O. Morales, A. Frank, C.E. Vargas, and P. Van Isacker, Phys. Rev. C78, 024303 (2008).
- (170) J.E. García-Ramos and K. Heyde, Phys. Rev. C 89, 014306 (2014).
- (171) K. Kumar, Phys. Rev. Lett. 28, 249 (1972).
- (172) D. Cline, Ann. Rev. Nucl. Part. Sci. 36, 683 (1986).
- (173) C.Y. Wu, D. Cline, T. Czosnyka, A. Backlin, C. Baktash, R.M. Diamond, G.D. Dracoulis, L. Hasselgren, H. Kluge, B. Kotlinski, J.R. Leigh, J.O. Newton, W.R. Philips, S.H. Sie, J. Srebrny, and F.S. Stephens, Nucl. Phys. A 607, 178 (1996).
- (174) E. Clément, et al., Phys. Rev. C 75, 054313 (2007).
- (175) J. Srebrny, and D. Cline, Int. J. Mod. Phys. E 20, 422 (2011).
- (176) J.L. Wood, Lecture notes “Nuclear Collectivity”, Univ. York (2007).
- (177) J.L. Wood, A.-M. Oros-Peusquens, R. Zaballa, J. M. Allmond, and W. D. Kulp, Phys. Rev. C 70, 024308 (2004).
- (178) J. Srebrny et al., Nucl. Phys. A 766, 25 (2006).
- (179) K. Wrzosek-Lipska, et al., Phys. Rev. C 86, 064305 (2012).
- (180) J.E. García-Ramos, and K. Heyde, EPJ Web of Conferences 93, 01004 (2015).
- (181) S.G. Nilsson, and I. Ragnarsson Shapes and Shells in Nuclear structure, Cambridge Univ. Press, Cambridge (1995).
- (182) G.D. Dracoulis, A.P. Byrne, and A. M. Baxter, Phys. Lett. B 432, 37 (1998)