Long-time nonlinear dynamical evolution for P-band ultracold atoms in an optical lattice
Abstract
We report the long-time nonlinear dynamical evolution of ultracold atomic gases in the P-band of an optical lattice. A Bose-Einstein condensate (BEC) is fast and efficiently loaded into the P-band at zero quasi-momentum with a non-adiabatic shortcut method. For the first one and half milliseconds, these momentum states undergo oscillations due to coherent superposition of different bands, which are followed by oscillations up to 60ms of a much longer period. Our analysis shows the dephasing from the nonlinear interaction is very conducive to the long-period oscillations induced by the variable force due to the harmonic confinement.
pacs:
67.85.-d;03.75.Lm;03.75.Hh; 37.10.JkI introduction
The occupation of high orbital quantum state in solid-state system is known to play a crucial role to the understanding of a lot of strongly correlated systems, such as high-temperature superconductivity and semiconductor superc . Ultracold atoms in an optical lattice have been used to simulate quantum many-body systems in the ground state Bloch . Recently, there has been increasing efforts to study ultracold atomic gases in optical lattices at high orbitals Liu1 . This kind of study can not only help to understand high orbital quantum state in solid-state system but also provide a chance to study new physics which is completely beyond that of the solid-state system, such as the emergence of the quantum coherence in the first excited Bloch band of an optical lattice Bloch2 . High orbital physics in cold atomic gas has attracted a lot of attention; there are many theoretical predictions, such as supersolids Ssolid and other novel phases Np1 ; Np2 ; Larson .
The long time dynamics of a Bose-Einstein condensate (BEC) in the quantum state of the S-band has been intensively studied and many interesting phenomena, such as coherent oscillations ScienceOs ; BO and nonlinear self-trapping selfT1 ; selfT2 were observed. However, it is much more challenging to observe the long-time dynamics of a BEC in high orbitals because of the difficulty to prepare the cold atoms in such states and maintain their quantum coherence. For the condensate with a wide quasi-momentum distribution in P-band Bloch2 , the quantum dynamics for the holding time being shorter than 1.3 ms were studied.
Here we experimentally prepare a BEC in the P-band of an optical lattice using a non-adiabatic shortcut method and study its long time quantum dynamics. The initial BEC in the P-band with finite size at quasi-momentum has a local maximum in energy so that this state is unstable when the harmonic confinement and interatomic interaction are considered. For the first one and a half milliseconds, the momentum states undergo fast oscillations. After a brief intermediate interval, the BEC starts a different type of oscillations which have a much longer period ( 14.9ms) and last up to 60ms. We find that these long-period oscillations are due to the presence of an additional harmonic trap, and the dephasing induced by the nonlinear interaction is greatly helpful for this oscillation behavior. This counterintuitive features and long time quantum coherence are possible to study the quantum thermalization.
II Preparation of P-band quantum state with a shortcut method
In our experiment, we first prepare a pure BEC of about 87Rb atoms in a hybrid trap which is formed by overlapping a single-beam optical dipole trap with wave length 1064nm and a quadrapole magnetic trap. The resulting potential has harmonic trapping frequencies Hz, respectively. Our lattice is produced by a standing wave created by two counter-propagating laser beams with lattice constant nm along the -direction.
We then load the BEC into the P-band by applying a series of pulsed optical lattices within tens of microseconds Zhai ; Liu ; Chen ; Campo . There are many other methods preparing a BEC in the P-band quantum state Bloch2 ; NP ; speed ; shaken ; GW , but normally the loading time is tens of milliseconds. Our method has the merit of rapid generation of the quantum state in the P-band. More importantly, this method allows us to generate the desired P-band with very narrow quasi-momentum width around , which is crucial to observe the long-time quantum dynamics. Most recently, this method is proposed to study anisotropic two-dimensional Bose gas Papoular .
We use two acousto-optic modulators to form our designed pulse sequences with the frequency difference MHz which corresponds to a phase shift between two pulses series by . This phase shift is crucial to change the parity of the ground state and thus prepare the state in the P-band. Four special pulses with a chosen depth are used to prepare the state in the P-band around . The details of the pulse series are shown in the Supplementary Material.
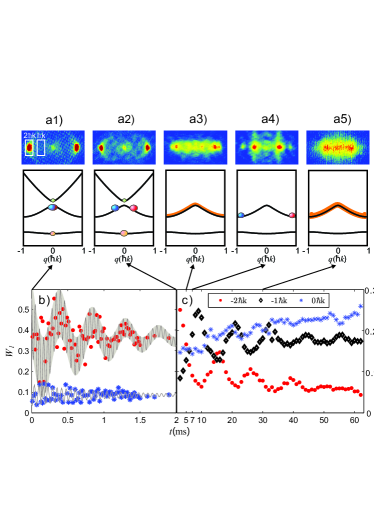
For the quantum state in the S-band with , the momentum distribution has peaks around and with lattice ; Liu . For the quantum sate in the P-band with , because its wave function has the odd parity , the momentum distribution equals to zero at and has significant peaks at , as shown in Fig. 1(a1), where two dominating peaks at are clearly seen.
III Dynamical evolution of the quantum state in P-band
To study the dynamical evolution after a BEC is prepared in the quantum state of the P-band, we hold the condensate for time before measuring the momentum distribution of the ultracold atoms after a time of flight (TOF) of 28ms. The momentum distributions of the BEC at 0ms, 2ms, 5ms, 7ms, 30ms are shown in the first row of Fig. 1(a1, a2, a3, a4, a5). An evolution is clearly observed. The corresponding evolution in the Bloch bands is schematically illustrated in the second row. The depth of the optical lattice is with being the atomic recoil energy.
The momentum distributions are analyzed by computing the normalized atom populations around momentum states () as . Here is the total atom number and is the atomic number around . In the TOF images we choose m as the width to determine the atom number . This is the width of a condensate without any quantum manipulation and after the free expansion of the same TOF. We find ’s oscillation with time as shown in Fig. 1(b, c). In Fig. 1(b), there are rapid oscillations in and . These rapid oscillations disappear around ms. After a short transition time, a different type of oscillations begin to emerge around 2ms. These oscillations can be observed up to 60ms and have a much longer period of 14.9ms. We will show how the interaction would affect this long-period oscillation, which was not observed in the previous work Bloch2 .
IV Short-period oscillations
The short-period oscillations shown in Fig. 1(b) are beating signal due to coherent superposition of different bands. In real experiment, it is impossible to prepare a quantum state completely in the P-band. What we prepared is in fact a superposition of s, p and d bands with negligible higher band. Due to difference in timescale of two oscillations and uncertainty in experiment, the experimental data is shown in the figure comparing with the peripheral contour of the beating signal from theoretical simulation with the choice of the initial quantum state .
With this understanding, the periods of the oscillations in Fig. 1(b) are determined by the band gaps. As there are three band gaps between the s, p, and d bands, there should be three oscillating periods, , , and . Around , the atoms are mostly from the s and d bands due to the odd parity of the P-band. As a result, we expect only one oscillation period s. This is indeed what we see for in Fig. 1(b). Around , all three bands have significant contributions. Because the populations of the s and d bands are both small, the contribution to related to period is of second-order and negligible. As a result, only two periods are expected for , and . The oscillations of in Fig. 1(b) clearly have two different periods, rapid oscillations enveloped by slow oscillations. This is consistent with the fact that is much larger than . For we have s and s.
The short-period oscillations in Fig. 1(b) have a slow decay. This decay is mainly due to the decay of population on P-band induced by collision between atoms Zhai , which is already considered in theoretical results in Fig. 1(b) (solid lines). For our system with atomic number and density of cm-3 for , the calculated decay time is ms. It is coincident to the fitting result (ms) based on the experimental data, and the decay rate in experiment is larger which can be attributed to other mechanism including dephasing of the atom cloud. Considering its finite size, the condensate has a narrow quasi-momentum distribution around with a width of . Our numerical simulation finds that the calculated decay time would increase by about , and numerical simulation shows the influence of this distribution to oscillation frequency is also negligible.
V Long-period oscillations in the P-band
The rapid oscillations disappear at about ms. After a featureless short dynamical evolution, a different type of oscillations begin to emerge at around 2ms. As shown in Fig. 1(c), these oscillations have a much longer period of about ms and their oscillating amplitude subsides gradually and becomes zero around ms after five cycles. This is different to the oscillation period of the harmonic trap ms. If we consider this evolution based on the semi-classical model with an effective potential, where the atoms exerted a variable force due to the harmonic trap and quasi-momentum dependent effective mass, as shown in the Supplementary Material, we see that the period is identical to the experimental result. Different to the Bloch oscillation for atoms on S-band BO ; Gustavsson ; Kling , however, our analysis shows that these long-period oscillations for atoms on P-band are greatly affected by the nonlinear dephasing, and this semi-classical model can not fully coincident to the experimental observation.
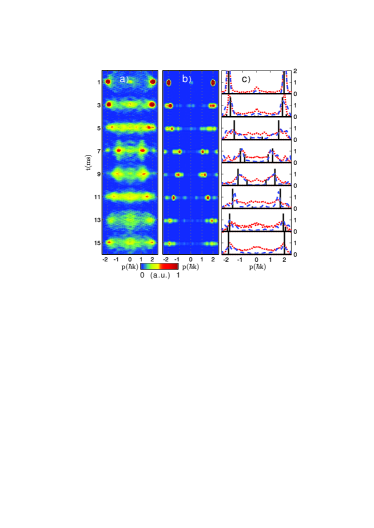
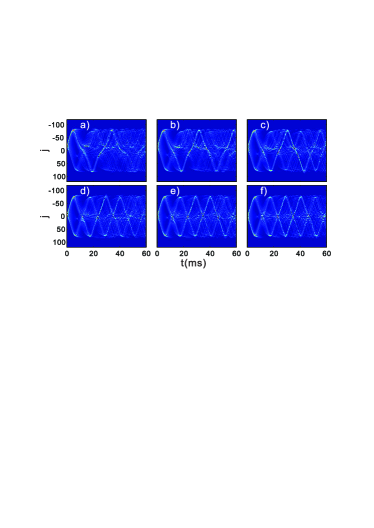
We now look at the experiments in detail. Shown in Fig. 2(a) are the momentum distributions measured experimentally for holding times up to 15ms, which is roughly the first cycle of the oscillations. At ms, the momentum mainly distributes around with , which is the signature of the initial state in the P-band. At ms, the absolute value of the peak quasi-momentum becomes smaller than . This is due to that the kinetic energy is transferred into the potential energy by the harmonic trap. At ms, the atoms spread to the full regime between and . At ms, the atoms concentrate around , an indication of the quantum state has moved to the Brillouin zone edge of the P-band (Fig. 1(a4)). Around ms, most of the atoms have moved back to positions around . Overall, an oscillating pattern is clearly observed in these momentum distributions.
The oscillation pattern can be well captured by our simulation with the Gross-Pitaevskii equation (GPE) as seen in Fig. 2(b), where the simulation is to begin with the ground state in harmonic trap, and carry out with the same experimental process. At the center of the momentum distribution, the experiment shows significant population, which is due to the presence of incoherent atoms. To show it more clearly, we have integrated out the vertical direction and compared the experimental and numerical results in Fig. 2(c). We see that the peak positions are seen clearly matching very well. The experimental results (red dotted line) agree with the theoretical simulation (blue dashed line), where the black line is based on the semi-classical model.
.
VI Effects of the random phase between neighboring lattice sites on the long-period oscillation
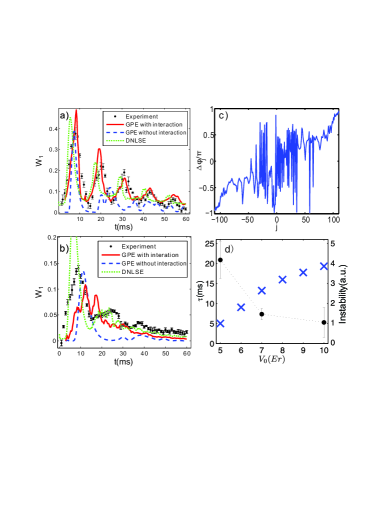
The observed time evolution (black dots with error bar) of the proportion with momentum is given in Fig. 3(a) for , where we can distinguish five cycles of oscillation. In the figure we have extracted incoherent atoms at the center, and correspondingly the numerical simulation is multiplied by a decay factor. For , the theoretical simulation with interatomic interaction (red solid curve) agrees perfectly with the experimental result. It is quite surprising that the simulation without interatomic interaction (blue dashed curve) doesn’t show clear periodic behavior, which differs significantly with the experiment. Both in experiment and theoretical simulation, the interaction has an effect of stabilizing the oscillation. This is counterintuitive by noticing that (i) the repulsive interaction has the effect of widening the wave packet and thus it seems that it should destroy the oscillation; (ii) the interaction usually plays a role of destroying the quantum coherence because of the nonlinear interaction.
To solve this puzzle, we consider the following evolution of the order parameter of the condensate,
| (1) |
Here is the number of atoms initially in the th lattice site, and with the Wannier wave function located in the th lattice site and the corresponding coefficient. For atoms in th site, initial situation is . During evolution of the single site wave function, population would transfer from the th site to different site , and can be rewritten as . Despite a smoothly varying of the external harmonic potential, the contribution of both the kinetic energy and potential energy to the phase is the same for every lattice site. However, the phase due to the interatomic interaction is proportional to each site’s atom number which could be quite different for neighboring lattice sites. As shown in Fig. 3(c), the phase difference between neighboring lattice sites appears completely random because of interatomic interaction at ms. In a sense, the relative phase between neighboring sites is pseudorandom because it appears random only after the relative phase is confined between and .
In this case, when the density distribution or momentum distribution is considered, the interference term between different could be omitted, i.e.
| (2) | |||||
With the above approximate expression, we solve every by the discrete nonlinear Schrődinger equation (DNLSE) ScienceOs , and then get the momentum distribution, as shown with the green dotted lines in Figs. 3(a) and 3(b). In this situation, our numerical calculations show periodic behavior with each peak shift ahead a little comparing with experiment, however, the period of the time agrees very well with the experimental result. In the Supplementary Material, we give the evolution of the which shows that there is long time period behavior in . For the condensate in the P-band, because in every , it has the peaks around and , the wave packet in every lattice site will split into two parts, propagate in different directions and oscillate due to the presence of the harmonic trap. It is natural that the incoherent superposition in Eq.(2) will also have the long time periodic oscillation. For the GPE agrees better with the experiment than the method of DNLSE and Eq.(2), while here the DNLSE simulation shows the physical picture more clearly.
To verify further the role of random phase in the appearance of the long-time period behavior, we add this random phase artificially for noninteracting case and solve numerically the Schrődinger equation. We find that there is perfect periodic behavior in , although the period is a little different from the interaction case.
In Fig. 3(b), we give the experimental result for . We see that the amplitude of the oscillation for is much smaller than . For , there is a much stronger damping which is due to the highly suppressed tunneling between neighboring sites. In addition, there is no clear periodic behavior in this case. The simulation with GPE doesn’t agree well with the experimental result. This may due to the fact that at , the particle number is highly squeezed so that there is a breakdown of the mean-field theory, which induces the disappearance of the interference between . It seems that the theoretical simulation with GPE for agrees better with the experiment than the method with DNLSE.
VII Discussion and Summary
In the long time evolution, the oscillation amplitude and damping are greatly affected by the dynamical instability due to the interaction between atoms. We calculated the dynamical instability insta ; insta2 of P-band at lattice depth varying form 5 to 10. In Fig. 3(d) the cross points show the calculated dynamical instability with the ratio of different lattice depth and 5. The solid circles give the lifetime of oscillation by fitting the experimental data with exponential decay. As expected, the increasing of will lead to larger dynamical instability ratio, and lead to the suppression of the oscillation.
In summary, we demonstrate an effective way of loading atoms directly into P-band using two group of lattice pulses with different phases to break the parity of the Hamiltonian. Our preparation of the P-band with is different from Ref. Bloch2 where the condensate has a distribution in the regime between and . In our work, the evolution of the condensate in the P-band is studied experimentally. The short-period oscillation due to coherent superposition of different bands and long-period oscillation reflecting the random relative phase between neighboring lattice sites are observed simultaneously. The present experiment paves the way to study the long time dynamical evolution of the high orbital physics for other novel quantum state such as fermonic superfluid, molecular condensate and condensate with special configuration of optical lattice.
ACKNOWLEDGEMENT
This work is partially supported by the state Key Development Program for Basic Research of China No.2011CB921501, NSFC (Grants No.61475007, No.11334001 and No.91336103), RFDP (Grants No.20120001110091).
Appendix A Loading method
The Hamiltonian of a single-atom in a one-dimensional optical lattice can be expressed as:
| (3) |
where is the depth of the optical lattice, which is in unit of , is the recoil energy of the atom, is the momentum of the atom along -direction, is the atom mass, is the wave vector and is the lattice constant. The eigenstate of the Hamiltonian Eq. (3) is the Bloch state .
Since the system is periodic, and our loading method conserves the quasi-momentum, we can choose the plane waves with quasi-momentum as a set of complete bases, i.e.,
| (4) |
where is the superposition coefficient, is an index number, is the quasi-momentum, and is the eigenstate of . On the other hand, the state can also be expressed in the Bloch state as , where is the band index. The aim state is the first excited state at , as shown in Fig. 4().
Our shortcut method includes a series of designed standing wave pulses. The atom state , where and are the time evolution operator and free evolution operator for the th pulse with duration and , respectively. The atom experiences spatial period potential in the pulse duration, and the different momentum states can gain different phase factors between the interval.
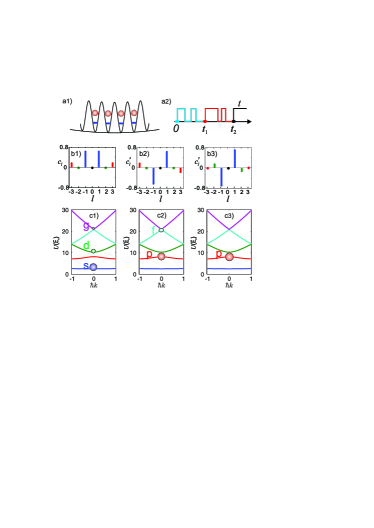
Our preparation process consists of two series of pulses as shown in Fig. 4(), where we need optimize the fidelity between the aim state and to its maximum by changing the parameters of pulse sequence. In the first series of pulses from to , the atom experiences spatial potential . For the second series pulses from to the atom experiences potential . The coefficients () and the distribution in the Bloch band are shown in Fig. 4(b) and (c), respectively.
For a pure Bloch state or a superposition state with different Bloch state at , the parity can be given as , where stands for a state with odd parity and even.
At time , all the components in the parity would satisfy , as shown in Fig. 4(), and the atom is distributed in the s,d,g… bands, as in Fig. 4(). However, from the view of the second series of pulses, by the lattice shift, the coefficient would be appended with a phase according to , as , and the relation between the coefficients become . In our loading process, the first series of pulses ensure that coefficient with even is zero, and thus the parity of state can be completely changed as shown in Fig. 4(). Its energy band distribution is in the p,f,.., as drawn in Fig. 4(). At time , as shown in Figs. 4() and (), with another two pulses conserving the parity, only P-band state is populated.
Appendix B Effective potential model for p band dynamics
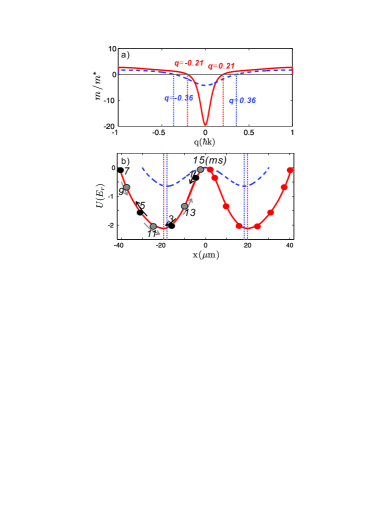
Here we consider a semi-classical model to understand the periodic dynamics in the P-band. In the optical lattice, the effective mass is , where is the group velocity and is the energy of the P-state for different . In Fig. 5(a), the ratio between and is shown for and , respectively. We see that the effective mass changes sign at the and for and , respectively.
With the semi-classical model, we simplify the problem by considering a quasi-particle with and study the dynamical process in the harmonic trap. When the effective mass is considered, the acceleration is given as mass , where is the force driven by the harmonic trap without the optical lattice. Using , , and the initial condition, we get , , and at time . Then by expressing all the parameters as function of , the dynamical evolution can be described by an effective potential:
| (5) |
In Fig. 5(b), we give the numerical results of the effective potential. This means that the external confinement acts as a repulsive potential mass ; massPu and the atoms at trap center would be divided into two symmetrical parts for the different momentum states. The minimums of the potential correspond to the points where the sign of the effective mass changes from the negative to positive. The initial atoms in the P-band at and m near the center of the effective potential, would move from the center to the edge (as points denoted by time ms) and then come back (as points by time ms) and form an oscillation.
Appendix C Simulation with single site DNLSE
Here we demonstrate the long-period oscillation from the random phase between neighboring lattice sites in detail. As shown before, the simulation without interatomic interaction doesn’t have a perfect oscillation. However, when the interference terms between different sites are omitted, we can simulate the evolution of each single site based on the DNLSE ScienceOs , and the population would evolute with time as shown in Figs. 6 and 7 for and lattice depth, respectively. For , atoms in different lattice sites would be distributed more concentrated during the oscillation, while for the atoms would disperse more rapidly into different lattice sites.
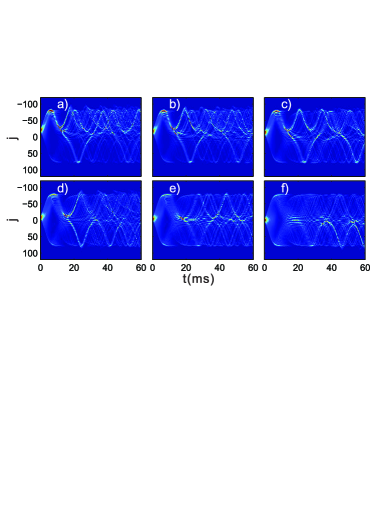
According to the evolution of the wave function in the th lattice site of the optical lattice and the harmonic trap, for each site’s evolution, there is a perfect oscillation for the ratio of atoms with momentum versus the holding time in the potential. The initial state is the superposition of Wannier functions in different lattice sites. Considering the fact that the randomization between neighboring lattice sites arises from the atomic interaction, the total momentum distribution is given as the weighted incoherent superposition of every site’s wavefunction’s evolution. Therefore, the whole atom cloud could also exhibit a good oscillation behavior with time. However, if the coherence term exists, the result would be different, and the collective oscillation is destroyed as shown by the simulation in Fig. 3 of main body.
References
- (1) P. A. Lee, N. Nagaosa, and X. G. Wen, Rev. Mod. Phys. 78, 17 (2006).
- (2) I. Bloch, J. Dalibard, and W. Zwerger, Rev. Mod. Phys. 83, 331 (2011).
- (3) M. Lewenstein, W. V. Liu, Nat. Phys. 7, 101 (2011).
- (4) T. Müller, Simon Fölling, A. Widera, and I. Bloch, Phys. Rev. Lett. 99, 200405 (2007).
- (5) V. W. Scarola and S. Das Sarma, Phys. Rev. Lett. 95, 033003 (2005).
- (6) X. Li, Z. Zhang, and W. V. Liu, Phys. Rev. Lett. 108, 175302 (2012).
- (7) W. V. Liu and C. Wu, Phys. Rev. A 74, 013607 (2006).
- (8) F. Pinheiro, G. M. Bruun, J. P. Martikainen, J. Larson, Phys. Rev. Lett. 111, 205302 (2013).
- (9) F. S. Cataliotti, S. Burger, C. Fort, P. Maddaloni, F. Minardi, A. Trombettoni, A. Smerzi, and M. Inguscio, Science 293, 843 (2001).
- (10) O. Morsch, J. H. Müller, M. Cristiani, D. Ciampini, and E. Arimondo, Phys. Rev. Lett. 87, 140402 (2001).
- (11) A. Trombettoni and A. Smerzi, Phys. Rev. Lett. 86, 2353 (2001).
- (12) Th. Anker, M. Albiez, R. Gati, S. Hunsmann, B. Eiermann, A. Trombettoni, and M. K. Oberthaler, Phys. Rev. Lett. 94, 020403 (2005).
- (13) Y. Y. Zhai, X. G. Yue, Y. J. Wu, X. Z. Chen, P. Zhang, X. J. Zhou, Phys. Rev. A 87, 063638 (2013).
- (14) X. X. Liu, X. J. Zhou, W. Xiong, T. Vogt, X. Z. Chen, Phys. Rev. A 83, 063402 (2011).
- (15) X. Chen, A. Ruschhaupt, S. Schmidt, A. delCampo, D. Guéry-Odelin, and J. G. Muga, Phys. Rev. Lett. 104, 063002 (2010).
- (16) S. Masuda, K. Nakamura, A. D. Campo, Phys. Rev. Lett. 113, 063003 (2014).
- (17) A. Browaeys, H. Häffner, C. McKenzie, S. L. Rolston,K. Helmerson, and W. D. Phillips, Phys. Rev. A 72, 053605 (2005).
- (18) P. S. Panahi, D. S. Lüḧmann, J. Struck, P. Windpassinger and K. Sengstock, Nat. Phys. 8, 71 (2012).
- (19) C. V. Parker, L. Ha, and C. Chin, Nat. Phys. 9, 769 (2013).
- (20) G. Wirth, M. Ölschläger, and A. Hemmerich, Nat. Phys. 7, 147 (2011).
- (21) D. J. Papoular and S. Stringari, Preprint arXiv: 1412.7727 (2015).
- (22) P. Pedri, L. Pitaevskii, S. Stringari, C. Fort, S. Burger, F. S. Cataliotti, P. Maddaloni, F. Minardi, and M. Inguscio, Phys. Rev. Lett. 87, 220401 (2001).
- (23) M. Gustavsson, E.Haller, M. J. Mark, J. G. Danzl, G. R. Kopeinig, H. C. Nägerl, Phys. Rev. Lett. 100, 080404 (2008).
- (24) S. Kling, T.Salger, C. Grossert, M. Weitz, Phys. Rev. Lett. 105, 215301 (2010).
- (25) B. Wu and Q. Niu, Phys. Rev. A 64, 061603(R) (2001).
- (26) B. Wu and Q. Niu, New J. Phys. 5, 104 (2003).
- (27) R. Chang, S. Potnis, R. Ramos, C. Zhuang, M. Hallaji, A. Hayat, F. Duque-Gomez, J. E. Sipe, and A. M. Steinberg, Phys. Rev. Lett. 112, 170404 (2014).
- (28) H. Pu, L. O. Baksmaty, W. Zhang, N. P. Bigelow, and P. Meystre, Phys. Rev. A 67, 043605 (2003).