Dissecting the complex environment of a distant quasar with MUSE
Abstract
High redshift quasars can be used to trace the early growth of massive galaxies and may be triggered by galaxy-galaxy interactions. We present MUSE science verification data on one such interacting system consisting of the well-studied PKS1614+051 quasar, its AGN companion galaxy and bridge of material radiating in Ly between the quasar and its companion. We find a total of four companion galaxies (at least two galaxies are new discoveries), three of which reside within the likely virial radius of the quasar host, suggesting that the system will evolve into a massive elliptical galaxy by the present day. The MUSE data are of sufficient quality to split the extended Ly emission line into narrow velocity channels. In these the gas can be seen extending towards each of the three neighbouring galaxies suggesting that the emission-line gas originates in a gravitational interaction between the galaxies and the quasar host. The photoionization source of this gas is less clear but is probably dominated by the two AGN. The quasar’s Ly emission spectrum is double-peaked, likely due to absorbing neutral material at the quasar’s systemic redshift with a low column density as no damping wings are present. The spectral profiles of the AGN and bridge’s Ly emission are also consistent with absorption at the same redshift indicating this neutral material may extend over 50 kpc. The fact that the neutral material is seen in the line of sight to the quasar and transverse to it, and the fact that we see the quasar and it also illuminates the emission-line bridge, suggests the quasar radiates isotropically and any obscuring torus is small. These results demonstrate the power of MUSE for investigating the dynamics of interacting systems at high redshift.
keywords:
galaxies: interactions - quasars: individual: PKS1614+051 - galaxies: high-redshift - techniques: imaging spectroscopy1 Introduction
The growth of galaxies and galaxy clusters can be probed using high redshift quasars to pinpoint regions of early cluster formation (e.g. Turner, 1991; Springel et al., 2005; Di Matteo et al., 2008). The rapid buildup in mass of the central supermassive black holes and host galaxies of quasars implies that they are hosted by massive dark matter haloes - themselves the likely sites of early galaxy clustering. Thus distant quasars can be used to explore the early interactions that may trigger quasar activity and lead to the growth of massive galaxies that eventually exist at the centres of present-day clustering. Observational evidence of galaxy clustering around at least a subset of high redshift quasars is now becoming apparent (e.g. Toshikawa et al., 2012; Husband et al., 2013; McGreer et al., 2014).
One of the earliest identified systems that showed evidence of interaction and clustering at high redshift is that of PKS1614+051, consisting of a radio-loud quasar and companion galaxy connected by an extended bridge of ionized gas. The emission-line companion galaxy is itself an AGN (Djorgovski et al., 1987; Bremer & Johnstone, 1995) and the bridge of gas is radiating strongly in Ly (Hu & Cowie, 1987). While not unique in having clearly extended Ly, the combination of quasar, AGN and extended Ly emission is a rare opportunity to explore the connection between a high redshift quasar and its environment. First discovered by Djorgovski et al. (1985), the brightness of the companion galaxy (significantly brighter than typical Lyman break galaxies and Ly emitters at ) and the Ly bridge allowed the system to be studied with 4-m telescopes in the 1980s and 1990s. Given the companion galaxy, some authors (e.g. Hu & Cowie, 1987) suggest it should lie in an overdense (or protocluster) environment that will evolve into a galaxy cluster by the present day.
With the advent of MUSE (Multi-Object Spectroscopic Explorer; Bacon et al., 2012) - a 1 x 1 arcmin2 field integral field unit (IFU) on the VLT (Very Large Telescope) - a more detailed study of this region is now possible. The large IFU enables continuum and emission line morphologies to be acquired as well as information about the dynamics and ionization state of the gas and galaxies, without which interpretation of the complex interaction of quasars with their environments is highly challenging. Often the close environment of a quasar is studied using rare, spatially coincident background quasars to probe individual sight lines through the halo containing the quasar. Here we show that we can probe numerous lines of sight around a quasar using the IFU capabilities of MUSE and the Ly halo of the quasar. Although already well-studied, the MUSE science verification data presented in this paper provides new information on the nature of this system.
A CDM cosmology with km s-1 Mpc-1, 0.29 and 0.71 (Bennett et al., 2014) is used throughout.
2 Observations
The data were taken as part of Science Verification with VLT/MUSE between 18 and 20th August 2014. The 1 x 1 arcmin2 field of view was first centered 15 arcsec west of PKS1614+051 and then 15 arcsec to the east. Four 880s exposures, rotated 90 deg between each, were taken at each position, giving a total exposure time of 1.96 h and spectroscopic coverage of all galaxies within 1.28 x 1 arcmin2 over a wavelength range of 4750-9350 Å . This arrangement meant that the central 30 arcsec wide North-South strip of the eventual image accrued twice the exposure time of the 15 arcsec wide eastern and western strips.
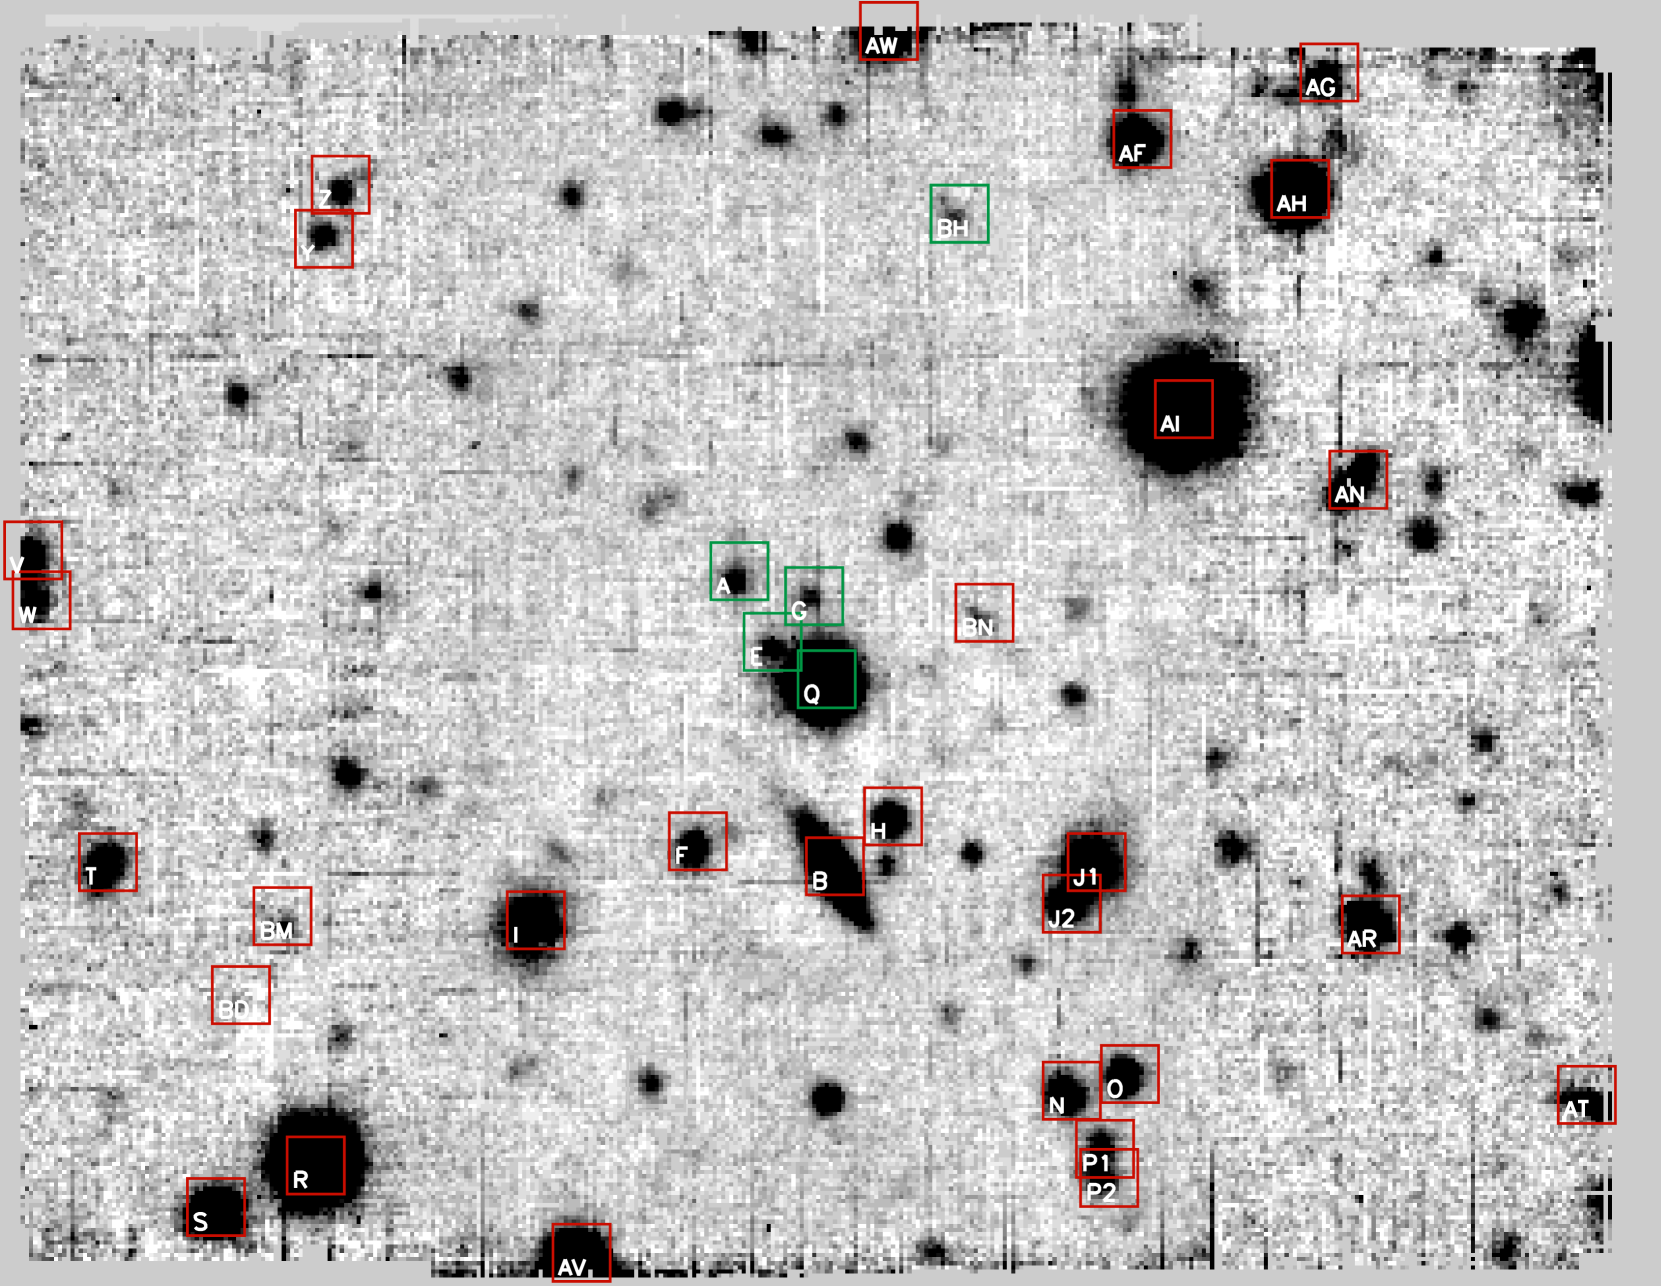
The MUSE Data Reduction Software (version 0.18.5) was used for the first reduction of the data - bias subtracting, flat fielding and calibrating the data, and aligning and constructing three dimensional data cubes. An IDL script was written to achieve a better sky subtraction than the early MUSE pipeline by fitting and subtracting a 2nd order polynomial to each spatial row (along the long axis of the IFUs) of each wavelength slice of the resulting data cubes for each of the eight exposure in order to remove the sky contribution. The resulting eight data cubes (one for each of the four rotations at two separate pointings) were mean-combined with cosmic ray rejection (sigma clipping) and the median of the entire frame at each wavelength bin subtracted to remove any remaining residual from the sky subtraction. Images were constructed from the data cubes by collapsing the spectral axis over defined wavelength ranges. A further median subtraction was done to each row of each individual IFU for every exposure and then these were combined with a bad pixel mask and sigma clipping to produce the final white-light image (see Fig. 1).
The RMS noise in the final data cube is erg s-1 cm−2 per 1.25 Å wavelength bin, at 5150 Å and in the center of the data cube. The RMS noise is a factor of worse in the two 15 arcsec wide strips on the east and west of the image where the total exposure time is half that of the middle and the noise is up to 50 per cent lower in the middle of the wavelength range around 7000 Å. The 2 depth, within 2 arcsec diameter apertures, of the white light, full range (4750-9350 Å) stacked image is 26.4 AB. The FWHM velocity resolution is measured from the sky lines to be 2.7 Å or equivalently 150 km s-1 at and the spatial FWHM of the final white light image is 0.9 arcsec. The pixel scale of MUSE is 0.2 arcsec (pixel)-1.
The final white light image is shown in Fig. 1. We use SExtractor (Bertin & Arnouts, 1996) followed by a visual check to identify 119 objects in our white-light image, of which 60 are brighter than AB (see Table 1). We also checked the entire data cube for emission lines but only one additional object was found. This is unsurprising as any emission line only object would have an extremely high equivalent width and likely a very red or very blue spectrum in order for the continuum to remain undetected. The only other object with undetected continuum is the Ly bridge indicating it has a very large rest-frame equivalent width (60 Å using the 2 limit on the spectrum in the wavelength range 5090-5190 Å near the Ly emission or 180 Å using the 2 limit on the full range white light image shown in Fig. 1) that is unlikely to be powered by embedded star formation in the bridge (the maximum equivalent width from star forming regions is 240 Å; Hennawi & Prochaska, 2013; Charlot & Fall, 1993). Analysis of both emission lines, absorption lines and comparison with Sloan Digital Sky Survey (SDSS) galaxy and stellar templates results in redshifts for 34 galaxies (Table 1), of which four are at the redshift of the quasar (within ). We are sensitive to Ly flux densities of greater than erg s-1 cm-2 Å-1 at the redshift of the quasar, determined by collapsing a 100 Å wide section of the data cube around 5120 Å over the wavelength axis. In addition, we found no convincing Lyman break galaxies (LBGs) without Ly emission when we compared stacked images above and below potential Ly breaks at 20 Å intervals over the full wavelength range.
| ID | RA | Dec | Redshift | Classification |
|---|---|---|---|---|
| Q | 16:16:37.56 | 04:59:32.1 | 3.212 | Quasar |
| A | 16:16:37.83 | 04:59:37.1 | 3.214 | LAE/NLAGN1 |
| B | 16:16:37.52 | 04:59:22.9 | 0.507 | Spiral galaxy |
| E | 16:16:37.72 | 04:59:33.8 | 3.215 | LAE |
| F | 16:16:37.97 | 04:59:24.0 | 0.67 | Galaxy |
| G | 16:16:37.59 | 04:59:36.2 | 3.215 | LAE |
| H | 16:16:37.34 | 04:59:25.4 | 0.000 | M star |
| I | 16:16:38.49 | 04:59:20.5 | 0.143 | Galaxy |
| J1 | 16:16:36.69 | 04:59:23.3 | 0.53 | Early-type galaxy |
| J2 | 16:16:36.77 | 04:59:21.3 | 0.615 | Luminous red galaxy |
| L | 16:16:38.11 | 04:59:12.8 | 3.098 | LBG/LAE |
| N | 16:16:36.77 | 04:59:12.3 | 1.089 | Galaxy or |
| Interacting galaxies | ||||
| O | 16:16:36.58 | 04:59:13.1 | 0.000 | M Star |
| P1 | 16:16:36.66 | 04:59:09.5 | 0.608 | Galaxy |
| P2 | 16:16:36.65 | 04:59:08.1 | 0.608 | Galaxy |
| R | 16:16:39.20 | 04:59:08.7 | 0.000 | Star |
| S | 16:16:39.52 | 04:59:06.7 | 0.402 | Galaxy |
| T | 16:16:39.87 | 04:59:23.3 | 0.905 | Galaxy |
| V | 16:16:40.11 | 04:59:38.3 | 0.71 | Galaxy |
| W | 16:16:40.08 | 04:59:35.9 | 0.16 | Galaxy |
| Y | 16:16:39.17 | 04:59:53.3 | 1.470 | Galaxy |
| Z | 16:16:39.12 | 04:59:55.9 | 0.000 | M star |
| AF | 16:16:36.54 | 04:59:58.1 | 0.000 | M star |
| AG | 16:16:35.94 | 05:00:01.3 | 1.213 | Galaxy |
| AH | 16:16:36.03 | 04:59:55.7 | 0.833 | Galaxy |
| AI | 16:16:36.40 | 04:59:45.1 | 0.000 | Star |
| AR | 16:16:35.80 | 04:59:20.3 | 0.629 | Galaxy |
| AT | 16:16:35.11 | 04:59:12.1 | 0.549 | Spiral galaxy |
| AV | 16:16:38.34 | 04:59:04.5 | 0.000 | Star |
| AW | 16:16:37.35 | 05:00:03.3 | 0.000 | M star |
| BD | 16:16:39.44 | 04:59:16.9 | 0.143 | Galaxy |
| BH | 16:16:37.13 | 04:59:54.5 | 3.217 | LAE |
| BM | 16:16:39.31 | 04:59:20.7 | 0.853 | Galaxy |
| BN | 16:16:37.05 | 04:59:35.3 | 1.050 | Galaxy |
3 Results
The capabilities of MUSE are clearly demonstrated in this data - with just two hours of observations we can identify galaxies at the same redshift as the quasar across the 1 arcmin2 field of view and probe in detail the region close to the quasar containing PKS1614, its AGN companion, the emission line bridge and any other potential companion galaxies.
3.1 Galaxy Environment of PKS1614
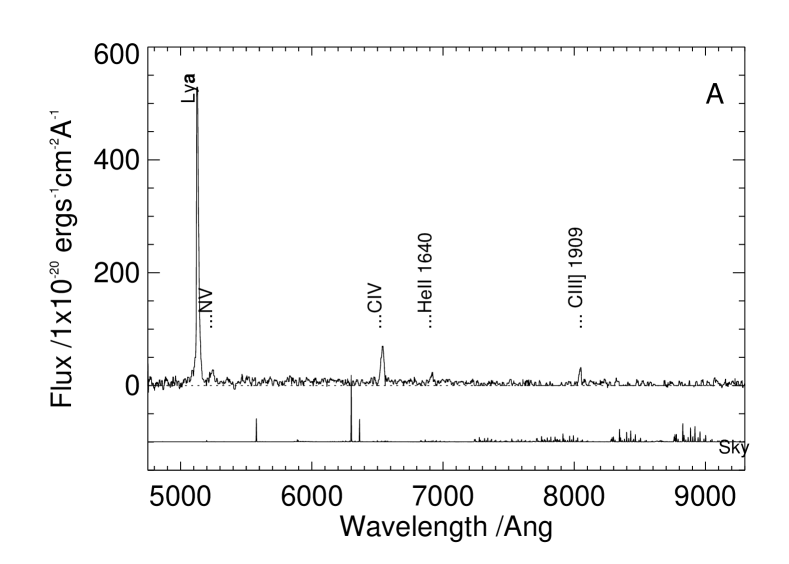
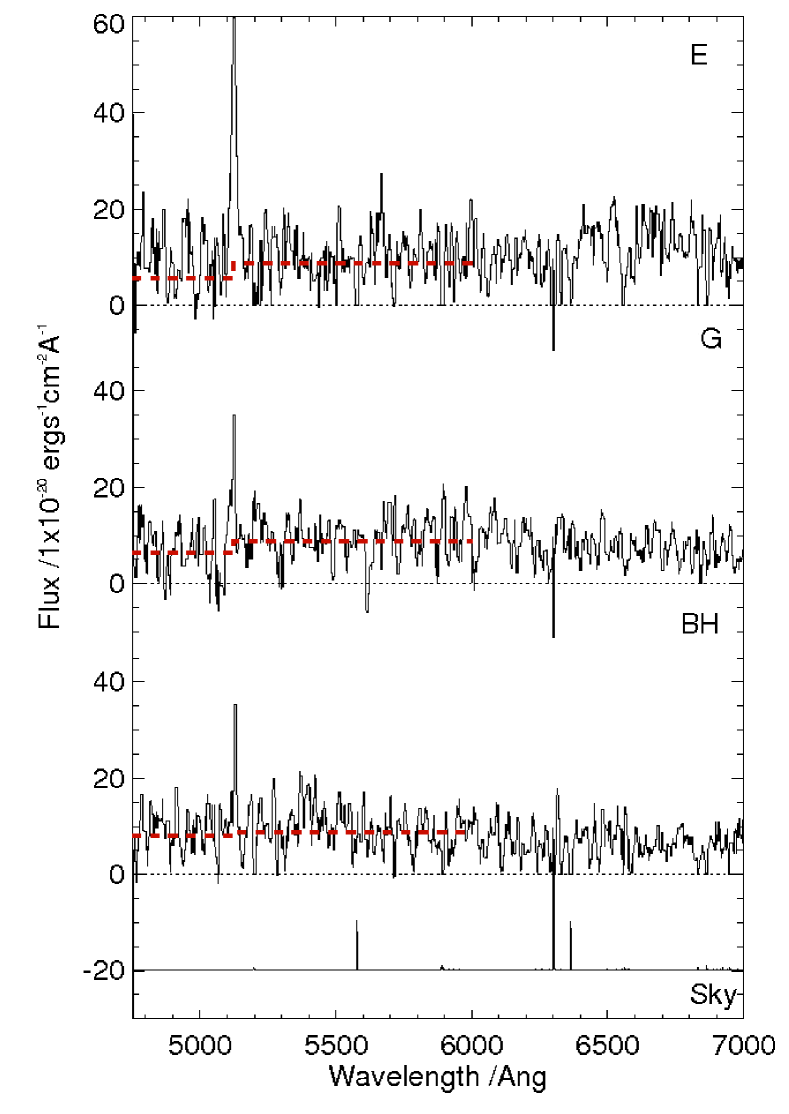
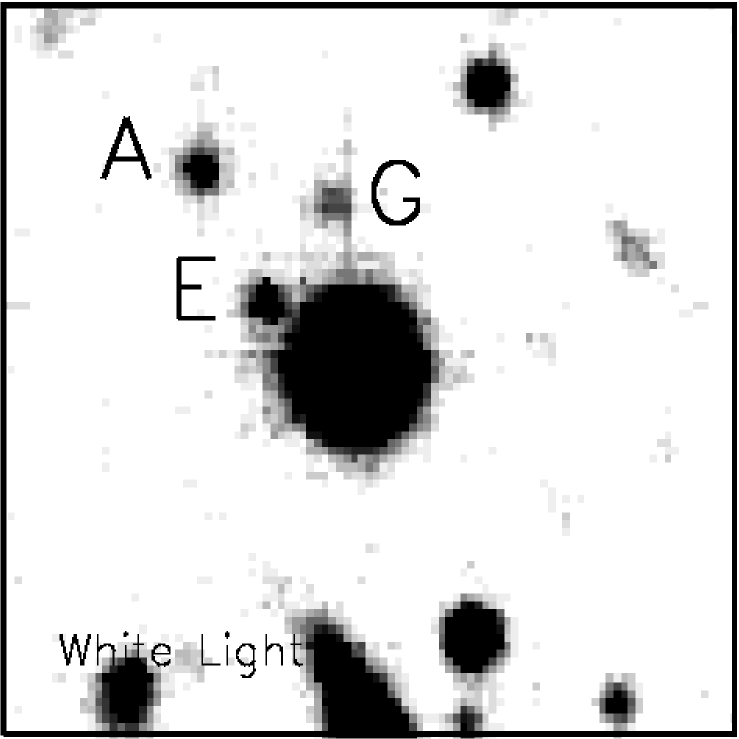
The PKS1614+051 quasar has at least four companion galaxies: the previously known narrow line AGN A, galaxy E - hitherto identified as a candidate Ly emitter (LAE) based on narrow-band imaging (Hu & Cowie, 1987; Hu et al., 1991) - and two new LAEs/LBGs: G and BH. For these newly identified sources, we extend the galaxy labeling scheme of Hu & Cowie (1987) but we do not find galaxies at the positions of their C and D objects. The spectra of these companion galaxies are shown in more detail in Fig. 2 & 3.
Three of the companion galaxies (A, E and G) are close enough to be interacting with the quasar as defined by Ellison et al. (2008) and are within the expected virial radius of the quasar’s host dark matter halo suggesting they will eventually merge with the quasar host to form a massive elliptical galaxy (perhaps at the centre of a group or cluster) by the present day. Although the spectrum of E may be affected by scattered light from the quasar, its broad-band photometry is consistent with a Lyman break and its Ly line is significantly narrower than the quasar’s, suggesting it is a separate galaxy. E is unlikely to be driven solely by fluorescence from the quasar (e.g. Cantalupo et al., 2005; Kollmeier et al., 2010) as the presence of continuum emission suggests star formation can create the Ly emission (the rest-frame equivalent width is only 15 Å). The companion galaxies are all cleanly separated from the quasar demonstrating the excellent spatial sampling of the MUSE data.
In total, we confirm five galaxies including the quasar host within an area of 20 by 25 arcsec by or a maximum co-moving volume of 1.4 co-moving Mpc3, ignoring peculiar velocities i.e. assuming the difference in redshift represents the Hubble expansion.
| ID | zpeak | zsys | zfit | Ly flux | Ly Luminosity | Ly Vel. Dispersion | R Abs. Mag. |
|---|---|---|---|---|---|---|---|
| /10-20 erg s-1 cm-2 | /1043 erg s-1 | /km s-1 | /mag | ||||
| Q | 3.215 | 3.212 | 3.215 | 616720 | 58.8 | 920 | -28.1 |
| A | 3.215 | 3.214 | 3.215 | 33260 | 3.18 | 400 | -23.0 |
| E | 3.215 | na | 3.215 | 3960 | 0.035 | 260 | -23.2 |
| G | 3.215 | na | 3.211 | 1080 | 0.103 | 190 | -22.7 |
| BH | 3.217 | na | 3.217 | 773 | 0.074 | 130 | -22.9 |
| Bridge | 3.215 | na | 3.214 | 10940 | 1.989 | 250 | -21.0 |
3.2 Gaseous Environment
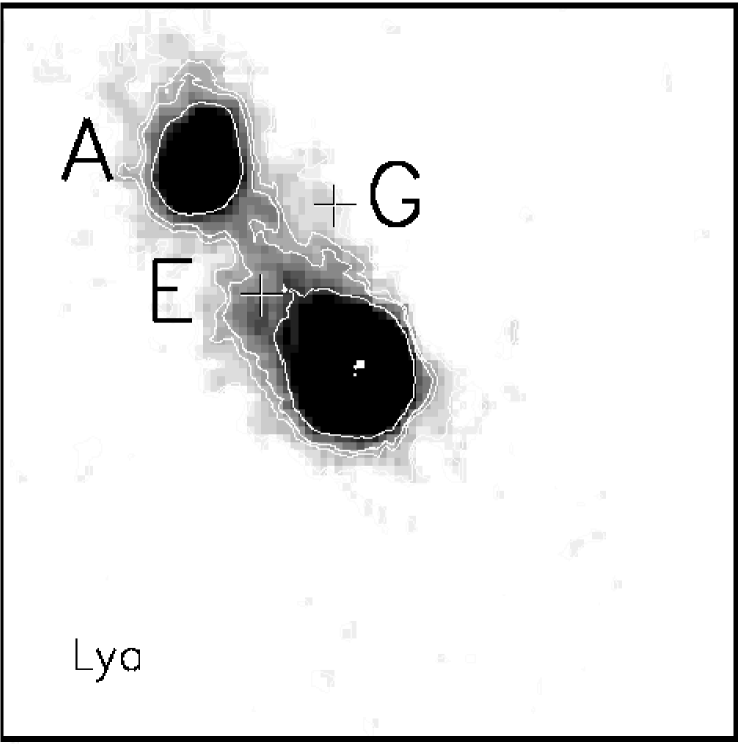
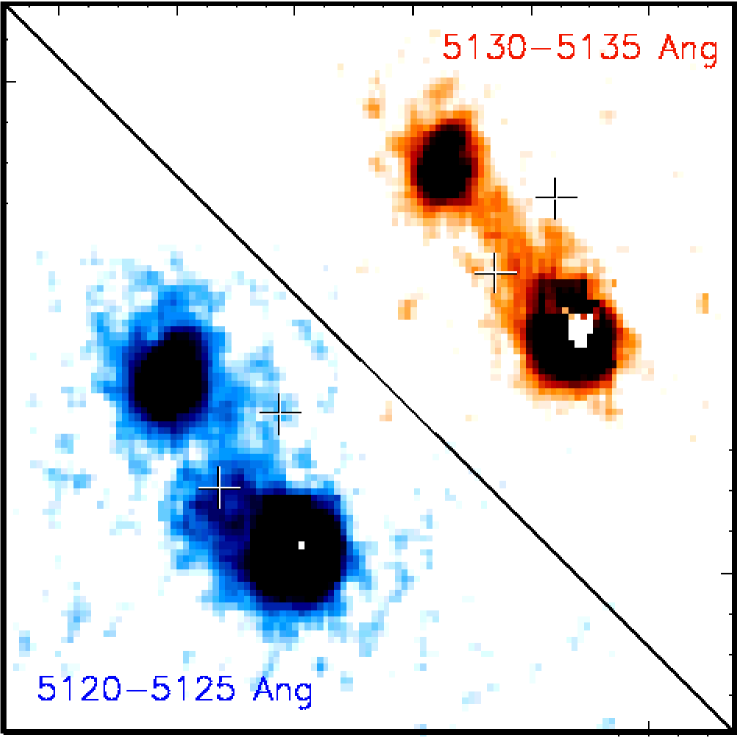
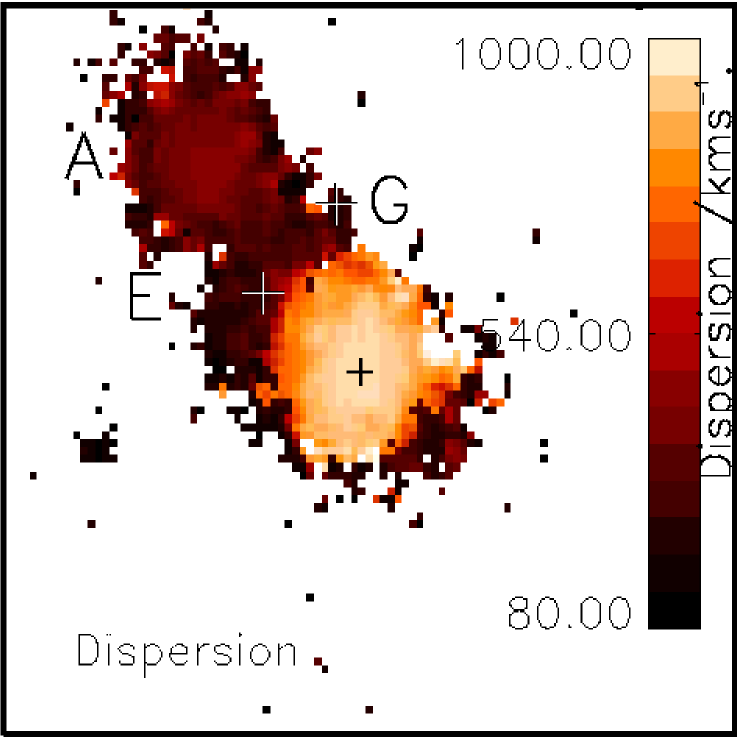
We have obtained a detailed, high signal-to-noise spectrum of the quasar, companion A and, for the first time, the emission line bridge. Fig. 4 shows the distribution of gas in the central region around the quasar. The emission line bridge extends over 50 physical kpc from A to the quasar and slightly beyond the quasar in the other direction (Fig. 4b), with a width of around 10 kpc. Fig. 4c shows the red-most and blue-most (5 Å wide or 300 km s-1) components of the Ly line, showing how the high surface brightness emission connects the quasar to companion A and also extends towards the two other nearby galaxies (E and G), denoted by crosses. Fig. 4d shows the dispersion of the Ly line as a function of position, found from fitting a Gaussian to the Ly line in each spatial pixel. The Ly emission from the bridge has a relatively low dispersion, as does the Ly emission from companions E and G, whilst the emission from the quasar and companion A have larger velocity dispersions as expected for active galaxies (see Table 2).
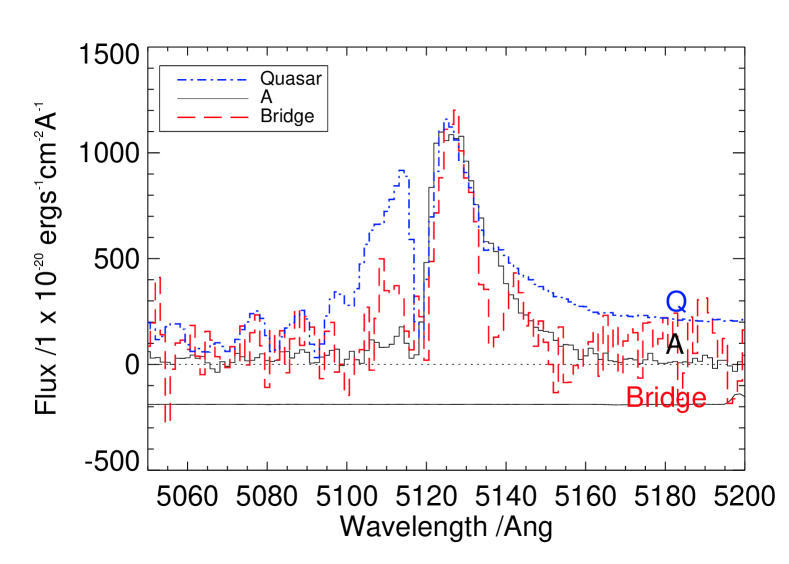
The spectrum of the quasar’s Ly emission is strongly double-peaked with the central gap having a rest-frame equivalent width of 1.1 Å and the flux declining to almost zero at the central wavelength of the line. If this is due to an absorption system the velocity width, b, is 18015 km s-1 and this implies a low column density of () x 1013 cm-2 using a curve of growth analysis and assuming a covering fraction of 100 per cent, as expected for an unsaturated absorption profile without damping wings. This potential absorbing material is at the systemic redshift of the quasar (as derived from other lines e.g. HeII, CIV) suggesting that the emission arises from neutral material in or around the quasar. The spectra of A and the bridge are also consistent with being affected by the same absorbing material. Their spectral profiles display a similar sharp cutoff on the blue-ward edge as the quasar’s Ly profile (Fig. 5), although the underlying Ly emission lines in A and the bridge are narrower and appear to peak at slightly longer wavelengths than the quasar Ly emission line.
We see no other emission lines arising from the bridge, placing a constraint on the CIV/Ly and HeII/Ly flux ratios of and (3), significantly below the ratios for the quasar and companion A where CIV and HeII was detected. This implies a lower ionization parameter for the bridge than that typically seen from an AGN (see discussion section below).
4 Discussion
4.1 Protocluster or Protogalaxy Environment
PKS1614+051 lies in a galaxy overdensity of at least five galaxies (including itself) within a volume of no more than 1.4 co-moving Mpc3, demonstrating that MUSE is clearly capable of identifying clustering and potential protoclusters at . At this redshift, MUSE allows for little spectral coverage below the 1216 Å Ly break. Given the relative weakness of this break at when compared to higher redshifts, and the low signal to noise obtained on the continuum of faint sources at short wavelengths, it will be easier to use MUSE to search for Lyman break galaxies at higher redshifts than that probed here.
The majority (3/4) of the companion galaxies are within a 50 kpc of the quasar, and hence well within its expected virial radius ( 280 kpc; Cantalupo et al., 2014), suggesting that they will merge with the quasar to form a massive elliptical galaxy by . If this is the progenitor of the massive galaxies seen at then the merger needs to be completed within 2.5 Gyr.
At this redshift we expect protoclusters to extend over radii of 2-5 arcmin (Chiang et al., 2013). As MUSE only probes 1 arcmin2 we can draw limited conclusions about the wider protocluster environment of PKS1614. Nevertheless, with one companion galaxy outside its virial radius and three within, the quasar is highly likely to reside in an overdense environment likely to evolve into a group or cluster. We note that with another eight similar pointings - in total 18 hours of MUSE time - the environment of the system could be probed in detail on the scale of an ACS or WFC3 HST image, better matched to the expected scale of overdense regions.
4.2 Gaseous Interactions
High redshift radio loud quasars and galaxies are often observed to have extended Ly haloes surrounding them, spanning 10s-100s of kpc (e.g. Heckman et al., 1991b; Christensen et al., 2006; Villar-Martín et al., 2007) with line widths of 100-1500 km s-1 (Heckman et al., 1991a). The photoionization of the gas is often attributed to radiation escaping along the radio axis of the galaxy, although fainter extended Ly haloes are seen around compact radio galaxies (e.g. van Ojik et al., 1997) and around some radio-quiet quasars (e.g. Christensen et al., 2006; Herenz et al., 2015). Many of the extended emission line regions around radio galaxies ( 60 per cent) and in particular those around the smallest ( kpc sized) radio sources such as PKS1614+051, have associated HI absorption (van Ojik et al., 1997). Indeed % of the 74 quasars studied by Prochaska et al. (2013b) were found to have nearby ( kpc) neutral material absorbing photons from a spatially coincident background quasar. Assuming the quasar is at the centre of a similar large-scale diffuse, high filling factor neutral halo, the picture we favour to explain the observed distribution of gas around PKS1614+051 is as follows: Embedded within this diffuse halo are also the companion galaxies A, E and G and the bridge of denser, lower filling factor emission-line gas. This gas phase originates from material extracted from the companions and quasar host through mutual gravitational interactions and is ionized by AGN and/or stellar emission. Below we discuss the evidence in favour of this picture.
The gas in the bridge is aligned between the quasar and companion A, and may extend slightly beyond A and the quasar along the same axis. Fig. 4c shows the distribution of the red-most and blue-most component of the Ly bridge gas. There is a comparatively narrow stream of gas connecting the quasar to companion A, with a wavelength similar to the Ly peak wavelength of A, suggesting the two galaxies are gravitationally interacting. The bridge also seems to extend towards galaxies E and G (marked by crosses), giving it its broad appearance in the full-width Ly image and indicating that these galaxies may also be interacting with the bridge and/or quasar.
Unlike many powerful high redshift radio sources, in this case there is no obvious spatial relationship between the radio emission and the extended emission-line region. Radio observations of the quasar indicate that it is a gigahertz peaked source with the bulk of the radio emission arising from a milli-arcsec scale region. The source’s radio jet originates from the quasar in a south-westerly direction before turning through 90 degrees to the north-west again on sub arcsec scales (Djorgovski et al., 1987; Orienti et al., 2006) and hence the extended emission line region is probably aligned with the counter-jet axis, albeit on scales two or more orders of magnitude larger than that of the radio emission. However, the lack of similarly extended emission in the south-westerly direction suggest the radio-jet is not the primary cause of the emission-line bridge.
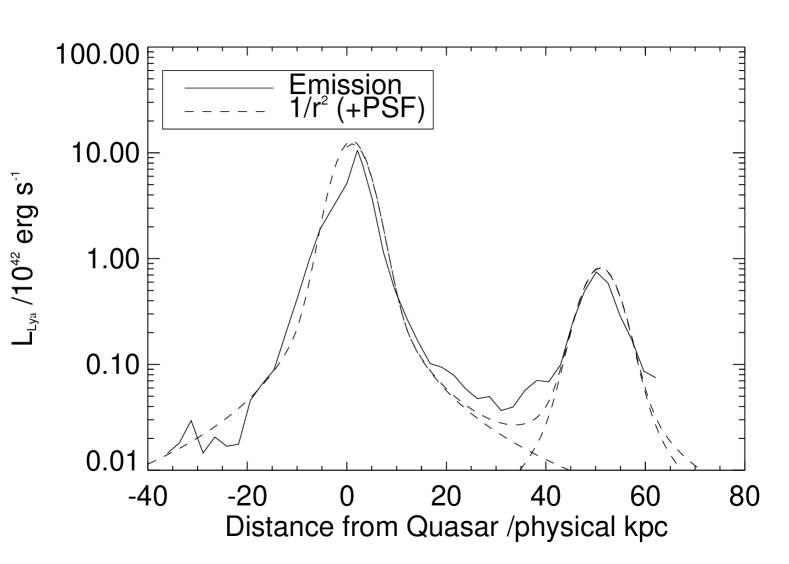
The only emission line detected from the gas in the bridge is Ly, placing strong constraints on the ratio of CIV/Ly and HeII/Ly. The lack of HeII suggests a relatively low ionization parameter, unlike that seen in gas coincident with jets in radio galaxies, whereas the lack of CIV emission suggests the gas is not hot enough to ionize CIV. Although gas near AGN typically has a high ionization parameter, low ionization parameter gas may arise at greater distances from the AGN where the photon field is more diffuse, particularly if the ionizing photons have already passed through a cloudy medium (e.g. Arrigoni Battaia et al., 2015). The majority of ionizing photons exciting the bridge emission probably emanate from the quasar and the AGN within companion A as the Ly surface brightness rises towards both (Fig. 6), although the exact form of the surface brightness profile will depend on the optical thickness and density distribution of the gas in the bridge. The large line width of Ly suggests the bridge emission is not due to gravitational cooling, although gravitational cooling would produce little or no HeII and CIV (Yang et al., 2006), and the Ly emission is unlikely to arise from shocks as this would result in a higher fraction of CIV compared to Ly than that seen here (Heckman et al., 1991a). The line ratios are consistent with photoionization from stars (Prescott et al., 2009), although the Ly equivalent width limit of the bridge is too high for the ionization source to be solely stellar (the equivalent width limit only allows for ionization from massive, young O stars and such a strong star burst would be a very short lived phenomenon making this an unlikely scenario). However, a more typical stellar population could provide some fraction of the ionizing photons along with ionizing photons from the two AGNs. Alternatively, the observed line ratios could just be an effect of the resonant properties of Ly whereby Ly will resonantly scatter out to larger distances from the quasar than non-resonant HeII (Arrigoni Battaia et al., 2014). However, this may not be a dominant effect as the photons that resonantly scatter are likely to escape the system on much smaller scales (Arrigoni Battaia et al., 2015; Verhamme et al., 2006; Cantalupo et al., 2005).
The double peaked Ly profile of companion A, the quasar and the bridge (Fig. 5) may be indicative of a surrounding absorbing large neutral gas cloud or halo, as is commonly found around other quasars (e.g. Hennawi et al., 2006; Prochaska et al., 2013a, at similar redshifts). The absorption in all three components is at the same wavelength and goes nearly completely black implying that the absorbing material is separate to the emitting material rather than mixed in with it. This absorbing neutral halo has a radius kpc centered on the quasar and hence a mass of at least 2 x 10³ M⊙ (using the column density estimate above). The column density of neutral material in this halo could be significantly higher than estimated above if in addition to the low column density material there are regions of high column density gas with lower covering fractions. These higher density clumps would likely emit Ly photons given that they are probably optically thick clouds within the ionizing field of the quasar and the companion AGN. However, we do not detect a symmetric Ly halo centered on the quasar, as opposed to the asymmetric bridge emission, suggesting the mass in higher density clumps is significantly less than that in the bridge. In terms of Ly absorption, the quasar’s environment is consistent with the typical environment of high redshift quasars characterised by Prochaska et al. (2013a). For the bridge and A to show similar absorption they would most likely have to be observed through a significant fraction of the absorbing halo, of a comparable column density to that affecting the quasar line of sight.
Although radiative transfer effects can also produce double peaked Ly emission in optically thick gas clouds (Cantalupo et al., 2005; Kollmeier et al., 2010), it seems improbable that this is the case here as the absorption wavelength is the same across the entirety of the bridge, quasar and companion A whilst the underlying Ly emission profile changes significantly. Radiative transfer effects are unlikely to produce a double-peaked profile along the line-of-sight to the quasar, a point-source, and so the profile here most likely arises from multi-phase gas that includes neutral gas clouds in front of the quasar. The fact that the absorption profile directly in front of the quasar is so similar to that across the rest of the system - there are no discontinuities in the absorption wavelength - is highly suggestive that the quasar line-of-sight is probing the same relative distribution of material as the line-of-sight to the bridge. Indeed we see no other absorption lines in the quasar spectrum indicating that this covering neutral gas must have a low column density, consistent with the low column density estimate derived earlier assuming the quasar’s double-peaked profile arises from absorbing material rather than radiative transfer effects.
The PKS1614+051 system is similar to that of SDSSJ0841+3921 and its three companion AGN that are also embedded within an extended Ly halo, although at slightly lower redshift (Hennawi et al., 2015). However, there is no evidence of merging activity or interaction in the SDSSJ0841 system and the Ly spectral profiles from the quasar and extended nebula are not double-peaked, suggesting there is just one component of (multi-phase) gas present, unlike PKS1614+051 that seems to have additional ISM-like material inbetween the galaxies. The neutral halo surrounding PKS1614+051 may well fluoresce in Ly in a similar manner to SDSSJ0841+3921 but at a lower surface brightness than our detection limit.
Although the picture we put forward here fits with all the data it is not necessarily the only interpretation. These results are achieved with only 2 hrs of exposure. A significantly longer observation with MUSE would increase the signal-to-noise on the extended Ly emission line allowing the spatial and velocity structure of the bridge to be determined in more detail, and potentially detect other emission lines from the bridge, allowing a plausible model of the photoionization source(s) to be put forward. Additionally, observations of OII, OIII and H with JWST/NIRSPEC in the future would allow the metallicity and ionization parameter of the gas to be determined, potentially constraining the origin of the gas.
As noted above, recent work on the gaseous environments of quasars, in particular the extent of surrounding neutral haloes, has used background probes (e.g. a quasar, Hennawi et al., 2006; Prochaska & Hennawi, 2009; Prochaska et al., 2013b) to explore the extent of neutral gas in the target quasar’s environment. The potential advantages of the approach used here in addition to the use of a background probe is that MUSE can allow a search for absorption against the extended emission on 10s kpc scales, allowing the whole region to be explored rather than just a single sight line. The probability of identifying a background probe at small projected distance for a quasar decreases as (radius)-2 so the approach used here can also better sample the haloes at small radii. Clearly there is potential for observing a sample of quasars with extended Ly emission with MUSE in order to explore the small scale quasar environment. This is particularly important as Prochaska et al. (2013a) find an anisotropic distribution of NHI absorbers around quasars, with more absorbing clouds than expected found around the quasar than in its line of sight (the proximity effect), that they attribute to the quasar emitting anisotropically - clouds along its line of sight are photo-evaporated but those transverse to it are exposed to less radiation and survive. We see the Ly absorption in PKS1614 across the whole of the quasar and companion system suggesting that this quasar is radiating relatively isotropically. In addition, given that we see the bridge and both AGNs, and the bridge must lie mainly in the plane of the sky or its true extent becomes improbably large, the opening angle for AGN emission in both A and the quasar must be large and any obscuring torus small.
The profile of the Ly absorption is symmetric around the quasars systemic velocity suggesting it is not associated with any inflow or outflow of material. If material was in-flowing or out-flowing it would need to be continually replenished or destroyed, or be a short lived phenomenon, as the amount of absorber material is relatively small ( 2 x 10³ M⊙). Instead we postulate this neutral material sits spherically around the quasar within its dark matter halo and (some of) its large velocity width comes from the fact that these clouds are moving within the gravitational potential of the halo. It is clear that MUSE, with its large IFU coverage, provides an excellent dataset to probe the quasar’s environment over an extended region, including providing important constraints on the properties of its halo gas.
5 Conclusions
We find that the quasar PKS1614+051, with its companion active galaxy and connecting bridge of Ly emitting gas, is surrounded by three other Ly emitting galaxies, two of which are very close to or within the bridge of material. This overdensity of four galaxies, all within 300 km s-1 of each other and within the virial radius of the quasar, will likely merge to form a massive elliptical galaxy by , perhaps residing within a group or cluster of galaxies.
The 50 kpc long bridge of Ly emitting gas stretches between the quasar and companion galaxy A and also extends towards the two other nearby companion galaxies, suggesting that the gas was pulled out from the galaxies during a gravitational interaction between them and the quasar host. The emission line bridge is likely to be predominantly photoionized by the quasar and its AGN companion as its surface brightness rises towards them both, although the lack of CIV or HeII in the bridge suggests a relatively low ionization parameter. The quasar’s Ly line is strongly double-peaked, likely due to absorption by a neutral halo of gas at the systemic velocity of the quasar extending at least 50 kpc in radius with a mass of at least 2 x 10³ M⊙. The Ly bridge is probably a separate phase to the much larger neutral halo surrounding the quasar, which it is embedded in, as the Ly absorption profile goes nearly completely black indicating virtually all of the Ly photons at that wavelength have been scattered out of the line of sight. In addition, we must be looking at the system through a significant path length of neutral material to see similar absorption across the entire system. This picture of the quasar, bridge and companion galaxies embedded in a large neutral halo is consistent with the absorption systems commonly found around quasars using a background quasar as a probe by e.g. Prochaska et al. (2013a). The fact that we see the bridge and both of the AGNs, and that we see neutral material in both the line of sight to the quasar and transverse to it, suggests the quasar is emitting isotropically and any obscuring torus obstructs only a small solid angle as seen from the nucleus.
The large field of the MUSE IFU allows the exploration of the quasar environments on a wide range of scales. The clustering of galaxies at the quasar redshift can be studied simultaneously with the small-scale exploration of the quasar’s gaseous environment using Ly absorption of faint sources in the immediate environment. This use of self-absorption, rather than using a rare background quasar to probe a single line of sight, is a potentially powerful technique for exploring the close environments of quasars, given the prevalence of extended Ly emission.
This work demonstrates the effectiveness and efficiency of MUSE for elucidating the observational details of galaxy interactions and growth at high redshift. While a single pointing can explore the early growth of clustering, minimal tiling of several MUSE pointings should ideally sample the larger-scale protocluster environment at these redshifts.
6 Acknowledgments
KH acknowledges funding from STFC. Based on observations made with ESO telescopes at the La Silla Paranal Observatory under programme ID 60.A-9323(A). We thank all the staff at Paranal Observatory for their valuable support during the commissioning of MUSE.
References
- Arrigoni Battaia et al. (2015) Arrigoni Battaia F., Hennawi J. F., Prochaska J. X., Cantalupo S., 2015, ArXiv e-prints
- Arrigoni Battaia et al. (2014) Arrigoni Battaia F., Yang Y., Hennawi J. F., Prochaska J. X., Matsuda Y., Yamada T., Hayashino T., 2014, ArXiv e-prints
- Bacon et al. (2012) Bacon R. et al., 2012, The Messenger, 147, 4
- Bennett et al. (2014) Bennett C. L., Larson D., Weiland J. L., Hinshaw G., 2014, ApJ, 794, 135
- Bertin & Arnouts (1996) Bertin E., Arnouts S., 1996, A&AS, 117, 393
- Bremer & Johnstone (1995) Bremer M. N., Johnstone R. M., 1995, MNRAS, 277, L51
- Cantalupo et al. (2014) Cantalupo S., Arrigoni-Battaia F., Prochaska J. X., Hennawi J. F., Madau P., 2014, Nature, 506, 63
- Cantalupo et al. (2005) Cantalupo S., Porciani C., Lilly S. J., Miniati F., 2005, ApJ, 628, 61
- Charlot & Fall (1993) Charlot S., Fall S. M., 1993, ApJ, 415, 580
- Chiang et al. (2013) Chiang Y.-K., Overzier R., Gebhardt K., 2013, ApJ, 779, 127
- Christensen et al. (2006) Christensen L., Jahnke K., Wisotzki L., Sánchez S. F., 2006, A&A, 459, 717
- Di Matteo et al. (2008) Di Matteo T., Colberg J., Springel V., Hernquist L., Sijacki D., 2008, ApJ, 676, 33
- Djorgovski et al. (1985) Djorgovski S., Spinrad H., McCarthy P., Strauss M. A., 1985, ApJ, 299, L1
- Djorgovski et al. (1987) Djorgovski S., Strauss M. A., Spinrad H., McCarthy P., Perley R. A., 1987, AJ, 93, 1318
- Ellison et al. (2008) Ellison S. L., Patton D. R., Simard L., McConnachie A. W., 2008, AJ, 135, 1877
- Heckman et al. (1991a) Heckman T. M., Lehnert M. D., Miley G. K., van Breugel W., 1991a, ApJ, 381, 373
- Heckman et al. (1991b) Heckman T. M., Miley G. K., Lehnert M. D., van Breugel W., 1991b, ApJ, 370, 78
- Hennawi & Prochaska (2013) Hennawi J. F., Prochaska J. X., 2013, ApJ, 766, 58
- Hennawi et al. (2006) Hennawi J. F. et al., 2006, ApJ, 651, 61
- Hennawi et al. (2015) Hennawi J. F., Prochaska J. X., Cantalupo S., Arrigoni-Battaia F., 2015, ArXiv e-prints
- Herenz et al. (2015) Herenz E. C., Wisotzki L., Roth M., Anders F., 2015, A&A, 576, A115
- Hu & Cowie (1987) Hu E. M., Cowie L. L., 1987, ApJ, 317, L7
- Hu et al. (1991) Hu E. M., Songaila A., Cowie L. L., Stockton A., 1991, ApJ, 368, 28
- Husband et al. (2013) Husband K., Bremer M. N., Stanway E. R., Davies L. J. M., Lehnert M. D., Douglas L. S., 2013, MNRAS, 432, 2869
- Kollmeier et al. (2010) Kollmeier J. A., Zheng Z., Davé R., Gould A., Katz N., Miralda-Escudé J., Weinberg D. H., 2010, ApJ, 708, 1048
- McGreer et al. (2014) McGreer I. D., Fan X., Strauss M. A., Haiman Z., Richards G. T., Jiang L., Bian F., Schneider D. P., 2014, AJ, 148, 73
- Orienti et al. (2006) Orienti M., Dallacasa D., Tinti S., Stanghellini C., 2006, A&A, 450, 959
- Prescott et al. (2009) Prescott M. K. M., Dey A., Jannuzi B. T., 2009, ApJ, 702, 554
- Prochaska & Hennawi (2009) Prochaska J. X., Hennawi J. F., 2009, ApJ, 690, 1558
- Prochaska et al. (2013a) Prochaska J. X. et al., 2013a, ApJ, 776, 136
- Prochaska et al. (2013b) Prochaska J. X., Hennawi J. F., Simcoe R. A., 2013b, ApJ, 762, L19
- Springel et al. (2005) Springel V. et al., 2005, Nature, 435, 629
- Toshikawa et al. (2012) Toshikawa J. et al., 2012, ApJ, 750, 137
- Turner (1991) Turner E. L., 1991, AJ, 101, 5
- van Ojik et al. (1997) van Ojik R., Roettgering H. J. A., Miley G. K., Hunstead R. W., 1997, A&A, 317, 358
- Verhamme et al. (2006) Verhamme A., Schaerer D., Maselli A., 2006, A&A, 460, 397
- Villar-Martín et al. (2007) Villar-Martín M., Sánchez S. F., Humphrey A., Dijkstra M., di Serego Alighieri S., De Breuck C., González Delgado R., 2007, MNRAS, 378, 416
- Yang et al. (2006) Yang Y., Zabludoff A. I., Davé R., Eisenstein D. J., Pinto P. A., Katz N., Weinberg D. H., Barton E. J., 2006, ApJ, 640, 539