Present address: ]Department of Physics, Stockholm University, Stockholm, SwedenAlso with ]Coimbra Engineering Institute, Coimbra, PortugalPresent address: ]Department of Physics, University of California, San Diego, CA, USAPresent address: ]IFIC, CSIC-Universidad de Valencia, Valencia, Spain
The XENON Collaboration
Search for Event Rate Modulation in XENON100 Electronic Recoil Data
Abstract
We have searched for periodic variations of the electronic recoil event rate in the keV energy range recorded between February 2011 and March 2012 with the XENON100 detector, adding up to 224.6 live days in total. Following a detailed study to establish the stability of the detector and its background contributions during this run, we performed an un-binned profile likelihood analysis to identify any periodicity up to 500 days. We find a global significance of less than for all periods suggesting no statistically significant modulation in the data. While the local significance for an annual modulation is , the analysis of a multiple-scatter control sample and the phase of the modulation disfavor a dark matter interpretation. The DAMA/LIBRA annual modulation interpreted as a dark matter signature with axial-vector coupling of WIMPs to electrons is excluded at .
pacs:
95.35.+d, 14.80.Ly, 29.40.-n,The XENON100 experiment Aprile:2012instr is designed to search for dark matter in the form of Weakly Interacting Massive Particles (WIMPs) Bertone:2005theory by detecting WIMP-induced nuclear recoils (NRs) with a liquid xenon (LXe) time projection chamber. The resulting event rate in any dark matter detector is expected to be annually modulated due to the relative motion between the Earth and the dark matter halo of the Milky Way Freese:2012modulation . The modulation of the low energy (low-E), () keV, event rate in the DAMA/LIBRA experiment Bernabei:dama is currently the only long-standing claim for a positive dark matter detection. Under typical astrophysical and particle physics assumptions, this claim is however challenged by the non-observation of WIMP-induced NRs of several other experiments using different target materials and detector technologies (e.g. Aprile:2012run10, ; Agnese:cdmslowe, ; Akerib:lux, ), most with considerably lower radioactive backgrounds.
An alternative explanation is that the DAMA/LIBRA annual modulation is due to electronic recoils (ERs) from WIMPs which have axial-vector couplings to electrons Kopp:leptonic ; Aprile:dcpaper . The stable performance of XENON100 over a period of more than one year offers the opportunity to test this hypothesis with a different detector operated for the first time in the same underground site, the Laboratori Nazionali del Gran Sasso (LNGS), Italy.
For this analysis we use the 224.6 live days of XENON100 dark matter data accumulated from February 28, 2011 to March 31, 2012, previously used to search for spin-independent Aprile:2012run10 and spin-dependent Aprile:2013sd WIMP-induced NRs as well as for axion-induced ERs Aprile:axion and a comparison with DAMA/LIBRA using the average ER rate Aprile:dcpaper .
The ER energy and uncertainty therein is inferred from the prompt scintillation light signal (S1), as in Aprile:axion , using the NEST model (v0.98) nest fit to independent light yield calibration measurements Aprile:erquench ; laura:erquench . The overall uncertainty on the ER energy scale is dominated by the spread of the low energy measurements in Aprile:erquench ; laura:erquench and is estimated to be 14% at 2 keV and 9% at 6 keV.
We use the same S1 range of () photoelectrons (PE) as in Aprile:2012run10 ; Aprile:xe100analysis , but divided into two ranges. The low-E range () PE corresponds to () keV and thus covers the energy interval where the DAMA/LIBRA experiment observes a modulation signal. The higher energy range, () PE, corresponds to () keV and is used as a sideband control sample.
Low-E single-scatter events in the 34 kg fiducial mass, as expected from dark matter interactions, are selected using the same cuts as in Aprile:2012run10 . While these cuts were defined to select valid NR events, they also have high efficiency for ERs Aprile:axion , and result in 153 events distributed in time as shown in Fig. 1 (f). The cut acceptances in the energy ranges considered here have been derived following the procedure in Aprile:xe100analysis using ER calibration data (60Co and 232Th) taken on a weekly basis. The time variation of the acceptance, shown in Fig. 1 (e), is incorporated in the analysis by linearly interpolating between the data points. We have verified that our conclusions remain unaffected when adopting different methods of cut acceptance interpolation in time.
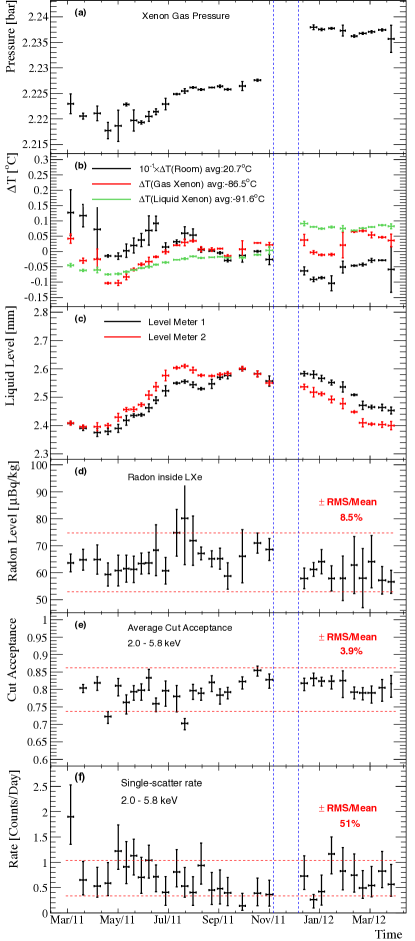
The design of XENON100 incorporates many sensors of various types to monitor the long-term stability of the detector. A total of 15 parameters were investigated, of which a subset with the highest potential impact on detector signals is shown in Fig. 1 (a–d). The absolute pressure of the gas above the LXe has a mean value of 2.23 bar with a maximum variation of 0.02 bar over the entire period (Fig. 1 (a)). The temperature sensors located at various positions within the detector exhibit a mean value varying from (in the Xe gas) to (bottom of the LXe) with a maximum variation of less than for each sensor. The ambient temperature in the XENON100 room has a mean value of with a maximum variation of (Fig. 1 (b)). The LXe level, monitored by two capacitive sensors, shows a maximum variation of 0.22 mm during the entire period (Fig. 1 (c)).
To identify potential correlations between detector parameters and ER rate, we calculate the linear (Pearson) and non-linear (Spearman-Rank) correlation coefficients for the two energy ranges studied, and for both single-scatter and multiple-scatter events. The latter are defined as events with a single-scatter in the fiducial region plus an additional S1 coincident signal in the LXe veto. The 99 kg LXe veto has an energy threshold of 100 keV, thus multiple-scatter events are dominated by high-energy scatters from rays Aprile:2012instr ; Aprile:ermc . Of all the parameters studied, two were found to give a non-correlation -value smaller than 0.001. The first parameter is the LXe level, which shows a negative linear and non-linear correlation with the low-E single-scatter rate. The second parameter is the Xe gas temperature, which shows a negative linear correlation with the low-E multiple-scatter rate. As expected, the LXe level and gas temperature were also found to be correlated with each other and with the room temperature. A change in the LXe level, gas pressure and temperature can potentially affect the observed size and width of the secondary scintillation signal, S2, which is a measure of the ionization electrons liberated in the interaction. The overall observed variation of the S2 signal is less than 5% Aprile:singleelectron , while the majority of events have S2 1000 PE, much larger than the trigger threshold of 150 PE. Consequently, a detailed inspection of the S2-dependent cuts shows that their performance is unaffected. Hence the correlation with event rate is possibly a coincidence and, regardless, does not impact our statistical analysis for periodicity described below.
The impact of decaying radioactive isotopes on the low-E ER rate is also considered for this analysis. These sources can be subdivided into external sources of -radiation from peripheral materials and -radiation from the decay of radioactive Rn and 85Kr distributed in the LXe volume.
Of the relevant external -sources in the detector and shield materials, only 60Co ( y) decays on a timescale sufficiently short to potentially cause an observable change in the event rate during the time period of this study. However, the decrease in activity is found to reduce the single-scatter low-E ER rate by less than 1 of its average value, based on a Monte Carlo (MC) simulation using the measured activity level from Aprile:ermc . Hence we assume the external -background to be constant for this analysis.
The short-lived isotopes 222Rn and 220Rn are constantly produced as part of the primordial 238U/232Th decay chains and are present in the air of the room and shield cavity, as well as inside the LXe due to emanation from inner surfaces. Radon decays outside the detector, measured by commercial Rn monitors in the room, contribute negligibly to the event rate in the fiducial mass since the emitted radiation is absorbed by the shield and outer detector materials. The concentration of Rn and subsequent decay products dispersed in the LXe is continuously monitored via examination of both -decays and - delayed coincidence events weberthesis . This analysis shows that 222Rn from the 238U chain is uniformly distributed in the volume while 220Rn from the 232Th chain is negligible. The time-variation of the 222Rn level is shown in Fig. 1 (d) and exhibits a specific activity of () Bq/kg. This level corresponds to a low-E ER contribution of () events/(keV tonne day) as determined by MC simulation Aprile:ermc . The 8.5 fluctuation of the 222Rn level corresponds to a less than 2% variation of the average rate and is thus negligible compared to the observed rate fluctuation of 51% shown in Fig. 1 (f). In addition, no time correlation is found by calculating the linear and non-linear correlation coefficients between the low-E ER rate and the Rn level. Therefore the evolution of the 222Rn level in time is not included in the statistical analysis below.
The other internal contamination, 85Kr, is also present in air. The concentration of natKr in the LXe during the period studied here was determined on November 17, 2011 to be parts per trillion using the rare gas mass spectrometer (RGMS) method Aprile:2012run10 ; rgms . However, it became evident after the end of the run that a small air leak in the Xe gas purification system had allowed Rn and Kr atoms to diffuse into the LXe. The leakage rate into the sensitive volume was estimated from a study of the time correlation between the external and internal concentrations of 222Rn weberthesis , including three RGMS measurements of natKr spread over the course of several months during the following run. Assuming a constant natKr concentration in air, the linear increase in time of natKr in the LXe was found to be proportional to the integrated number of additional 222Rn decays due to the air leak. The linear increase of the single-scatter ER rate from 85Kr has a slope events/(keV tonne day)/day assuming a 85Kr/natKr ratio of rgms . This time-dependent background results in an expected total increase of events/day at low-E over the course of one year, which is taken into account in the following statistical analysis.
To determine the statistical significance of a periodic time dependence in the event rate, we implement an un-binned profile likelihood (PL) method pltest , which incorporates knowledge of the time variation of detector parameters and radioactive backgrounds as described above. The event rate for a given energy range is described by
| (1) |
where is the corresponding average cut acceptance, interpolated from the measurements described above, is the constant component of the event rate, is the linearly increasing contribution from 85Kr, and is the modulation amplitude with period and phase . Eq. (1) is then normalized to take into account the time distribution of the dark matter data used for the analysis here, and thus becomes the probability density, , of observing an event occurring at time , in days relative to January 1, 2011. The null hypothesis, no periodicity, is given by Eq. (1) with .
The likelihood function used in the PL method is
| (2) |
where and are the total number of observed and expected events and is the energy in keV. Nuisance parameters corresponding to the uncertainties in , , and are constrained by the Gaussian penalty terms, , , and , respectively. These penalty terms have widths defined by the statistical errors of the acceptance as determined by weekly calibration measurements, events/(keV tonne day)/day, and taken from Fig. 2 of Aprile:axion , respectively. The maximum profiled likelihoods are denoted by for the null hypothesis and by for the periodic hypothesis.
The significance of a particular period, for example one year, is referred to as the local significance. The corresponding test statistic is the log-likelihood ratio, , which quantifies the incompatibility between the null and periodic hypotheses. MC simulations show that this test statistic is well-described by a -distribution with two degrees of freedom. When searching for a modulation signal across a range of periods, the global significance, that is the maximum of the local test statistics in the range, should be referenced. The local and global significances quoted are both one-sided.
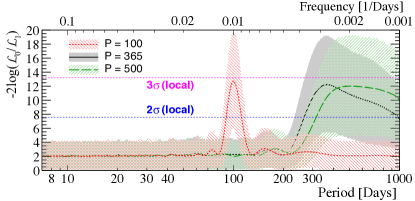
Simulated data were used to assess the discovery potential of the PL analysis to periodic components in the single-scatter data at low-E. Several sets of 153 simulated events were generated by drawing from the same live-time distribution as the actual data while varying the nuisance parameters according to their constraints in Eq. 2, and assuming the periodic hypothesis with a fixed period, amplitude and average rate. The expected significance is shown in Fig. 2 for three periods with an amplitude of events/(keV tonne day) and average rate of 6.0 events/(keV tonne day), selected to facilitate comparison with the best-fit results below. The minimum period considered is 7 days, since the cut acceptance is derived from weekly calibration measurements. The resolution on the reconstructed period becomes worse with increasing period, evident from the broadening of the peaks and a characteristic plateau for periods days. Hence the study of the data in Fig. 3 was limited to periods between 7 and 500 days. Adding the previous 100.9 live days of data Aprile:2011run08 to this analysis does not considerably increase the significance of the study due to its higher background rate from 85Kr and the uncertainty therein.
In addition to the un-binned PL analysis, a -test following chi2testqian and a Lomb-Scargle (LS) periodogram lstest were carried out using binned data. For both tests, a strong binning dependence of the result is observed. This dependence, as well as the unavoidable information loss when using any bin-dependent method, limits the power of these tests compared to the un-binned PL analysis. This fact must be taken into account when using the data in Fig. 1 (f) for further analysis. Nevertheless, the local and global significances are in agreement with the results of the PL analysis and the tests provide a consistency check.
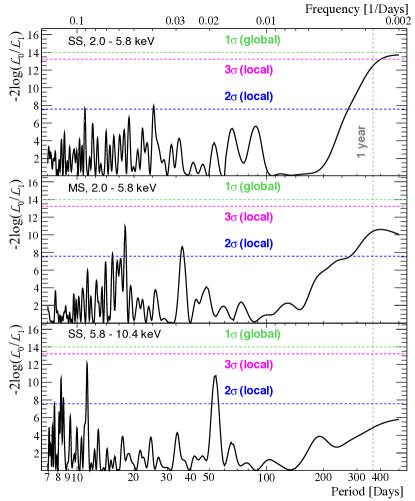
WIMP interactions in the LXe are expected to produce single-scatter events. The PL spectrum of the single-scatter data covering the DAMA/LIBRA energy region ( keV) is shown in the top panel of Fig. 3. A rise in significance is observed at long periods with a local significance of at one year and a global significance below for all periods. MC simulations with days in Fig. 2 show that the rise of significance at large periods in the measured data is not an artifact of the statistical method.
Low-E multiple-scatter events are used as a background-only control sample. The PL spectrum (middle panel of Fig. 3) shows a rise in significance at long periods, similar to that for single-scatters, with a local significance of at one year and a global significance below at all periods.
As WIMPs are expected to produce signals primarily at low-E, the higher energy range ( keV) is used as a sideband control sample. In addition, DAMA/LIBRA did not observe a modulation above 6 keV. The PL spectrum (bottom panel of Fig. 3) shows no prominent rise in significance at long periods, in contrast to that seen at low-E, and the local significance is at one year.
The best-fit parameters and uncertainties are determined from PL scans. For an assumed annual modulation signal (fixing days) in the low-E single scatter data, we obtain events/(keV tonne day) (for reference, events/(keV tonne day)), events/(keV tonne day), and days, peaked at April 22. Fig. 4 shows the corresponding confidence level contours as a function of modulation amplitude and phase. The simulations in Fig. 2 show that the rise in significance at long periods in the low-E single- and multiple-scatter data could be explained by a modulating component with a period 300 days. However, the best-fit phase disagrees with the expected phase from a standard dark matter halo (152 days) at a level of based on the 1D PL scan as shown in top panel of Fig. 4. Furthermore, the rise in significance at long periods is evident in both single- and multiple-scatter data, also disfavoring a WIMP interpretation. Allowing the parameter to float freely to unphysical negative values, given the measured 85Kr level, decreases the significance of large periods and strengthens the exclusion limit discussed below.
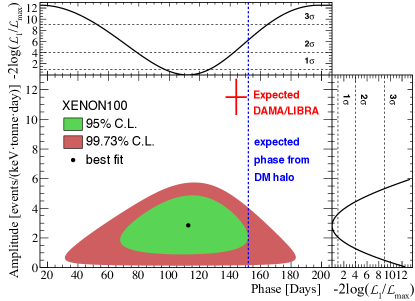
The XENON100 data can constrain the dark matter interpretation of the annual modulation observed by DAMA/LIBRA, as shown in Fig. 4, for certain models producing ERs. Such constraints were previously imposed using the average ER event rate in XENON100 Aprile:dcpaper . Here we use the full time-dependent rate information to directly compare with the expected DAMA/LIBRA annual modulation signal in our detector. The expected S1 spectrum in XENON100 is derived from the DAMA/LIBRA residual modulation spectrum (Fig. 8 in Bernabei:dama ) following the approach described in Aprile:dcpaper , assuming the signals are from WIMP-electron scattering through axial-vector coupling Kopp:leptonic ; Aprile:dcpaper . The expected annual modulation amplitude in the low-E range in XENON100 is then calculated as events/(keV tonne day), with statistical uncertainty from the reported DAMA/LIBRA spectrum and systematic uncertainty from the energy conversion in XENON100. To compare this expected signal with our data, the phase in Eq. (1) is set to () days Bernabei:dama , constrained by an additional Gaussian term, , in Eq. 2. The resulting PL analysis of our data disfavors the expected DAMA/LIBRA annual modulation at .
In summary, XENON100 has demonstrated for the first time that LXe dual-phase time projection chambers can be operated with sufficient long-term stability to enable searches for periodic signals for periods up to and greater than one year. The detector parameters investigated were found to be very stable, and most show no correlation with the measured low-E ( keV) single-scatter ER event rate. Although the LXe level and Xe gas temperature show a correlation with this rate, no evidence was found of a direct impact on the cut performance. A time varying cut acceptance and background from 85Kr are included in the search for event rate modulation. In the 224.6 live days of XENON100 data taken over the course of more than one year, a rising significance at long periods is observed for low-E single- and multiple-scatter events with the most likely period being 450 days. An explicit search for annual modulation in the ER rate gives a local significance with a maximum rate on April days. This phase disfavors an annual modulation interpretation due to the standard dark matter halo at . Furthermore, our results disfavor the interpretation of the DAMA/LIBRA annual modulation signal as being due to WIMP-electron scattering through axial-vector coupling at .
We gratefully acknowledge support from NSF, DOE, SNF, FCT, Region des Pays de la Loire, STCSM, NSFC, DFG, MPG, Stichting FOM, the Weizmann Institute of Science, EMG, ITN Invisibles, and INFN. We are grateful to LNGS for hosting and supporting the XENON project.
References
- (1) E. Aprile et al. (XENON100), Astropart. Phys. 35, 573 (2012).
- (2) G. Bertone, et al., Phys. Rep. 405, 279 (2005).
- (3) K. Freese, et al., Rev. Mod. Phys. 85, 1561 (2013).
- (4) R. Bernabei et al. (DAMA/LIBRA), Eur. Phys. J. C73, 2648 (2013).
- (5) E. Aprile et al. (XENON100), Phys. Rev. Lett. 109, 181301 (2012).
- (6) R. Agnese et al. (SuperCDMS), Phys. Rev. Lett. 112, 241302 (2014).
- (7) D. S. Akerib et al. (LUX), Phys. Rev. Lett. 112, 091303 (2014).
- (8) R. Bernabei et al. (DAMA/LIBRA), Phys. Rev. D77, 023506 (2008).
- (9) J. Kopp,V. Niro,T. Schwetz,J. Zupan, Phys. Rev. D80, 083502 (2009).
- (10) E. Aprile et al. (XENON100), Exclusion of Leptophilic Dark Matter Models using XENON100 Electronic Recoil Data (2015), Science in press.
- (11) E. Aprile et al. (XENON100), Phys. Rev. Lett. 111, 021301 (2013).
- (12) E. Aprile et al. (XENON100), Phys. Rev. D90, 062009 (2014).
- (13) M. Szydagis et al., JINST 6, P10002 (2011).
- (14) E. Aprile et al., Phys. Rev. D86, 112004 (2012).
- (15) L. Baudis et al., Phys. Rev. D87, 115015 (2013).
- (16) E. Aprile et al. (XENON100), Astropart. Phys. 54, 11 (2014).
- (17) E. Aprile et al. (XENON100), J. Phys. G: Nucl. Part. Phys. 41 (2014), 035201.
- (18) M. Weber, PhD Dissertation, University of Heidelberg (2013). www.ub.uni-heidelberg.de/archiv/15155.
- (19) E. Aprile et al. (XENON100), Phys. Rev. D83, 082001 (2011).
- (20) S. Lindemann et al, Eur. Phys. J. C74, 2746 (2014).
- (21) C. Cowan et al., Eur. Phys. J. C71, 1554 (2011).
- (22) E. Aprile et al. (XENON100), Phys. Rev. Lett. 107, 131302 (2011).
- (23) X. Qian et al., Phys. Rev. D86, 113011 (2012).
- (24) J. D. Scargle., Astrophys. J263, 835 (1982).