Deep X-ray spectroscopy and imaging of the Seyfert 2 galaxy, ESO 138-G001
Abstract
We present a spectral and imaging analysis of the XMM-Newton and Chandra observations of the Seyfert 2 galaxy ESO138-G001, with the aim of characterizing the circumnuclear material responsible for the soft (0.3-2.0 keV) and hard (5-10 keV) X-ray emission. We confirm that the source is absorbed by Compton-thick gas. However, if a self-consistent model of reprocessing from cold toroidal material is used (MYTorus), a possible scenario requires the absorber to be inhomogenous, its column density along the line of sight being larger than the average column density integrated over all lines-of-sight through the torus. The iron emission line may be produced by moderately ionised iron (FeXII-FeXIII), as suggested by the shifted centroid energy and the low K/K flux ratio. The soft X-ray emission is dominated by emission features, whose main excitation mechanism appears to be photoionisation, as confirmed by line diagnostics and the use of self-consistent models (Cloudy).
keywords:
galaxies: active - galaxies: Seyfert - X-rays: individual: ESO138-G0011 Introduction
The X-ray spectrum of highly obscured Seyfert galaxies is dominated by reflection components, originating from both cold and ionised circumnuclear matter (Matt et al., 2000). In unobscured objects, these reflection components can be heavily diluted, often down to the point of invisibility. However in Compton-thick sources (where the absorbing column density along the line of sight exceeds N cm-2) the complete obscuration of the primary nuclear continuum permits us to have a clear view of these components. So far, most of our knowledge of circumnuclear reprocessing material is based on the brightest Compton-thick sources in the sky, like Circinus (e.g. Matt et al., 1999; Sambruna et al., 2001; Molendi et al., 2003a), NGC 1068 (e.g. Kinkhabwala et al., 2002; Matt et al., 2004), Mrk 3 (e.g. Sako et al., 2000; Bianchi et al., 2005; Pounds & Page, 2005) and NGC 424 (Marinucci et al., 2011).
ESO138-G1 ( a Seyfert 2 galaxy at = 0.0091) exhibits a compact nucleus and a bright asymmetric, wedge-shaped circumnuclear zone of diffuse light resembling an ionization cone from the AGN (Muñoz Marín et al., 2007). Studying X-ray data from ASCA, Collinge & Brandt (2000) found for this object a hard spectrum and a prominent Fe K emission line, suggesting that ESO 138-G1 is a reflection dominated source, but statistically acceptable fits were also found with a partial-covering absorption column of NH=21023 cm-2.
Recently, an X-ray spectral analysis of this source has been performed by Piconcelli et al. (2011), studying two short XMM-Newton observations in 2007. A soft excess component, characterized by the presence of several emission lines, was revealed below 2 keV. Fitting above 3 keV with a power law, a very flat slope was found ( 0.35), with the presence of a prominent emission line around 6.4 keV and identified with the neutral iron K fluorescence line. The large EW (800 eV) of this feature indicates a heavy obscuration along the line of sight. This obscuration can be caused by a Compton-thin (transmission scenario) or Compton-thick (reflection scenario) screen of absorbing material which prevents the direct observation of most or all nuclear X-ray emission. These models provided a good fit to the data and appear statistically equivalent; however the equivalent width of the Fe K line around 800 eV and the low ratio of 2-10 keV to de-reddened [OIII] fluxes lead Piconcelli et al. (2011) to suppose that ESO 138-G1 is a Compton-thick galaxy. Finally, it has been noted that the upper limits to the 15-150 keV flux provided by Swift/BAT and INTEGRAL/IBIS observations seem to exclude the presence of a direct view of the nuclear continuum even in the very hard X-ray band, implying a very high value for the column density, of the order of 1025 cm-2.
In this paper, we present a new observational campaign of ESO 138-G001 performed with XMM-Newton and Chandra in 2013 and 2014, respectively.
2 Observations and data reduction
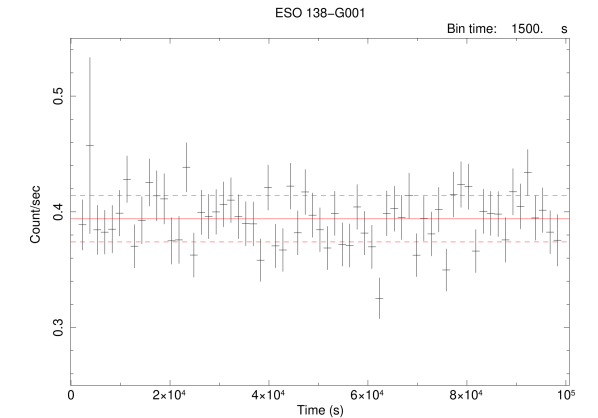
ESO 138-G001 was observed by XMM-Newton (Jansen et al., 2001) twice in 2007 and once in 2013, on February 24, with the European Photon Imaging Cameras (EPIC): the pn (Strüder et al., 2001) and the two MOS (Metal-Oxide Semi-conductor; Turner et al., 2001) detectors. These were operated in Full Frame Mode using thin filters. The 2007 observations, for a total clean exposure time of ks, are discussed in detail in Piconcelli et al. (2011). We focus here on the long observation performed in 2013, for total elapsed time of 135 ks. Data were reduced with SAS 14.0 with the latest calibration available at the time of writing. Screening for intervals of flaring particle background was done consistently with the choice of extraction radii, in an iterative process based on the procedure to maximize the signal-to-noise ratio described in detail by Piconcelli et al. (2004) in their appendix A. This led to optimal extraction radii of 33 and 35 arcsec, respectively for pn and the two MOS, while background spectra were extracted from nearby circular regions with a radius of 50 arcsec. After having verified their consistency, the two MOS spectra were co-added. The final clean exposure times are 85 and 122 ks, for the pn and the co-added MOS spectra, respectively. Patterns 0–4 for pn and 0–12 for MOS were used. The spectra were then binned in order to over-sample the instrumental resolution by at least a factor of 3 and to have no less than 30 counts in each background-subtracted spectral channel, allowing us to adopt the statistics. Although we found no significant difference between the 2003 and the 2013 spectra, we decided not to co-add them, since the new observation has a much longer exposure time. We also used time-averaged spectra, due to the lack of both spectral and flux variations in the 2013 observation (Fig. 1). Moreover, we do not use MOS data in this paper, unless explicitly stated. Finally, RGS spectra were extracted with standard procedures. Background spectra were generated using blank field event lists, accumulated from different positions on the sky vault along the mission. Exposure times of the RGS spectra are 128 ks (see Table 2).
The source was then observed by Chandra on 2014, June 20 for an exposure time of 49 ks, with the ACIS-S detector (Advanced CCD Imaging Spectrometer: Garmire et al., 2003). Data were reduced with the Chandra Interactive Analysis of Observations (CIAO: Fruscione et al., 2006) 4.7 and the Chandra Calibration Data Base 4.6.5 data base, adopting standard procedures. The imaging analysis was performed applying the subpixel event re-positioning and smoothing procedures discussed in the literature (Tsunemi et al., 2001; Li et al., 2004). We therefore used a pixel size of 0.246 arcsec, instead of the native 0.495 arcsec. At the distance of the source the adopted pixel size corresponds to pc. After cleaning for background flaring events, we get a clean exposure of 49 ks. Source and background spectra were extracted from circular regions of 5 and 15 arcsec and grouped them to have at least 20 total counts per new bin. The source is affected by pile-up and, following Davis (2001), we estimate it to be .
In the following, errors and upper limits correspond to the 90 per cent confidence level for one interesting parameter, where not otherwise stated. The adopted cosmological parameters are km s-1 Mpc-1 , and (i.e. the default ones in xspec 12.8.1: Arnaud, 1996). All models presented in this paper include Galactic absorption along the line of sight (NH=1.31021cm-2: Kalberla et al., 2005), i.e. the same value used by Piconcelli et al. (2011).
3 X-ray spectral analysis
3.1 The hard X-ray (5-10 keV) band
As a first step, we restrict our analysis to the 5-10 keV energy range to investigate the reflected primary continuum and the iron K complex, testing two alternative scenarios:
-
•
a reflection-dominated scenario where the X-ray primary continuum from the AGN is totally suppressed in the EPIC band for the presence of a Compton-thick absorber (cm-2).
-
•
a transmission-dominated scenario, where the AGN emission is absorbed by a Compton-thin (1024 cm-2) obscuring screen.
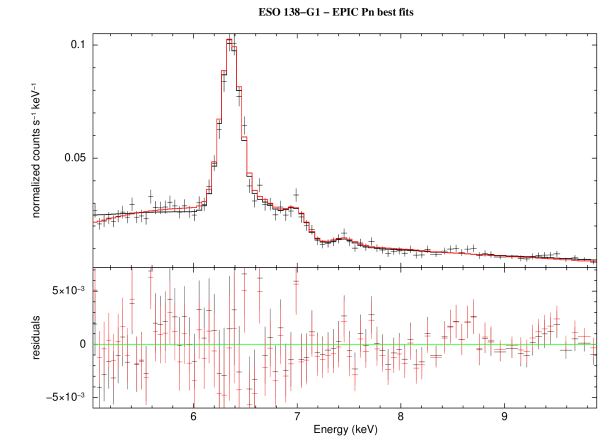
We start fitting the pn data with the reflection scenario. This model consists of a neutral absorption component modeled by TBABS, using solar abundances Wilms et al. (2001) and cross-sections from Verner et al. (1996), and a cold reflection component modeled by pexrav (Magdziarz & Zdziarski, 1995) in xspec. The reflection factor indicates the amount of radiation reflected by Compton scattering from a semi-infinite slab with respect to the incident continuum. We assume solar abundances, (corresponding to a pure reflection spectrum) and we fix the high-energy cutoff to Ec=1000 keV and the inclination angle to (Piconcelli et al., 2011) . Additional free parameters are the photon index and four Gaussian emission lines (see section 3.1.1 for further details) corresponding to the strong fluorescence Fe K and Ni K lines, the Fe K and an ionised Fe K line (Fe XXV K), as already reported in Piconcelli et al. (2011). We fix all the line widths to zero, exception made for the Fe K. Fitting the pn data with the reflection model, we obtain /dof=78/78=1 with a photon index =1.8. In Fig. 1 we show the pn data set fitted with the reflection model and residuals (in black).
| Line | Energy | EW | Intensity | ET | |
|---|---|---|---|---|---|
| (keV) | (eV) | 10-6(ph cm-2 s-1) | (eV) | (keV) | |
| Fe K | 6.417 | 745 | 26.7 | 22 | 6.400 |
| Fe XXV K | 6.73 | 54 | 2.0 | - | 6.675(i) |
| 6.700(r) | |||||
| Fe K | 7.07 | 100 | 3.1 | - | 7.058 |
| Ni K | 7.51 | 80 | 1.6 | - | 7.472 |
| date | exposure time | count rates | |
|---|---|---|---|
| (ks) | cts/s | ||
| RGS 1 | 2013-02-24 | 128 | (6.10.8) |
| RGS 2 | 2013-02-24 | 128 | (8.10.7) |
| pn | 2013-02-24 | 85 | 0.390.02 |
| ACIS | 2014-06-20 | 49 | (9.80.1) |
As a next step we fit the pn data with the transmission scenario. The transmission model is composed by an absorbed power-law (in which the Galactic absorption is modeled by TBABS) and four Gaussians to reproduce the four emission lines discussed above. Since no reflection from cold material is considered we do not use the pexrav component in our model. We get a /dof=79/77=1.02 with =2.6 and N cm-2. We plot the data set fitted with the transmission model in Fig. 1 and residuals (in red).
| Band | Flux | Luminosity |
|---|---|---|
| (keV) | 10-12 erg cm-2 s-1 | 1041 erg s-1 |
| 5-10 | 1.89 | 3.46 |
| 2-10 | 2.29 | 4.20 |
| 0.5-10 | 2.33 | 4.26 |
From a statistical point of view, the reflection model and the transmission model appear equivalent (reduced values of 1 and 1.02, respectively, for one additional degree of freedom)but for the reflection model the best fit value for the the power law index is typical of Seyfert galaxies (Bianchi et al., 2009) and it is in agreement with the value reported in Piconcelli et al. (2011). In the transmission scenario, the power law index is extremely steep (=2.6) and cannot be reconciled with the observed distribution of this parameter in radio-quiet AGN. Moreover, we can use the ratio of the observed 2-10 keV to the extinction-corrected [OIII] fluxes as a proxy for the amount of obscuration of the X-ray primary continuum. The [OIII] emission line is an isotropic indicator of the AGN power, being produced in the Narrow Line Region. In particular, X-ray sources with are associated with a Compton-thick absorber and a 2-10 keV reflection dominated spectrum (Bassani et al., 1999; Akylas & Georgantopoulos, 2009; González-Martín et al., 2009). The extinction-corrected [OIII] flux of ESO 138-G1 is 2.710-12erg cm-2 s-1 (Piconcelli et al. (2011) and references therein). In our reflection scenario assumes a value (with the 2-10 keV flux reported in Table 2) of 0.85, which is consistent with the existence of a Compton-thick screen which suppresses the intrinsic 2-10 keV flux. For the transmission scenario, we found for the de-absorbed 2-10 keV flux a value of 1.410-11erg cm-2 s-1, which gives T 5. This value is inconsistent with those found by many studies for unabsorbed Seyfert 1 and absorption corrected Compton-thin Seyfert 2 galaxies (Maiolino et al., 1998; Panessa et al., 2006; Lamastra et al., 2009), which are typically 10. Therefore, the comparison with the [OIII] flux gives further support to the reflection dominated scenario.
3.1.1 The emission features
All the line fluxes (see Table 1) are consistent with the values found by Piconcelli et al. (2011) for the old 2007 XMM observation. We find an intense Fe K emission line at 6.417 keV: its large Equivalent Width (EW=745 eV) suggests the presence of Compton-thick material (Matt et al., 1991; George & Fabian, 1991). Fe K and Ni K are unresolved, but their width is consistent with being produced by the same gas responsible for the Fe K emission. We find an emission line at 6.73 keV, consistent with being dominated by contributions from the resonance and the inter-combination components of the Fe XXV K triplet.
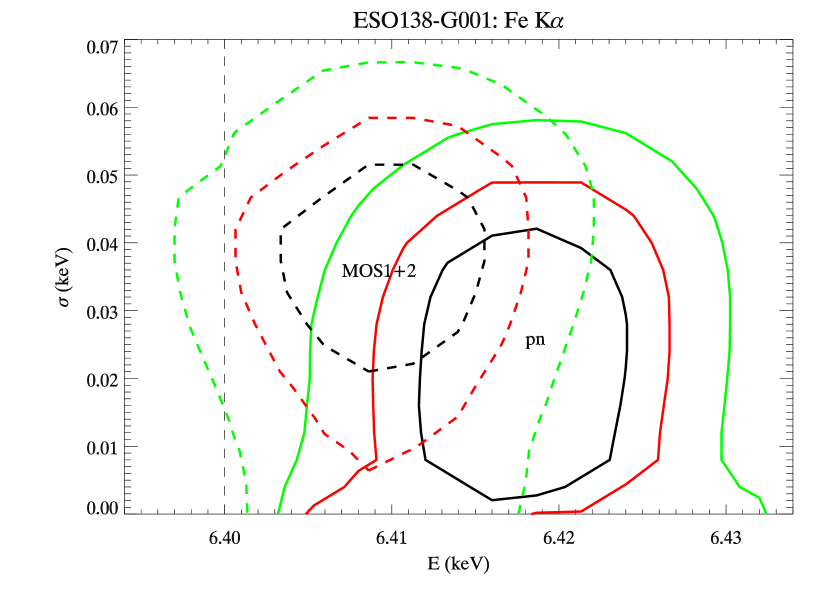
The energy centroid of the Fe K line (consistent with the value found by Piconcelli et al., 2011) is not consistent with the theoretical value for neutral iron in the pn spectrum, only marginally in the MOS (at a confidence level of 99, see Fig. 3). This inconsistency can be due to calibration issues, but may also have a physical origin, suggesting that iron may be ionised: the observed centroid energy is indeed consistent with FeXIII-FeXVI (House, 1969). We also calculated the ratio between the fluxes of Fe K and Fe K, which depends on iron ionization:
| (1) |
This value again is inconsistent with the one expected for neutral iron (0.155-0.160: Molendi et al., 2003b; House, 1969), but it is consistent with the values of the ratio associated to the group of lines FeX-FeXII (Kaastra & Mewe, 1993). Although this piece of information is not formally in complete agreement from what we derived from the centroid energy, both diagnostics seems to agree that iron is ionised at about FeXII-XIII.
Adopting the best fit centroid energy and width, we find that FWHM=2400 km. From the FWHM, assuming a Keplerian motion around the central object, we can calculate the distance of the gas which produces the line:
| (2) |
where the radius is expressed in parsec, the mass in 108M⊙ and i is the angle between the torus axis and the line of sight (see e.g. Bianchi et al., 2005). The BH mass of ESO 138-G1 is estimated to be 4.6106M⊙ (Piconcelli et al., 2011). Inserting this value for different choices of i of 30 or 60 degrees we obtain respectively for the distance of the gas the values 3.410-3pc and 110-2pc. These values, together with the measured FWHM, are more suggestive of an origin of the line in the BLR rather than the torus. However, since the X-ray emission of this source is strongly absorbed, an ad-hoc geometry would be needed to explain the observation of an iron emission line from the BLR.
On theoretical grounds, the Compton-scattering of the red part of the Fe K line should produce a Compton Shoulder, which can be modeled with a Gaussian line with fixed at 40 eV and energy fixed at 6.3 keV (Matt, 2002). The inclusion of such a component produces only a little improvement of (/dof=76/77=0.99) and we only find an upper limit for its intensity F10-6ph cm-2s-1. The intensity and energy centroid of the iron K are consistent with the values reported above and we find an upper limit of 36 eV for the width of the line. The ratio FCS/F0.19 is marginally consistent with the 0.2 value expected for a Compton-thick material (Matt, 2002; Yaqoob & Murphy, 2011).
3.2 The soft X-ray (0.3-2.5 keV) band
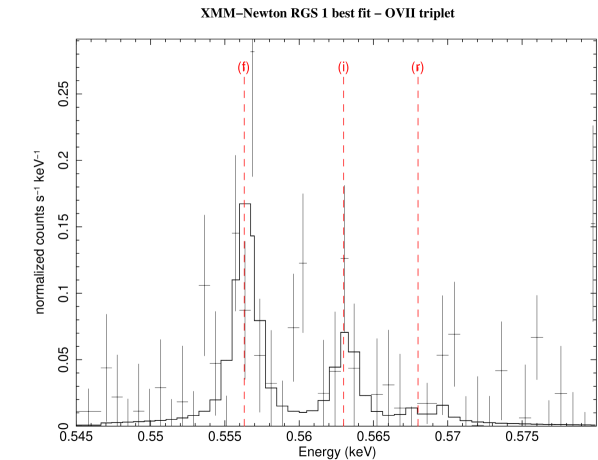
The soft X-ray spectrum of ESO 138-G1 appears dominated by line emission, as commonly found in this class of sources (e.g. Guainazzi & Bianchi, 2007). We analyse the RGS 1 and RGS 2 spectra jointly, performing phenomenological fits on -bin spectral segments, using Gaussian profiles at the redshift of the source (z=0.0091), and a power law, both absorbed by the Galactic column density along the line of sight. Since the model used to fit the continuum is not very sensitive to the photon index , due to the very limited band width of each segment, it has been fixed to . Emission lines from H-like and He-like O, Ne, Mg and Si, as well as from the Fe L-shell, are detected (see Table 4). Even though the likely identification of RRC features, together with the dominance of OVII K line, suggest an origin of these lines in a gas in photoionisation equilibrium (Guainazzi & Bianchi, 2007), it is impossible to extract more pieces of information from this phenomenological fit.
| Energy | Intensity | Energy | Intensity | Identification | ET |
|---|---|---|---|---|---|
| (pn) | (pn) | (RGS) | (RGS) | ||
| 0.57 | 28 | 0.5614 | 39 | OVII K | 0.5610(f) |
| 0.5685 | 20 | 0.5685(i) | |||
| 0.5739 * | 0.5739(r) | ||||
| 0.68 | 8.5 | 0.6530 | 18.4 | OVIII K | 0.6536 |
| 0.78 | 15 | 0.7263 | 4.5 | FeXVII M2, FeXVII 3G | 0.7252, 0.7272 |
| 0.7390 | 14.0 | OVII RRC | 0.7393 | ||
| 0.8257 * | 17 | 0.8263 | 7.5 | FeXVII 3C | 0.8257 |
| 0.87 | 22 | 0.8738 | 12.0 | OVIII RRC,Fe XVIII L | 0.8714, 0.8728 |
| 0.94 | 24 | 0.9054 | 12.3 | NeIX K | 0.9050(f) |
| 0.9149 * | 0.9149(i) | ||||
| 0.9220 | 10.0 | 0.9220(r) | |||
| 1.06 | 9.2 | 1.0747 | 5.8 | NeIX K | 1.0737 |
| 1.19 | 8.7 | 1.202 | 8.7 | Fe XXIII L | 1.170 |
| 1.31 | 8.3 | 1.331 | 3.8 | MgXI | 1.3311(f) |
| 1.3433 * | 1.3433(i) | ||||
| 1.351 | 4.3 | 1.3522(r) | |||
| 1.41 | 5.7 | 1.4857 | 2.8 | MgXII K | 1.4723 |
| 1.82 | 5.9 | 1.8394 * | SiXIII | 1.8394(f) | |
| 1.8541 * | 1.8541(i) | ||||
| 1.8649 * | 1.8649(r) | ||||
| 1.98 | 1.0 | 2.0054 * | Si XIV K | 2.0054 | |
| 2.41 | 3.4 | 2.416 * | S XIV K | 2.416 |
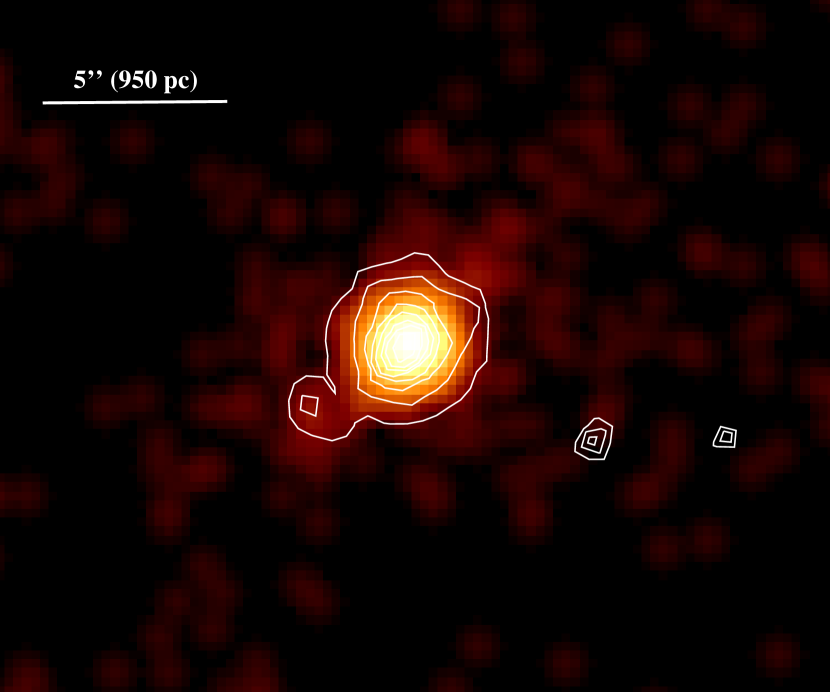
In Fig. 5 we show the 0.3-2 keV Chandra ACIS image of ESO 138-G001. The source appears unresolved, but presents hints of elongation along the NW-SE direction: all the soft X-ray emission, likely arising from the Narrow Line Region, is enclosed in 1 squared kiloparsec. Schmitt & Storchi-Bergmann (1995) found that the [OIII] emission exhibits a jetlike structure that propagates westward up to 2 kpc from the nucleus at the 2 level, with a peak of emission at 7 arsec (1.3 kpc). This [OIII] extension is also present in a HST/WFPC2 image presented by Ferruit et al. (2000), where it appears as a faint extension given the short exposure. However, only 4% of the total [OIII] flux of the source ( erg cm-2 s-1) is emitted outside the central 5 arcsec (Table 2; Schmitt & Storchi-Bergmann, 1995). The soft X-ray flux of the NLR is generally a factor 2-5 lower than the [OIII] flux (Bianchi et al., 2006), so it is not surprising that this further weak extension is not detected in our Chandra observation.
3.3 The broad-band (0.5-10 keV) model
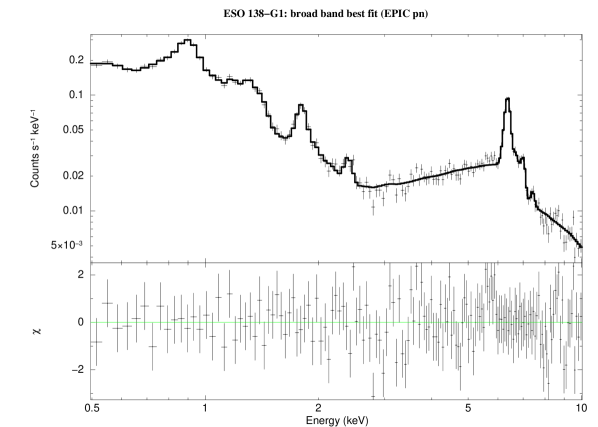
We then analyse the 0.5-10 keV spectrum of ESO 138-G1, by fitting the pn data with a new model consisting of the reflection model presented above, plus an unabsorbed power law component and a sequence of narrow (=0) Gaussian lines to account for the emission features observed in the soft part of the energy range. We obtain a reasonable fit with a reduced /dof=221/194=1.14. The unabsorbed power law component is described by a photon index =2.80, which is consistent with the value found by Piconcelli et al. (2011). The reflection component is now described by a photon index =1.59, which is marginally consistent with the photon index found in the hard band analysis =1.8. In our analysis we identify thirteen emission lines in the soft X-ray band, some of which already reported by Piconcelli et al. (2011). In Table 4, the best fit parameters of these lines are listed, together with a comparison with the RGS analysis presented in the previous section. No significant differences, both in energies and intensities, can be seen between the results of the two instruments. We plot in Fig. 6 (left-hand panel) our data fitted with the broad-band model, which is shown in detail, with all its components, in Fig. 7. Observed fluxes and luminosities for this model in different energy bands are listed in Table 3.
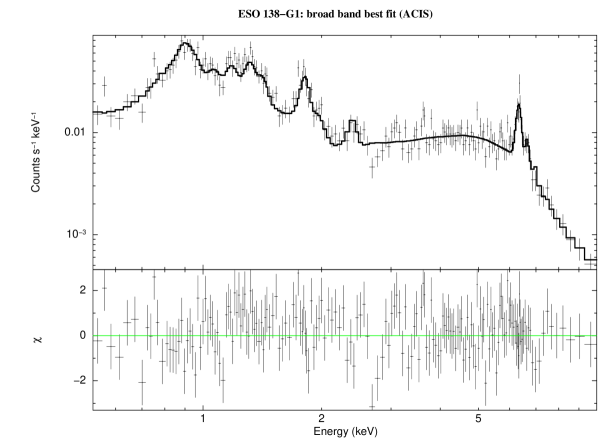
We use the pn best-fit model to model the ACIS spectrum of the source, adding the pileup component in xspec (Davis, 2001), since the observation is affected by pile-up. Leaving as free parameters only the overall normalization, and the centroid energies and intensities of the Iron K and Iron XXV K emission lines, we get a best-fit with /dof=199/176=1.13. All free parameters are in agreement with the ones presented above for the pn. We show in Fig. 6 (right-hand panel) the best-fit and residuals.

4 A Self-consistent model
As a final step, we performed a self-consistent modeling of the broad-band pn data, following the phenomenological analysis. In the previous sections we modelled the reflection emission from the cold material in ESO 138-G1 with pexrav which assumes a plane slab of cold reflecting material. For the high energy part of the spectrum, we now adopt (as well as TBABS to model the Galactic column) MyTORUS(Murphy & Yaqoob, 2009), which reproduces the primary continuum together with the reprocessed emission from a toroidal distribution of material. This scenario corresponds to the doughnut type of geometry used for the obscuring torus in the AGN unification schemes. We define the equatorial column density as the equivalent hydrogen column density through the diameter of the tube of the torus.
We used all three MyTORUS components: the primary power-law absorbed by the torus along the line of sight, the continuum reflection component and the emission features associated to it (Fe K, Fe K and the Fe K Compton Shoulder). The normalization between these three components is left free to vary, in order to account for deviation from the standard geometry, covering factor and elemental abundances. On the other hand, the equatorial column density and the inclination angle of the torus are the same for all the components. Since the Fe K line in ESO 138-G1 was found to have an energy significantly larger than 6.4 keV (see Sect. 3.1), we left the redshift free for the emission features component.
For the soft X-ray emission, we used an updated and extended version of the same photoionisation model first presented in Bianchi et al. (2010), produced with cloudy 13.03 (last described in Ferland, 2000). The main ingredients are: plane parallel geometry, with the flux of photons striking the illuminated face of the cloud given in terms of ionisation parameter U (Osterbrock & Ferland, 2006); incident continuum modeled as in Korista et al. (1997)111Since ESO 138-G1 is a strongly absorbed source, we have no direct information on its intrinsic SED. However, the standard AGN SED that we used for this model is well suited for our qualitative analysis of a low resolution soft X-ray spectrum.; constant electron density n cm-3 (we are nonetheless in a regime insensitive to density: Porquet & Dubau (2000)); elemental abundances as in Table 9 of cloudy documentation. Only the reflected spectrum, arising from the illuminated face of the cloud, has been taken into account in our model.
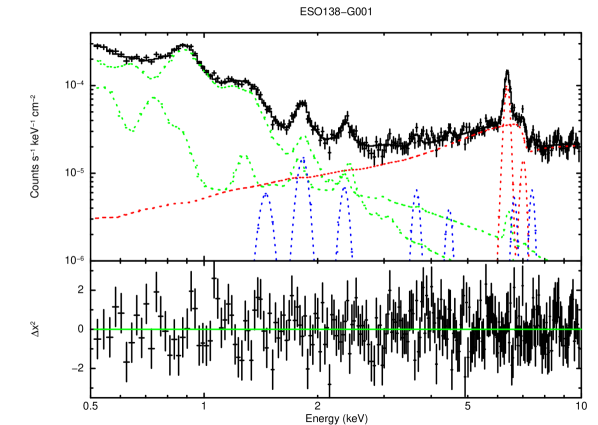
The resulting fit is unacceptable ( d.o.f.), with strong residuals, mostly in the soft X-ray part of the spectrum. While adding emission from a collisionally ionised gas (apec) does not improve the fit significantly (), another photoionisation component is strongly required by the data ( d.o.f.). Some residuals are still present in the data: they can be readily identified with emission of fluorescent lines from neutral Nickel (7.472 keV), Calcium (3.690 keV), and Titanium (4.510 keV), which may be self-consistently produced in the torus, but are not included in MyTORUS, the FeXXV K line (marginally constrained to be the resonant component of the triplet at 6.700 keV), not associated in our model to any continuum emission (the ionization parameters of both photoionisation components are too low to produce a significant contribution to this line: see below), as well as contribution from the forbidden transition of the SIXIII K triplet (1.8394 keV), SiXIV K (2.3763 keV), and MgXII K (1.4723 keV), which are underestimated by the two photoionisation components. The inclusion of these seven Gaussian lines further improves the fit, which is now good ( d.o.f.), and without systematic residuals (see Fig. 8). All the energies of the Gaussians are fixed and their widths are fixed to be narrow ( = 0).
The final model, in xspec, reads as:
TBABS(CLOUDY1+CLOUDY2+7ZGAUSS
+POWMYTT+MYTS+MYTL).
The best fit parameters for this fit are summarized in Table LABEL:torusparameters. The two photoionisation components have , , and , (in cm-2). The photon index of the intrinsic continuum is and the equatorial column density for all MyTORUS components is cm-2. The inclination angle is constrained to be (99% confidence level), while the default geometry of MyTORUS requires it to be in order to have absorption along the line of sight. The normalization between the emission lines component and the scattered continuum from the torus is , reflecting a somewhat different geometry, covering factor and/or elemental abundance with respect to the default one of the model.
| Parameter | Best fit value |
|---|---|
| NH | |
| MyTorusL/MyTorusS | |
| MgXII K (1.4723 keV) | |
| SIXIII K f (1.8394 keV) | |
| SiXIV K (2.3763 keV) | |
| CaI K (3.690 keV) | |
| TiI K (4.510 keV) | |
| FeXXV K r (6.700 keV) | |
| NiI K (7.472 keV) |
Finally, the data do not require any contribution from a transmitted primary continuum, being it constrained to be than the scattered component (99% confidence level). The geometry and/or covering factor of the reflector may be significantly different from the one assumed by MyTORUS, greatly enhancing the reflection flux, or the observed reflected flux is an echo of a much more luminous state of the source in the past. Interestingly, Rose et al. (2015), using WISE mid-IR colours (4.6–22 m), suggested a torus inclination angle of for this source: in agreement with Goulding et al. (2012), in which the lack of m silicates absorption feaures is reported. Such a low inclination angle would support a scenario whereby we have an unobscured line of sight to this source, which should therefore be switched off, leaving only reflection from distant material as an echo of its past activity.
Alternatively, assuming that the normalization of the intrinsic continuum is the same as the scattered one, the column density along the line of sight must be cm-2, which is significantly larger than the column density along the line of sight derived from the default MyTORUS geometry (roughly between 0.25 and 0.65 times the equatorial one, given the constraints we get on the inclination angle), and than the mean column density, integrated over all lines-of-sight through the torus, which is the equatorial one. Therefore, in this scenario, the absorbing/reflecting medium would not be homogeneous, but the column density along the line of sight, responsible for the absorption of the nuclear continuum, would be larger than the average column density of the reflector, responsible instead of the overall properties of the reflected spectrum. The 14-195 keV Swift-BAT spectrum of ESO 138-G1 retrieved from the online 70-month catalog222http://swift.gsfc.nasa.gov/results/bs70mon/ does not allow us to discriminate between the two scenarios due to its low statistics. We also note that the galaxy NGC 6221 (only arcmin distant from ESO 138-G1) might possibly contaminate the Swift-BAT FOV. A possible breakthrough can be represented by observations preformed with high energy (10 keV) focusing instruments, such NuSTAR and, in the near future, Astro-H, which could allow us to disentangle the hard X-ray spectral properties of these different scenarios and discard the contamination due to the presence of NGC 6221 in the FOV.
5 Conclusions
We presented in this work a broadband (0.3-10 keV) analysis of the XMM-Newton and Chandra observations of the Seyfert 2 galaxy, ESO 138-G001. Our main results can be summarized as follows.
-
•
The source appears to be absorbed by Compton-thick gas along the line of sight, confirming and refining past results. However, if a self-consistent model of reprocessing from cold toroidal material is used (MyTORUS), a possible scenario requires the absorber to be inhomogenous, its column density along the line of sight being larger than the average column density integrated over all lines-of-sight through the torus;
-
•
the iron emission line around 6.4 keV is likely produced by moderately ionised iron (FeXII-FeXIII), as suggested by the shifted centroid energy and the low K/K flux ratio;
-
•
the soft X-ray emission is dominated by emission features, well identified in the high-spectral resolution RGS spectra with transitions from highly ionised metals, as commonly found in Seyfert 2 galaxies. This emission is likely associated with the optical NLR, which is quite compact and, therefore, unresolved even in the high-spatial-resolution Chandra image. Photoionisation appears to be the main excitation mechanism for this gas, as confirmed by line diagnostics and the use of self-consistent models (Cloudy) for the low-resolution pn spectrum.
Acknowledgments
We thank M. Guainazzi for useful discussions.
References
- Akylas & Georgantopoulos (2009) Akylas A., Georgantopoulos I., 2009, A&A, 500, 999
- Arnaud (1996) Arnaud K. A., 1996, in ASP Conf. Ser. 101: Astronomical Data Analysis Software and Systems V XSPEC: The First Ten Years. p. 17
- Bassani et al. (1999) Bassani L., Dadina M., Maiolino R., Salvati M., Risaliti G., della Ceca R., Matt G., Zamorani G., 1999, ApJS, 121, 473
- Bianchi et al. (2010) Bianchi S., Chiaberge M., Evans D. A., Guainazzi M., Baldi R. D., Matt G., Piconcelli E., 2010, MNRAS, pp 418–+
- Bianchi et al. (2006) Bianchi S., Guainazzi M., Chiaberge M., 2006, A&A, 448, 499
- Bianchi et al. (2009) Bianchi S., Guainazzi M., Matt G., Fonseca Bonilla N., Ponti G., 2009, A&A, 495, 421
- Bianchi et al. (2005) Bianchi S., Miniutti G., Fabian A. C., Iwasawa K., 2005, MNRAS, 360, 380
- Collinge & Brandt (2000) Collinge M. J., Brandt W. N., 2000, MNRAS, 317, L35
- Davis (2001) Davis J. E., 2001, ApJ, 562, 575
- Ferland (2000) Ferland G. J., 2000, in Revista Mexicana de Astronomia y Astrofisica Conference Series Cloudy 94 and Applications to Quasar Emission Line Regions. pp 153–157
- Ferruit et al. (2000) Ferruit P., Wilson A. S., Mulchaey J., 2000, ApJS, 128, 139
- Fruscione et al. (2006) Fruscione A., McDowell J. C., Allen G. E., Brickhouse N. S., Burke D. J., Davis J. E., Durham N., Elvis M., Galle E. C., Harris D. E., Huenemoerder D. P., Houck J. C., Ishibashi B., Karovska M., Nicastro F., Noble M. S., Nowak M. A., Primini F. A., 2006, in Observatory Operations: Strategies, Processes, and Systems. Edited by Silva, David R.; Doxsey, Rodger E.. Proceedings of the SPIE, Volume 6270, pp. 62701V (2006). Vol. 6270 of Presented at the Society of Photo-Optical Instrumentation Engineers (SPIE) Conference, CIAO: Chandra’s data analysis system
- Garmire et al. (2003) Garmire G. P., Bautz M. W., Ford P. G., Nousek J. A., Ricker G. R., 2003, in X-Ray and Gamma-Ray Telescopes and Instruments for Astronomy. Edited by Joachim E. Truemper, Harvey D. Tananbaum. Proceedings of the SPIE, Volume 4851, p. 28-44 Advanced CCD imaging spectrometer (ACIS) instrument on the Chandra X-ray Observatory
- George & Fabian (1991) George I. M., Fabian A. C., 1991, MNRAS, 249, 352
- González-Martín et al. (2009) González-Martín O., Masegosa J., Márquez I., Guainazzi M., 2009, ApJ, 704, 1570
- Goulding et al. (2012) Goulding A. D., Alexander D. M., Bauer F. E., Forman W. R., Hickox R. C., Jones C., Mullaney J. R., Trichas M., 2012, ApJ, 755, 5
- Guainazzi & Bianchi (2007) Guainazzi M., Bianchi S., 2007, MNRAS, 374, 1290
- House (1969) House L. L., 1969, ApJS, 18, 21
- Jansen et al. (2001) Jansen F., Lumb D., Altieri B., Clavel J., Ehle M., Erd C., Gabriel C., Guainazzi M., Gondoin P., Much R., Munoz R., Santos M., Schartel N., Texier D., Vacanti G., 2001, A&A, 365, L1
- Kaastra & Mewe (1993) Kaastra J. S., Mewe R., 1993, A&AS, 97, 443
- Kalberla et al. (2005) Kalberla P. M. W., Burton W. B., Hartmann D., Arnal E. M., Bajaja E., Morras R., Pöppel W. G. L., 2005, A&A, 440, 775
- Kinkhabwala et al. (2002) Kinkhabwala A., Sako M., Behar E., Kahn S. M., Paerels F., Brinkman A. C., Kaastra J. S., Gu M. F., Liedahl D. A., 2002, ApJ, 575, 732
- Korista et al. (1997) Korista K., Baldwin J., Ferland G., Verner D., 1997, ApJS, 108, 401
- Lamastra et al. (2009) Lamastra A., Bianchi S., Matt G., Perola G. C., Barcons X., Carrera F. J., 2009, A&A, 504, 73
- Li et al. (2004) Li J., Kastner J. H., Prigozhin G. Y., Schulz N. S., Feigelson E. D., Getman K. V., 2004, ApJ, 610, 1204
- Magdziarz & Zdziarski (1995) Magdziarz P., Zdziarski A. A., 1995, MNRAS, 273, 837
- Maiolino et al. (1998) Maiolino R., Salvati M., Bassani L., Dadina M., della Ceca R., Matt G., Risaliti G., Zamorani G., 1998, A&A, 338, 781
- Marinucci et al. (2011) Marinucci A., Bianchi S., Matt G., Fabian A. C., Iwasawa K., Miniutti G., Piconcelli E., 2011, A&A, 526, A36
- Matt (2002) Matt G., 2002, MNRAS, 337, 147
- Matt et al. (2004) Matt G., Bianchi S., Guainazzi M., Molendi S., 2004, A&A, 414, 155
- Matt et al. (2000) Matt G., Fabian A. C., Guainazzi M., Iwasawa K., Bassani L., Malaguti G., 2000, MNRAS, 318, 173
- Matt et al. (1999) Matt G., Guainazzi M., Maiolino R., Molendi S., Perola G. C., Antonelli L. A., Bassani L., Brandt W. N., Fabian A. C., Fiore F., Iwasawa K., Malaguti G., Marconi A., Poutanen J., 1999, A&A, 341, L39
- Matt et al. (1991) Matt G., Perola G. C., Piro L., 1991, A&A, 247, 25
- Molendi et al. (2003a) Molendi S., Bianchi S., Matt G., 2003a, MNRAS, 343, L1
- Molendi et al. (2003b) Molendi S., Bianchi S., Matt G., 2003b, MNRAS, 343, L1
- Muñoz Marín et al. (2007) Muñoz Marín V. M., González Delgado R. M., Schmitt H. R., Cid Fernandes R., Pérez E., Storchi-Bergmann T., Heckman T., Leitherer C., 2007, AJ, 134, 648
- Murphy & Yaqoob (2009) Murphy K. D., Yaqoob T., 2009, MNRAS, 397, 1549
- Osterbrock & Ferland (2006) Osterbrock D., Ferland G. J., 2006, Astrophysics of gaseous nebulae and active galactic nuclei
- Panessa et al. (2006) Panessa F., Bassani L., Cappi M., Dadina M., Barcons X., Carrera F. J., Ho L. C., Iwasawa K., 2006, A&A, 455, 173
- Piconcelli et al. (2011) Piconcelli E., Bianchi S., Vignali C., Jiménez-Bailón E., Fiore F., 2011, A&A, 534, A126
- Piconcelli et al. (2004) Piconcelli E., Jimenez-Bailón E., Guainazzi M., Schartel N., Rodríguez-Pascual P. M., Santos-Lleó M., 2004, MNRAS, 351, 161
- Porquet & Dubau (2000) Porquet D., Dubau J., 2000, A&AS, 143, 495
- Pounds & Page (2005) Pounds K. A., Page K. L., 2005, MNRAS, 360, 1123
- Rose et al. (2015) Rose M., Elvis M., Crenshaw M., Glidden A., 2015, MNRAS, 451, L11
- Sako et al. (2000) Sako M., Kahn S. M., Paerels F., Liedahl D. A., 2000, ApJ, 543, L115
- Sambruna et al. (2001) Sambruna R. M., Netzer H., Kaspi S., Brandt W. N., Chartas G., Garmire G. P., Nousek J. A., Weaver K. A., 2001, ApJ, 546, L13
- Schmitt & Storchi-Bergmann (1995) Schmitt H. R., Storchi-Bergmann T., 1995, MNRAS, 276, 592
- Strüder et al. (2001) Strüder L., Briel U., Dennerl K., Hartmann R., Kendziorra E., Meidinger N., Pfeffermann E., Reppin C., Aschenbach B., Bornemann W., Bräuninger H., Burkert W., Elender M., 2001, A&A, 365, L18
- Tsunemi et al. (2001) Tsunemi H., Mori K., Miyata E., Baluta C., Burrows D. N., Garmire G. P., Chartas G., 2001, ApJ, 554, 496
- Turner et al. (2001) Turner M. J. L., Abbey A., Arnaud M., Balasini M., Barbera M., Belsole E., Bennie P. J., Bernard J. P., Bignami G. F., Boer M., Briel U., Butler I., Cara C., Chabaud C., Cole R., Collura A., Conte M., Cros A., Denby 2001, A&A, 365, L27
- Verner et al. (1996) Verner D. A., Ferland G. J., Korista K. T., Yakovlev D. G., 1996, ApJ, 465, 487
- Wilms et al. (2001) Wilms J., Reynolds C. S., Begelman M. C., Reeves J., Molendi S., Staubert R., Kendziorra E., 2001, MNRAS, 328, L27
- Yaqoob & Murphy (2011) Yaqoob T., Murphy K. D., 2011, MNRAS, 412, 277