What Powers Ly Blobs?††thanks: Herschel (Pilbratt et al. 2010) is an ESA space observatory with science instruments provided by European-led Principal Investigator consortia and with important participation from NASA.
Ly blobs (LABs) are spatially extended Ly nebulae seen at high redshift. The origin of Ly emission in the LABs is still unclear and under debate. To study their heating mechanism(s), we present Australia Telescope Compact Array (ATCA) observations of the 20 cm radio emission and Herschel PACS and SPIRE measurements of the far-infrared (FIR) emission towards the four LABs in the protocluster J2143-4423 at =2.38. Among the four LABs, B6 and B7 are detected in the radio with fluxes of 6717 Jy and 7716 Jy, respectively, and B5 is marginally detected at 3 (5116 Jy). For all detected sources, their radio positions are consistent with the central positions of the LABs. B6 and B7 are obviously also detected in the FIR. By fitting the data with different templates, we obtained redshifts of 2.20 for B6 and 2.20 for B7 which are consistent with the redshift of the Ly emission within uncertainties, indicating that both FIR sources are likely associated with the LABs. The associated FIR emission in B6 and B7 and high star formation rates strongly favor star formation in galaxies as an important powering source for the Ly emission in both LABs. However, the other two, B1 and B5, are predominantly driven by the active galactic nuclei or other sources of energy still to be specified, but not mainly by star formation. In general, the LABs are powered by quite diverse sources of energy.
Key Words.:
galaxies: formation – galaxies:high-redshift – galaxies:ISM – galaxies:active – infrared:galaxies1 Introduction
High-redshift star-forming galaxies are becoming an important probe of galaxy formation, reionization and cosmology (Robertson et al. 2010; Shapley 2011). A popular method for finding high redshift star forming galaxies is to target their often bright Ly emission (Partridge & Peebles 1967). This emission can be easily detected in narrow-band imaging surveys, and can be further confirmed by spectroscopic observations (Hu et al. 1998; Ouchi et al. 2008; Yamada et al. 2012a,b). In addition to discovering numerous Ly emitters (LAEs), a particular class of objects, also known as ”Ly blobs” (LABs), has been most commonly found in the dense environment of star-forming galaxies at high redshift, and they are very extended (30 to 200 kpc) and Ly-luminous (1043 to 1044 erg s-1) (see, e.g., Francis et al. 1996; Steidel et al. 2000; Palunas et al. 2004; Matsuda et al. 2004, 2009, 2011; Dey et al. 2005; Saito et al. 2006; Yang et al. 2009, 2010; Erb et al. 2011; Prescott et al. 2012a, 2013; Bridge et al. 2013). In contrast to the large Ly nebulae surrounding some high-redshift radio galaxies (e.g., Reuland et al. 2003; Venemans et al. 2007), these objects do not always have obvious sources for energy responsible for their strong emission.
While the LABs’ preferential location in overdense environments indicates an association with massive galaxy formation, the origin of Ly emission in the LABs is still unclear and under debate (Faucher-Giguere et al. 2010; Cen & Zheng 2013; Yajima et al. 2013). Proposed sources have generally fallen into two categories: cooling radiation from cold streams of gas accreting onto galaxies (e.g., Haiman et al. 2000; Dijkstra & Loeb 2009; Goerdt et al. 2010) and photoionization/recombination from starbursts or active galactic nuclei (AGNs) (e.g., Taniguchi & Shioya 2000; Furlanetto et al. 2005; Mori & Umemura 2006; Zheng et al. 2011). Supporting evidence for the cooling flow scenario comes from those LABs lacking any visible power source (e.g., Nilsson et al. 2006; Smith & Jarvis 2007). Ionizing photons from young stars in star-forming galaxies and/or AGNs can ionize neutral hydrogen atoms and the subsequent recombination gives off Ly emission. The resonant scattering of Ly photons in the circumgalactic medium makes the emission extended (Geach et al. 2005, 2009; Colbert et al. 2006, 2011; Beelen et al. 2008; Webb et al. 2009; Zheng et al. 2011; Cen & Zheng 2013; Overzier et al. 2013).
Except for cooling flows and photoionization from star-forming galaxies and/or AGNs, other possible mechanisms, such as galactic super-winds and obscured AGNs, are also proposed to explain the nature of the LABs (e.g., Ohyama et al. 2003; Wilman et al. 2005; Colbert et al. 2006; Matsuda et al. 2007). All these sources of energy may be activated in an environment where violent interactions are frequent between gas rich galaxies as expected in over-dense regions at high redshift (Matsuda et al. 2009, 2011; Prescott et al. 2012b; Kubo et al. 2013).
The 110 Mpc filament with 37 LAEs related to the protocluster J2143-4423 at =2.38 (Francis et al. 1996, 2004; Palunas et al. 2004) is one of the largest known structures at high redshift, and this field also includes four large extended LABs with extensions of 50 kpc and above, named B1, B5, B6 and B7. In this paper, we present our deep radio observations and Herschel released far-infrared (FIR) data in J2143-4423 to study the powering source of these LABs. Throughout this paper, we use a cosmology with = 67.3 , = 0.685 and = 0.315 (Planck Collaboration XVI 2013), and 1 corresponds to 8.37 kpc at =2.38.
2 Observations
2.1 ATCA observations
We observed J2143-4423 with the Australia Telescope Compact Array (ATCA)111The Australia Telescope Compact Array is part of the Australia Telescope, which is funded by the Commonwealth of Australia for operation as a National Facility managed by CSIRO. in its extended configuration 6A. During the observations from 2009 June 14 to 17, only five out of six antennas were available. The observations were performed at a central frequency of 1.75 GHz. We used the Compact Array Broadband Backend (Wilson et al. 2011) in a wide-band mode, with a total bandwidth of 2 GHz and a channel width of 1 MHz. The nearby source PKS 2134-470 served as a gain calibrator. Absolute fluxes were calibrated with the ATCA standard PKS 1934-638. The total observing time was about 70 hours.
The data were reduced with the MIRIAD software package. Although the observations were carried out with a total bandwidth of 2 GHz, the effective bandwidth was about 489 MHz with a central frequency of 1.51 GHz. We carefully flagged the channels affected by radio frequency interference (RFI) by checking the visibility data sorted by time, channels and baselines. The image was deconvolved with MIRIAD task MFCLEAN, and task SELFCAL was used to reduce the noise from strong radio continuum sources. We first created cleaned images in a normal procedure and made model images for the strong sources. The models were used as inputs for task SELFCAL to perform self-calibration of visibility data. We ran this cycle for three times, and then obtained the model images to create the visibility data with self-calibration, which were used to make the final images. The noise of the images after applying self-calibration was about one order of magnitude lower than that without self-calibration. The field of view was about 31 arcmins and the synthesized beam size was 7.84.8. The noise was about 15 Jy/beam before applying primary beam correction.

2.2 Archival Herschel observations
Herschel observations towards J2143-4423 were carried out with PACS (Poglitsch et al. 2010) at 100 and 160 m and SPIRE (Griffin et al. 2010) at 250, 350 and 500 m in 2010 to 2011. J2143-4423 was imaged in a field size of 15′15′ for each band, and the observing time was 2.9 hours for PACS (Herschel OD: 686) and 0.6 hours for SPIRE (Herschel OD: 558). The level 2.5 product for PACS and the level 2 product for SPIRE from the pipeline procedures are used for our data analysis. Source photometry is carried out using DAOphot algorithm in the Herschel Interactive Processing Environment (HIPE). We apply beam correction, colour correction, aperture correction for a spectral index of 2 and adopt a flux calibration error of 5% at PACS bands and 7% at SPIRE bands as recommended in the PACS and SPIRE Observer’s Manual. The full width at half power (FWHP) beam sizes are 6.8 at 100 m, 11.4 at 160 m, 17.6 at 250 m, 23.9 at 350 m and 35.2 at 500 m, respectively.
3 Results
3.1 Radio emission from ATCA observations
In Fig. 1(a) we present the radio continuum emission images at 20 cm from the ATCA. Among the four LABs, B6 and B7 are detected with fluxes of 6717 Jy and 7716 Jy, respectively, and B5 is marginally detected at 3 (5116 Jy). For all detected sources, their positions are consistent with the central positions of the LABs. Only B1 is not detected by the observations.
3.2 FIR emission from Herschel observations
All four LABs are observed with Herschel PACS at 100 and 160 m and SPIRE at 250, 350 and 500 m, and the images are shown in Fig. 1(c-g). The observed flux densities are calculated for the areas within the blue circles as shown in Fig. 1 and are listed in Table 1. B1 is not detected but contaminated by a nearby strong source about 20 in the north-west, which is the background QSO LBQS2138-4427 at = 3.2 (Francis & Hewett 1993), and its emission features at different FIR bands appear to reach out to B1 from this location. There is no FIR counterpart for B5 in any Herschel band.
| Source | 20 cmb | 100 m | 160 m | 250 m | 350 m | 500 m | c | Mdust |
|---|---|---|---|---|---|---|---|---|
| [Jy] | [mJy] | [mJy] | [mJy] | [mJy] | [mJy] | [1012] | [M⊙] | |
| B1 | 51 | 4.2 | 9.0 | 17.9 | 19.6 | 22.5 | 2.8 | |
| B5 | 5116 | 2.1 | 11.1 | 17.5 | 18.7 | 19.8 | 2.5 | |
| B6 | 6717 | 13.23.2 | 53.98.0 | 49.79.0 | 53.710.7 | 36.710.3 | 10.01.9 | 3.20.6 |
| B7 | 7716 | 12.94.0 | 33.510.0 | 41.67.8 | 48.010.6 | 39.28.6 | 8.62.3 | 5.01.0 |
-
a The wavelengths shown in this table are the redshifted values.
-
b Measured fluxes have been modified by a primary beam correction (less than 15%).
-
c The total luminosities are calculated between rest frame wavelengths of 40 m to 200 m from the dust models (see 3.4 for details). The 3 upper limits are given for undetected sources.
3.3 Redshifts of the FIR sources
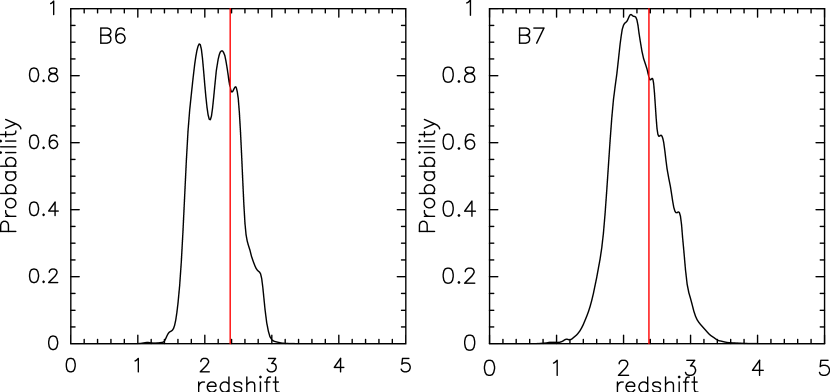
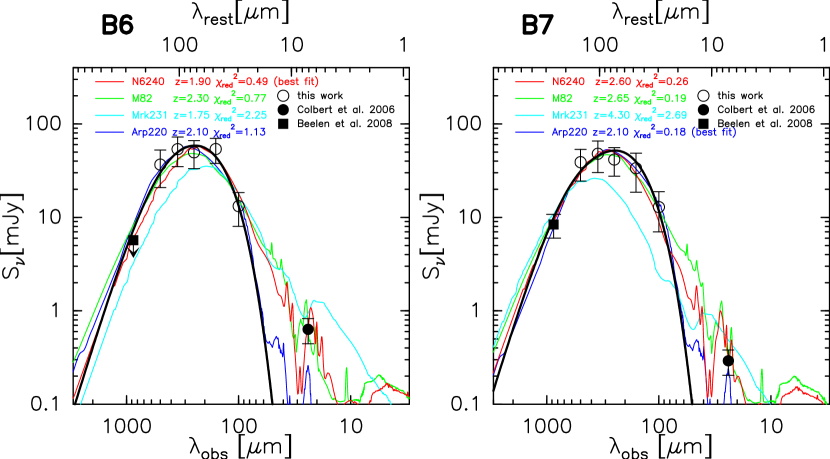
To estimate the redshift of the FIR sources associated with B6 and B7, we try to fit the data with the SEDs of different templates (Polletta et al. 2007) at different redshifts and find that the starburst templates can well reproduce the data. With the observational data and the SEDs of the templates, the minimum reduced value for each redshift can be calculated and the corresponding probability can be estimated. In this analysis, we include five Herschel band, APEX 870 m data (Beelen et al. 2008), and Spitzer MIPS 24 m data (Colbert et al. 2006).
Among four typical templates, Arp 220, M 82, Mrk 231 and NGC 6240, we find that the spectral energy distribution of starburst galaxies NGC 6240 and Arp 220 fit the data best, and Mrk 231 doesn’t fit well because it has warm IR emission from its AGN which is not really consistent with the data. Fig. 2 shows the probability distribution against redshift for both LABs. The estimated redshifts are 2.20 for B6 and 2.20 for B7 respectively. Considering the uncertainty of this method to determine the redshifts, both values are consistent with the Ly redshift of 2.38 of the LABs. Adopting the number count study of Herschel sources in Clements et al. (2010), the probability of finding a 350 m source with a flux greater than 40 mJy within 20 arcsec is 2%. According for such a low number density of strong FIR sources and the positional coincidence of the LABs with strong FIR sources, the FIR sources are very likely associated with the LABs. Nevertheless, future spectroscopic observations from molecular lines at millimeter or from forbidden lines at near-infrared will be quite important to confirm it. In the following sections, the Ly redshift of 2.38 will be adopted for the LABs.
3.4 Dust properties
For B6 and B7, we have included the measurements from the five Herschel bands as well as the 870 m data taken from Beelen et al. (2008) in the dust continuum analysis using a single-component dust model as described in Weiß et al. (2007). Spitzer MIPS 24 m data (Colbert et al. 2006) are not used in the model fitting because they are strongly affected by PAH features, but are shown in Fig. 3 to allow for a better comparison with overlaid templates. We find a dust temperature, , of 705 K and a dust mass, Mdust, of (3.20.8)108 M⊙ for B6, and = 705 K and Mdust = (5.01.0)108 M⊙ for B7, respectively. The implied FIR luminosities are = (10.01.9)1012 for B6, and = (8.62.3)1012 for B7, respectively, where is integrated from 40 m to 200 m in the rest frame. The upper limits for both B1 and B5 are 2.52.81012 .
3.5 Star formation rates
Here we derive the star formation rates from the Ly, far-infrared and radio luminosities. To estimate the star formation rate (SFR) from the Ly luminosity, we first assume that star formation (SF) powers the observed Ly flux. We use an unreddened Ly/H ratio of 8:1 and the conversion factor between H luminosity and SFR (Kennicutt 1998), yielding SFR()/(M⊙/yr) = /(1042 erg s-1). This provides a lower limit because the extinction of Ly emission caused by dust will largely reduce the observed Ly luminosity. With the FIR luminosity derived from Herschel data, we can estimate the SFR by using the relation SFR()/(M⊙/yr) = /(1010 ) (Kennicutt 1998). If the observed radio emission, with a rest wavelength of 6 cm, is dominated by free-free emission in HII regions, one can also relate the SFR by the relation SFR()/(M⊙/yr) = 5.5210-22 /(W Hz-1) (Bell 2003). The radio luminosity at 1.4 GHz at the rest frame can be estimated from the observed flux at 1.51 GHz by assuming a relation , where S is the flux density and the typical spectral index of 0.8 is commonly adopted for the SMGs (e.g., Ivison et al. 2010). These values are listed in Table 2.
| Source | SFR() | SFR() | log a | SFR() |
|---|---|---|---|---|
| [M⊙/yr] | [M⊙/yr] | [ergs s-1] | [M⊙/yr] | |
| B1 | 480 | 1090 | 43.9 | 79 |
| B5 | 430 | 1090340 | 43.8 | 63 |
| B6 | 1700320 | 1430360 | 43.8 | 63 |
| B7 | 1460390 | 1650340 | 43.5 | 32 |
-
a The Ly luminosities are adopted from Colbert et al. (2006).
4 Discussion and Conclusions
A high detection rate of radio emission (three out of four) around LABs suggests that most LABs do not originate from cooling radiation. Instead, photoionization from starbursts and/or AGNs may power the LABs in most cases. The high rate of FIR detections (two out of four) points to a star-formation origin of the LABs. The SEDs of B6 and B7 can be well described by starburst dominated templates, as shown in Fig. 3, further supporting Ly emission related to the SF in the LABs. In B6 and B7, the SFRs derived from Ly fluxes are far below those estimated from FIR luminosities (Table 2). This suggests that the dust indeed greatly reduces the measured Ly flux. Comparing the different SFRs, the dust absorption optical depth of the Ly emission becomes 3.13.6. The SFRs estimated from the FIR and radio luminosities are comparable, indicating that the radio emission is dominated by SF, not by AGNs. The energetic starbursts can provide enough ionizing photons to ionize neutral hydrogen atoms in the interstellar medium (ISM), and each subsequent recombination has a probability of 2/3 of ending up as a Ly photon (Partridge & Peebles 1967). After escaping the galaxy’s ISM, these Ly photons can be resonantly scattered by neutral hydrogen atoms in the intergalactic medium (IGM), which tends to make the Ly emission extended (Zheng et al. 2011).
Cen & Zheng (2013) propose an SF-based model and predict that LABs at high redshift correspond to protoclusters containing the most massive galaxies and cluster halos in the early universe as well as ubiquitous strong infrared sources undergoing extreme starbursts. This may be supported by the multiple Spitzer/MIPS sources detected in both LABs (see Fig 1(b), Colbert et al. 2006, 2011). Indeed, Prescott et al. (2012b) suggest that LABs may be the seeds of galaxy clusters by resolving the galaxies within a LAB at = 2.7. The strong FIR emission and the inferred high SFRs support the presence of a strong starburst in both B6 and B7. However, AGN-dominated templates like Mrk 231 can not well reproduce the data (see 3.3), suggesting that the SF instead of AGN may power the Ly emission in both LABs. The model also predicts that the most luminous FIR source in each LAB is likely representing the gravitational center of the protocluster. Fig. 1(c-g) shows that the FIR emission indeed peaks in the centers of B6 and B7. The radio continuum emission is detected exclusively in the centers, which suggests that the source with most luminous FIR emission (therefore highest SFR) is in the gravitational center of each LAB. Another very important prediction of this model is that the Ly emission from photons that escape the galaxy are expected to be significantly polarized, which has been for the first time confirmed towards LAB1 in the SSA22 field by Hayes et al. (2011), supporting models with central power sources. Adopting a gas-to-dust mass ratio of 150 and the SFRs estimated above, the timescales of B6 and B7 are relatively short (100 Myr), which is much shorter than the galaxy building timescale. Note that this timescale is a lower limit because (1) the LABs may have been alive for a while now, and (2) additional gas may be continuously accreted. In any case, the LABs are visible only during a short time interval during the lifetime of their parent clusters.
Note that the so-called “SF-based model” proposed by Cen & Zheng (2013) also includes AGN powering or any central powering. The morphologies of the Ly emission of the four LABs are quite different (Palunas et al. 2004): B1 and B5 have core-like structures, while B6 and B7 are characterized by diffuse and extended emission with physical sizes of 60-70 kpc. The latter may be driven by multiple sources as suggested by the MIPS data and are consistent with the SF-based model. There is no clear FIR emission detected around B1 and B5. Therefore, the Ly emission in both LABs is unlikely predominantly triggered by SF. Overzier et al. (2013) conclude that in B1 the photoionization from an AGN is the main driver of Ly emission. However, Francis et al. (2013) shows that the observed Ly emission in B1 is of complex origin, dominated by the sum of the emission from the sub-haloes where the cold gas is being lit up most likely by a combination of tidally triggered star formation, bow shocks, resonant scattering of Ly from the filament collisions and tidal stripping of the gas. In B5 radio emission is tentatively detected and therefore the AGN may also power the Ly emission. Among the four LABs in J2143-4423, two of them, B6 and B7, are mainly driven by SF. However, the other two LABs, B1 and B5, without clear FIR detection, are predominantly driven by the AGNs or other sources of energy still to be specified, but not mainly by star formation. We thus conclude that LABs must be powered by quite diverse sources of energy.
With its high angular resolution and superb sensitivity, future observations with the Large Atacama Millimeter Array (ALMA) will reveal more details about the nature of LABs such as testing the predictions of models where the ionization is provided by intense star formation and confirming the significantly polarized dust emission at mm/submm wavelength.
Acknowledgements.
We thank the anonymous referee for valuable comments that improved this manuscript. Y.A. acknowledges partial support by NSFC grant 11373007 and Youth Innovation Promotion Association CAS. R.C. is supported in part by NASA grant NNX11AI23G. Y.M. acknowledges support from JSPS KAKENHI Grant Number 20647268. ZZ was partially supported by NSF grant AST-1208891 and NASA grant NNX14AC89G. This research has made use of NASA’s Astrophysical Data System (ADS). PACS has been developed by a consortium of institutes led by MPE (Germany) and including UVIE (Austria); KU Leuven, CSL, IMEC (Belgium); CEA, LAM (France); MPIA (Germany); INAF-IFSI/OAA/OAP/OAT, LENS, SISSA (Italy); IAC (Spain). This development has been supported by the funding agencies BMVIT (Austria), ESA-PRODEX (Belgium), CEA/CNES (France), DLR (Germany), ASI/INAF (Italy), and CICYT/MCYT (Spain). SPIRE has been developed by a consortium of institutes led by Cardiff University (UK) and including Univ. Lethbridge (Canada); NAOC (China); CEA, LAM (France); IFSI, Univ. Padua (Italy); IAC (Spain); Stockholm Observatory (Sweden); Imperial College London, RAL, UCL-MSSL, UKATC, Univ. Sussex (UK); and Caltech, JPL, NHSC, Univ. Colorado (USA). This development has been supported by national funding agencies: CSA (Canada); NAOC (China); CEA, CNES, CNRS (France); ASI (Italy); MCINN (Spain); SNSB (Sweden); STFC, UKSA (UK); and NASA (USA).References
- (1) Beelen, A., Omont, A., Bavouzet, N., et al. 2008, A&A, 485, 645
- (2) Bell, E. F. 2003, ApJ, 586, 794
- (3) Bridge, C. R., Blain, A., Borys, C. J. K., et al. 2013, ApJ, 769, 91
- (4) Cen, R., & Zheng, Z. 2013, ApJ, 775, 112
- (5) Clements, D. L., Rigby, E., Maddox, S., et al. 2010, A&A, 518, L8
- (6) Colbert, J. W., Teplitz, H., Francis, P., et al. 2006, ApJ, 637, L89
- (7) Dey, A., Bian, C., Soifer, B. T., et al. 2005, ApJ, 629, 654
- (8) Dijkstra, M., & Loeb, A. 2009, MNRAS, 400, 1109
- (9) Erb, D. K., Bogosavljević, M., & Steidel, C. C. 2011, ApJ, 740, L31
- (10) Faucher-Giguère, C.-A., Kereš, D., Dijkstra, M., Hernquist, L., & Zaldarriaga, M. 2010, ApJ, 725, 633
- (11) Francis, P. J., Dopita, M. A., Colbert, J. W., et al. 2013, MNRAS, 428, 28
- (12) Francis, P. J., & Hewett, P. C. 1993, AJ, 105, 1633
- (13) Francis, P. J., Palunas, P., Teplitz, H. I., Williger, G. M., & Woodgate, B. E. 2004, ApJ, 614, 75
- (14) Francis, P. J., Woodgate, B. E., Warren, S. J., et al. 1996, ApJ, 457, 490
- (15) Furlanetto, S. R., Schaye, J., Springel, V., & Hernquist, L. 2005, ApJ, 622, 7
- (16) Geach, J. E., Alexander, D. M., Lehmer, B. D., et al. 2009, ApJ, 700, 1
- (17) Geach, J. E., Matsuda, Y., Smail, I., et al. 2005, MNRAS, 363, 1398
- (18) Goerdt, T., Dekel, A., Sternberg, A., et al. 2010, MNRAS, 407, 613
- (19) Griffin, M. J., Abergel, A., Abreu, A., et al. 2010, A&A, 518, L3
- (20) Hayes, M., Scarlata, C., & Siana, B. 2011, Nature, 476, 304
- (21) Haiman, Z., Spaans, M., & Quataert, E. 2000, ApJ, 537, L5
- (22) Hu, E. M., Cowie, L. L., & McMahon, R. G. 1998, ApJ, 502, L99
- (23) Ivison, R. J., Magnelli, B., Ibar, E., et al. 2010, A&A, 518, L31
- (24) Kennicutt, R. C., Jr. 1998, ARA&A, 36, 189
- (25) Kubo, M., Uchimoto, Y. K., Yamada, T., et al. 2013, ApJ, 778, 170
- (26) Matsuda, Y., Iono, D., Ohta, K., et al. 2007, ApJ, 667, 667
- (27) Matsuda, Y., Nakamura, Y., Morimoto, N., et al. 2009, MNRAS, 400, L66
- (28) Matsuda, Y., Yamada, T., Hayashino, T., et al. 2011, MNRAS, 410, L13
- (29) Matsuda, Y., Yamada, T., Hayashino, T., et al. 2004, AJ, 128, 569
- (30) Mori, M., & Umemura, M. 2006, Nature, 440, 644
- (31) Nilsson, K. K., Fynbo, J. P. U., Møller, P., Sommer-Larsen, J., & Ledoux, C. 2006, A&A, 452, L23
- (32) Ohyama, Y., Taniguchi, Y., Kawabata, K. S., et al. 2003, ApJ, 591, L9
- (33) Ouchi, M., Shimasaku, K., Akiyama, M., et al. 2008, ApJS, 176, 301
- (34) Overzier, R. A., Nesvadba, N. P. H., Dijkstra, M., et al. 2013, ApJ, 771, 89
- (35) Palunas, P., Teplitz, H. I., Francis, P. J., Williger, G. M., & Woodgate, B. E. 2004, ApJ, 602, 545
- (36) Partridge, R. B., & Peebles, P. J. E. 1967, ApJ, 147, 868
- (37) Planck Collaboration, Ade, P. A. R., Aghanim, N., et al. 2013, arXiv:1303.5076
- (38) Poglitsch, A., Waelkens, C., Geis, N., et al. 2010, A&A, 518, L2
- (39) Polletta, M., Tajer, M., Maraschi, L., et al. 2007, ApJ, 663, 81
- (40) Prescott, M. K. M., Dey, A., Brodwin, M., et al. 2012b, ApJ, 752, 86
- (41) Prescott, M. K. M., Dey, A., & Jannuzi, B. T. 2013, ApJ, 762, 38
- (42) Prescott, M. K. M., Dey, A., & Jannuzi, B. T. 2012a, ApJ, 748, 125
- (43) Reuland, M., van Breugel, W., Röttgering, H., et al. 2003, ApJ, 592, 755
- (44) Riechers, D. A., Bradford, C. M., Clements, D. L., et al. 2013, Nature, 496, 329
- (45) Robertson, B. E., Ellis, R. S., Dunlop, J. S., McLure, R. J., & Stark, D. P. 2010, Nature, 468, 49
- (46) Saito, T., Shimasaku, K., Okamura, S., et al. 2006, ApJ, 648, 54
- (47) Shapley, A. E. 2011, ARA&A, 49, 525
- (48) Smith, D. J. B., & Jarvis, M. J. 2007, MNRAS, 378, L49
- (49) Spergel, D. N., Bean, R., Doré, O., et al. 2007, ApJS, 170, 377
- (50) Steidel, C. C., Adelberger, K. L., Shapley, A. E., et al. 2000, ApJ, 532, 170
- (51) Taniguchi, Y., & Shioya, Y. 2000, ApJ, 532, L13
- (52) Tielens, A. G. G. M. 2005, The Physics and Chemistry of the Interstellar Medium, by A. G. G. M. Tielens, pp. . ISBN 0521826349. Cambridge, UK: Cambridge University Press, 2005.,
- (53) Venemans, B. P., Röttgering, H. J. A., Miley, G. K., et al. 2007, A&A, 461, 823
- (54) Webb, T. M. A., Yamada, T., Huang, J.-S., et al. 2009, ApJ, 692, 1561
- (55) Weiß, A., Downes, D., Neri, R., et al. 2007, A&A, 467, 955
- (56) Wilman, R. J., Gerssen, J., Bower, R. G., et al. 2005, Nature, 436, 227
- (57) Wilson, W. E., Ferris, R. H., Axtens, P., et al. 2011, MNRAS, 416, 832
- (58) Yajima, H., Li, Y., & Zhu, Q. 2013, ApJ, 773, 151
- (59) Yamada, T., Matsuda, Y., Kousai, K., et al. 2012a, ApJ, 751, 29
- (60) Yamada, T., Nakamura, Y., Matsuda, Y., et al. 2012b, AJ, 143, 79
- (61) Yang, Y., Zabludoff, A., Eisenstein, D., & Davé, R. 2010, ApJ, 719, 1654
- (62) Yang, Y., Zabludoff, A., Tremonti, C., Eisenstein, D., & Davé, R. 2009, ApJ, 693, 1579
- (63) Zheng, Z., Cen, R., Weinberg, D., Trac, H., & Miralda-Escudé, J. 2011, ApJ, 739, 62