A Stacked Search for Intermediate-Mass Black Holes in 337 Extragalactic Star Clusters
Abstract
Forbes et al. recently used the Hubble Space Telescope to localize hundreds of candidate star clusters in NGC 1023, an early-type galaxy at a distance of 11.1 Mpc. Old stars dominate the light of 92% of the clusters and intermediate-age stars dominate the light of the remaining 8%. Theory predicts that clusters with such ages can host intermediate-mass black holes (IMBHs) with masses . To investigate this prediction, we used 264 s of 5.5 GHz data from the Karl G. Jansky Very Large Array (VLA) to search for the radiative signatures of IMBH accretion from 337 candidate clusters in an image spanning 492″ (26 kpc) with a resolution of 040 (22 pc). None of the individual clusters are detected, nor are weighted-mean image stacks of the 311 old clusters, the 26 intermediate-age clusters, and the 20 clusters with stellar masses . The clusters thus lack radio analogs of HLX-1, a strong IMBH candidate in a cluster in the early-type galaxy ESO 243-49. This suggests that HLX-1 is accreting gas related to its cluster’s light-dominating young stars. Alternatively, the HLX-1 phenomenon could be so rare that no radio analog is expected in NGC 1023. Also, using a formalism heretofore applied to star clusters in the Milky Way, the radio-luminosity upper limit for the massive-cluster stack corresponds to a 3 IMBH mass of , suggesting black-hole mass fractions of .
1 Motivation
Constraints on populations of low-mass black holes (BHs) are important for understanding formation channels for seed BHs in the early Universe and the demographics of relic seed BHs in the local Universe (reviewed by Greene, 2012; Volonteri, 2012). Such seeds are referred to as intermediate-mass black holes (IMBHs) because they occupy the gap in mass between the well-studied stellar-mass BHs with and the well-established supermassive BHs with . In addition, if the scaling relations between central BHs and their host stellar systems differ between the intermediate-mass and supermassive ends, then this could provide clues about the co-evolution, or not, of these entities (e.g., Xiao et al., 2011; Jiang et al., 2011; Kormendy & Ho, 2013).
Of particular interest here are the theoretical predictions that dense star clusters could host IMBHs formed either slowly through the successive mergers of stellar-mass BHs (Miller & Hamilton, 2002) or rapidly through the runaway collisions of massive stars in the cluster centers (Gurkan et al., 2004; Portegies Zwart et al., 2004). In addition, if IMBHs exist in star clusters, the inspiral of stellar-mass BHs into IMBHs is expected to be a key source of gravitational waves for planned space missions (e.g., Konstantinidis et al., 2013). Overall, finding IMBHs in star clusters could validate a theoretical formation channel, bolster gravitational-wave predictions, and test scaling relations between stellar systems and the central BHs they host.
At distances of about 10 Mpc, future near-infrared telescopes will be able to measure BH masses as low as by resolving their spheres of influence in their host stellar systems (Do et al., 2014). While this is expected to lead to a robust inventory of IMBHs in the local Universe, these next-generation facilities are still many years off. Moreover, such sphere-of-influence studies have already been applied to star clusters in the Local Group, and all these studies are controversial (Strader et al., 2012a, and references therein).
Due to these on-going controversies and not wanting to wait for future facilities, we are pursuing an independent route, namely searching for radio signatures of accretion onto putative IMBHs in extragalactic star clusters (Maccarone, 2004). Analogies with stellar-mass BHs suggest that an IMBH will spend more time in the hard X-ray state associated with a low accretion rate, than in the soft X-ray state associated with a high accretion rate (reviewed by Fender & Belloni, 2012). If only a few radio observations are available, they are more likely to sample the steady radio emission associated with the hard X-ray state, as compared to the flaring radio emssion associated with a transition from the hard X-ray state to the soft X-ray state. We thus take three approaches, as follows:
-
1.
Radio emission resembling that from HLX-1 in its hard X-ray state (Cseh et al., 2015) could be directly detected from an individual cluster.
- 2.
- 3.
In this paper, we use the Karl G. Jansky Very Large Array (VLA; Perley et al., 2011) to search for radio emission from hundreds of candidate star clusters localized by Forbes et al. (2014) in a mosaic of NGC 1023 (catalog NGC1023) with the Advanced Camera for Surveys (ACS) on the Hubble Space Telescope (HST). We focus on NGC 1023 because it is one of only a few early-type galaxies with such an extensive ACS mosaic (Forbes et al., 2014) and, at a distance of 11.1 Mpc, is amongst the nearest galaxies in the extensive VLA survey of K. Nyland et al. (2015, in preparation). At this distance 1″ = 53.8 pc.
After folding in prior information (Larsen & Brodie, 2000; Larsen, 2001; Larsen & Brodie, 2002; Brodie & Larsen, 2002; Morganti et al., 2006; Chies-Santos et al., 2013), Forbes et al. (2014) divide their candidate star clusters by age: stars older than 5 Gyr dominate the light of 92% of the clusters, whereas stars with ages of a few hundred Myr dominate the light of the remaining 8%. Those latter intermediate-age clusters may have formed during a recent gas-rich interaction between NGC 1023 and its companion NGC 1023A, with a projected offset of (8 kpc). Still, the vast majority of the clusters are dominated by an old, globular-cluster-like stellar population. Using that population’s z-band (F850LP) mass-to-light ratio from Jordan et al. (2007) and magnitudes from Forbes et al. (2014), the stellar masses of the clusters range from to . It is also important to underscore that only a handful of the candidate clusters have had their association with NGC 1023 or its companion confirmed spectroscopically. Liu (2011) used Chandra data to localize several dozen X-ray sources but did not attempt to match those sources with candidate star clusters.
2 Imaging
The A configuration of the VLA was used to observe NGC 1023 on 2012 October 3 UT as part of an extensive survey for low-luminosity active galactic nuclei in early-type galaxies (proposal code 12B-281, PI K. Nyland). Full details will appear in K. Nyland et al. (2015, in preparation) but key aspects are given here. The observations were made assuming a coordinate equinox of 2000 and were phase referenced to the calibrator J0230+4032 at an assumed position of and with one-dimensional errors at 1 of 2 mas. The switching angle between NGC 1023 and J0230+4032 was . One observation of NGC 1023 was immediately preceeded and followed by observations of J0130+0432, leading to a net exposure time on NGC 1023 of 264 s. Every 1 s the correlator generated 1024 contiguous 2 MHz channels, resulting in a total bandwidth of 2.048 GHz per circular polarization centered at a frequency of 5.5 GHz. Observations of 3C 48 were also acquired to set the amplitude scale to an estimated accuracy of about 3%. All but one of the 27 antennas provided data of acceptable quality. Given the observing strategies, the one-dimensional astrometric error at 1 is estimated to be .
Release 4.1.0 of the Common Astronomy Software Applications (CASA) package (McMullin et al., 2007) was used to calibrate and edit the visibility data in version 1.2.0 of an automated pipeline.111 https://science.nrao.edu/facilities/vla/data-processing/pipeline The CASA task clean was used to form and deconvolve an image of the Stokes emission from NGC 1023 that spanned , well matched to the HST mosaic (Forbes et al., 2014). The CASA task clean was run with (1) a robustness parameter of 0.5 to obtain the best compromise among sensitivity, spatial resolution and sidelobe suppression; (2) an nterms parameter of 2 to account for the large fractional bandwidth; and (3) the gridmode parameter set to “widefield” and the wprojplanes parameter set to 128 to correct for the effects of non-coplanar baselines.
The CASA task widebandpbcor was then run to correct the VLA image for primary beam attenuation, characterized by a half-power diameter of where the attenuation is 50% and thus the correction is 200%. For comparison, at that location the response to a point source is estimated to be reduced by about 2% due to bandwidth smearing across 2 MHz channels and by less than 1% due to time averaging over 1 s integrations,222 https://science.nrao.edu/facilities/vla/docs/manuals/oss/performance/fov and no corrections were made for these negligible effects. A square image spanning the half-power diameter of the primary beam on each axis was used for subsequent analysis.
This VLA image at 5.5 GHz captured 339 star cluster candidates identified and cataloged by Forbes et al. (2014). For each of those clusters, the 2015 December 31 release of NRAO’s Astronomical Image Processing System (AIPS; Greisen, 2003) was used to form a cutout, with task subim, spanning and centered on the optical position (Forbes et al., 2014). The ACS images were astrometrized by matching the extracted sources with CFHT archival catalogs with one-dimensional errors at 1 estimated to be 015 (V. Pota, 2014, priv. comm.). The cutout for cluster ID 39 in the nomenclature of Forbes et al. (2014) was dropped from further analysis because it was contaminated by a 5.5-GHz counterpart to a background QSO (Larsen & Brodie, 2002). The radio and optical positions of this background QSO differed by , consistent with the error estimates quoted above for the radio and optical systems. ID 58 was located too close to the edge of the VLA image to form a cutout and was also dropped from further analysis. After this culling, 337 cutouts remain for an analysis of individual clusters (Figure 1). The 1 rms noise level amongst the cutouts has a range of 16-68 Jy beam-1, reflecting the primary beam attenuation. To minimize the risk of a false-positive detection of one or more individual clusters when examining an ensemble of 337, we adopt an individual one-tail detection threshold of 3.5 (Wall & Jenkins, 2003).

3 Implications
None of the 337 candidate clusters in NGC 1023 is detected above its local 3.5 level at 5.5 GHz (Figure 1). The corresponding 3.5 radio luminosities are erg s-1 (Figure 2). Such a luminosity definition implicitly assumes a flat radio continuum spectrum up to 5.5 GHz.

For the 311 old clusters, all accreting stellar-mass compact objects, whether in the hard X-ray state (Strader et al., 2012b) or associated with a transition from the hard X-ray state to the soft X-ray state (Corbel et al., 2012), would have radio luminosities too faint to be detected. For the 26 intermediate-age clusters, no other data are available for comparison. However, Kepley et al. (2014) showed that the massive star clusters in II Zw 40 at a distance of 10.5 Mpc have shed their enshrouding nebular emission by an age of 10 Myr. Specifically, the 10-Myr old cluster SSC-South in II Zw 40 is not detected at 4.9 GHz and has a radio-luminosity upper limit of erg . This strongly suggests that NGC 1023’s ten-times-older clusters should lack contamination from free-free nebular emission. Thus, overall, we expect no contaminants for the star clusters in Figure 1, allowing us to explore the implications of the nondetections within the contexts of analogs of HLX-1 (§ 3.1), X-ray detected clusters (§ 3.2), and predictions of a semi-empirical model (§ 3.3).
3.1 HLX-1 Analogs
HLX-1 is a strong IMBH candidate with that is hosted by a cluster with a stellar mass of (Farrell et al., 2009; Soria et al., 2010; Wiersema et al., 2010; Farrell et al., 2012; Soria et al., 2012; Farrell et al., 2014). The stellar mass of the host cluster resembles those of the clusters in NGC 1023, but the age of the host cluster’s light-dominating stars, about 20 Myr, is significantly younger.
When transitioning from its hard to soft X-ray states, HLX-1 can achieve a luminosity at 7 GHz of erg s-1 (Webb et al., 2012). Such a level is incompatible with the 5.5-GHz upper limits for individual star clusters in NGC 1023 (Figure 2).
In its hard X-ray state, a combination of four measurements of HLX-1 yields a luminosity at 6.8 GHz of erg s-1, with no significant evidence for variability over several days or months (Cseh et al., 2015). This steady luminosity is also incompatible with the upper limits for individual star clusters in NGC 1023. As Cseh et al. (2015) argue, this steady emission from HLX-1 is likely Doppler boosted by a factor of about five to ten, implying a side-on luminosity of about erg s-1. If such a side-on luminosity was present in any of the 337 individual clusters in NGC 1023, Figure 2 shows that it could escape detection in only a single cluster.
It is important to highlight the advantages of radio searches for steady emission from HLX-1 analogs: its hyperluminous X-ray luminosity of erg s-1 is achieved only during a 2-3 week soft state that occurs approximately yearly (Godet et al., 2014) and can thus be missed if only a few X-ray observations are made. In contrast, steady radio emission should be present during most of the year between soft X-ray states, making it easier to detect even in a single radio observation, the situation for NGC 1023. Also, at the distance of NGC 1023, the hyperluminous X-ray luminosity of HLX-1 is below the sensitivity threshold of current and past X-ray all-sky monitors, blocking those discovery routes.
Even more stringent constraints on HLX-1 analogs in NGC 1023 come from the weighted-mean image stacks (e.g., Lindroos et al., 2015) in Figure 3 for the 311 old clusters and in Figure 4 for the 26 intermediate-age clusters. The stacks, which measure the mean contribution to the total radio emission from each cluster population, were made using the AIPS task comb. The stacks’ 3 upper limits correspond to radio luminosities of erg s-1 and erg s-1. These stacks rule out emission from a population of HLX-1 analogs amongst either cluster population.


The light-dominating stars in the clusters in NGC 1023 are at least a factor of ten older than the 20-Myr-old stars in the cluster hosting HLX-1 (Farrell et al., 2014). So one could speculate that if IMBHs exist in NGC 1023 clusters, those older clusters have lost their IMBHs due to graviational wave recoil. However, for an IMBH as massive as HLX-1, , ejection from the cluster is very improbable (Holley-Bockelmann et al., 2008). Instead, the absence of HLX-1 analogs in NGC 1023 suggests that HLX-1 is accreting gas somehow related to the young stars in its host cluster. An enhanced gas supply could arise from material remaining after the burst of star formation 20 Myr ago, or from material donated by a young stellar companion, as advocated by Miller et al. (2014).33320 Myr is approximately the main sequence lifetime of a 12 star (e.g., Ford & Bregman, 2013). Either way, such an enhanced fuel supply would not be available to the IMBHs, if any exist, in the star clusters in NGC 1023. Alternatively, it might be that the HLX-1 phenomenon is so rare that a radio analog is simply not expected in NGC 1023.
3.2 X-ray Detected Clusters
Cluster IDs 153, 176 and 305 in the nomenclature of Forbes et al. (2014) have X-ray detections, all of hard-state emission (Liu, 2011). Using the empirical fundamental-plane regression for the contracted sample of Plotkin et al. (2012), the clusters’ X-ray luminosities from Liu (2011) and radio-luminosity upper limits from Figure 2 imply individual 3 IMBH masses of . These clusters have old stellar populations and estimated stellar masses of or less. But a star cluster is unlikely to host an IMBH whose mass is comparable to, or exceeds, its stellar mass (Miller & Hamilton, 2002), so these IMBH mass constraints are not physically interesting. Future imaging that reaches clusters with lower X-ray luminosities would be especially beneficial.
3.3 Semi-Empirical Model
Following Maccarone & Servillat (2008, 2010) and Strader et al. (2012a), we use a semi-empirical model to predict the mass of a putative IMBH that, if undergoing hard-X-ray-state accretion in a gas-poor cluster, is consistent with the upper limit on the radio luminosity. Specifically, we conservatively assume that the IMBH undergoes accretion at a fraction of the Bondi rate from a tenuous, globular-cluster-like medium with a gas density cm-3. The rationale for these assumptions and their uncertainties are discussed in section 3.4 of Strader et al. (2012a). These parameters yield a prediction for the hard-state X-ray luminosity . The empirical fundamental-plane regression for the contracted sample of Plotkin et al. (2012) is then used to predict the associated radio luminosity . (Using an earlier regression, Maccarone & Servillat (2010) demonstrate that .) A detection or upper limit to a radio luminosity thus maps to a detection or upper limit to an IMBH mass.
The results of applying this semi-emipirical model to NGC 1023 are shown in Figure 5. To avoid clutter only the best 3.5 constraint from Figure 2 for individual clusters in NGC 1023 is shown. Figure 5 also conveys the 3 constraints from the stacks of the old (Figure 3) and the intermediate-age (Figure 4) clusters in NGC 1023. For comparison purposes, Figure 5 also shows the best 3 constraints from uniformly applying the semi-empirical model to individual clusters in the Milky Way [Knapp et al. (1996, Pal 2, NGC 1851, NGC 6440, NGC 6624, NGC 7099); De Rijcke et al. (2006, NGC 6397); Bash et al. (2008, M80); Maccarone & Servillat (2008, NGC 2808); Cseh et al. (2010, NGC 6388); Wrobel et al. (2011, M54); Lu & Kong (2011, 47 Tuc, Cen); Strader et al. (2012a, M15, M19, M22); Chomiuk et al. (2013, M62); using distances from Harris (1996)], as well as to the most luminous cluster in M31 (Miller-Jones et al., 2012, G1) using the distance from Vilardell et al. (2010) and the most luminous cluster in M81 (Swartz et al., 2003; Mayya et al., 2013, GC1) using the distance from Freedman et al (1994).
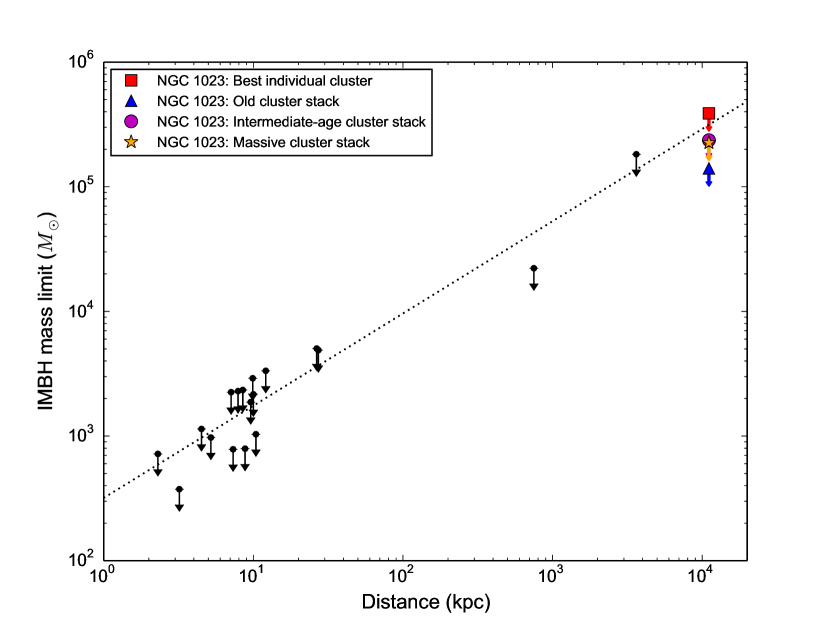
From Figure 5, the best radio luminosity constraint for individual cluster candidates in NGC 1023 implies an IMBH mass of . The constraints from the stacks of the old and the intermediate-age clusters in NGC 1023 correspond to mean IMBH masses of and , respectively. However, recalling that the clusters’ stellar masses are , IMBH constraints are only physically interesting amongst the most massive clusters with, say, about twice as much mass in stars as in a putative IMBH.
Applying a z-band cut of 20.5 selects the most massive clusters, all old and with stellar masses (Forbes et al., 2014). The AIPS task comb was used to form Figure 6, the weighted-mean stack of those massive clusters. That stack’s 3 radio luminosity is erg s-1. Figure 5 then yields an inferred mean IMBH mass of for the population of massive clusters. This is a physically interesting constraint as it suggests black-hole mass fractions of for the massive star clusters. Cast somewhat differently, the clusters’ mean stellar mass is , implying a mean black-hole mass fraction of less than 0.16. Still, it should be kept in mind that the interpretation of is affected by unknowns like the distribution function of IMBH masses and the fraction of clusters occupied by an IMBH.

Three massive clusters have been spectroscopically confirmed as being associated with NGC 1023 (Forbes et al., 2014) and merit special note. ID 33 and ID 269 are each as luminous as G1. Assuming a uniform IMBH mass distribution and a high IMBH occupation fraction, ID 33 and 269 each have ; for comparison, the individual values inferred for G1 are from a sphere-of-influence approach (Gebhardt, Rich & Ho, 2005), from a fundamental-plane approach (Miller-Jones et al., 2012) and from Figure 5. Under the same assumptions, ID 102, an ultra-compact dwarf, has ; for comparison, Seth et al. (2014) reported an individual value of 0.15 for the ultra-compact dwarf M60-UCD1 from a sphere-of-influence approach. These comparisons suggest that pushing lower by factors of a few could reveal analogs of G1 and M60-UCD1 in NGC 1023.
Deeper VLA imaging of these massive clusters in NGC 1023 is feasible but, already, this stacking analysis is sensitive to the mass regime targeted for dynamical studies of extragalactic star clusters with next-generation near-infrared telescopes (e.g., Do et al., 2014). Moreover, these and additional massive clusters could be surveyed to a uniform depth in a future VLA mosaic that covers the full diameter, (41 kpc), of NGC 1023’s system of about 500 star clusters (Young et al., 2012; Kartha et al., 2014). In addition, the methodology demonstrated in this work on NGC 1023 could be applied to other nearby early-type galaxies with rich systems of star clusters (e.g., Brodie et al., 2014). Finally, although the conservative, semi-empirical model of Maccarone & Servillat (2008, 2010) is appealing because of its simplicity, as the photometric data improve one could consider applying more complex models with additional free parameters (e.g., Sun et al., 2013).
4 Summary and Conclusions
We used VLA data at 5.5 GHz to search for the radiative signatures of IMBH accretion from 337 candidate star clusters in NGC 1023, an early-type galaxy at a distance of 11.1 Mpc. None of the individual clusters were detected. Similarly, only upper limits were obtained from weighted-mean image stacks of the 311 clusters with ages older than 5 Gyr, the 26 clusters with ages of a few hundred Myr, and the 20 clusters with stellar masses . We explored the implications of these data for IMBHs, if any exist in these clusters. Our principal findings are as follows:
-
1.
The 337 candidate clusters in NGC 1023 lack radio analogs of HLX-1, a strong IMBH candidate in a cluster in the early-type galaxy ESO 243-49. This suggests that HLX-1 is accreting gas related to the formation and/or presence of the 20-Myr-old stars in its host cluster. Alternatively, the HLX-1 phenomenon could be so rare that no radio analog is expected in NGC 1023.
-
2.
Three candidate clusters in NGC 1023 exhibit hard-state X-ray emission. From the empirical fundamental-plane relation, the clusters’ X-ray and radio luminosities suggest individual IMBH masses of . Given the clusters’ stellar masses this is not a physically interesting constraint. To make progress, a deeper X-ray survey that detects other clusters is needed.
-
3.
Using a formalism previously applied to Milky Way star clusters, the radio stack of the massive clusters in NGC 1023 implies an IMBH mass of . This physically interesting constraint can be improved with deeper VLA imaging. Also, more massive clusters could be added via a VLA mosaic that fully covers NGC 1023’s star cluster system.
References
- Bash et al. (2008) Bash, F. N., Gebhardt, K., Goss, W. M., & vanden Bout, P. A. 2008, AJ, 135, 182
- Brodie & Larsen (2002) Brodie, J. P., & Larsen, S. S. 2002, AJ, 124, 1410
- Brodie et al. (2014) Brodie, J. P., Romanowsky, A. J., Strader, J., et al. 2014, ApJ, 796, 52
- Chies-Santos et al. (2013) Chies-Santos, A. L., Cortesi, A., Fantin, D. S. M., et al. 2013, A&A, 559, a67
- Chomiuk et al. (2013) Chomiuk, L., Strader, J., & Maccarone, T. J. 2013, ApJ, 777, 69
- Corbel et al. (2012) Corbel, S., Dubus, G., Tomsick, J. A., et al. 2012, MNRAS, 421, 2947
- Cseh et al. (2010) Cseh, D., Kaaret, P., Corbel, S., et al. 2010, MNRAS, 406, 1049
- Cseh et al. (2015) Cseh, D., Webb, N. A., Godet, O., et al. 2015, MNRAS, 446, 3268
- De Rijcke et al. (2006) De Rijcke, S., Buyle, P., & Dejonhe, H. 2006, MNRAS, 368, L43
- Do et al. (2014) Do, T., Wright, S., Barth, A. J., et al. 2014, AJ, 147, 93
- Falcke et al. (2004) Falcke, H., Kording, E., & Markoff, S. 2004, A&A, 414, 895
- Farrell et al. (2009) Farrell, S. A., Webb, N. A., Barret, D., Godet, O., & Rodrigues, J. M. 2009, Nature, 460, 73
- Farrell et al. (2012) Farrell, S. A., Servillat, M., Pforr, J., et al. 2012, ApJ, 747, L13
- Farrell et al. (2014) Farrell, S. A., Servillat, M., Gladstone, J. C., et al. 2013, MNRAS, 437, 1208
- Fender & Belloni (2012) Fender, R., & Belloni, T. 2012, Science, 337, 540
- Forbes et al. (2014) Forbes, D. A., Almeida, A., Spitler, L. R., & Pota, V. 2014, MNRAS, 442, 1049
- Ford & Bregman (2013) Ford, H. A., & Bregman, J. N. 2013, ApJ, 770, 137
- Freedman et al (1994) Freedman, W. L., Hughes, S. M., Madore, B. F., et al. 1994, ApJ, 427, 628
- Gebhardt, Rich & Ho (2005) Gebhardt, K., Rich, R. M., & Ho, L. C. 2005, ApJ, 634, 1093
- Godet et al. (2014) Godet, O., Lombardi, J. C., Antonini, F., et al. 2014, ApJ, 793, 105
- Greene (2012) Greene, J. E. 2012, Nat. Comm., 3, 1304
- Greisen (2003) Griesen, E. W. 2003, in Information Handling in Astronomy, ed. A. Heck (Dordrecht: Kluwer), 109
- Gurkan et al. (2004) Gurkan, M. A., Freitag, M., & Rasio, F. A. 2004, ApJ, 604, 632
- Harris (1996) Harris, W. E. 1996, AJ, 112, 1487
- Holley-Bockelmann et al. (2008) Kelly Holley-Bockelmann, K., Gultekin, K., Shoemaker, D., & Yunes, N. 2008, ApJ, 686, 829
- Jiang et al. (2011) Jiang, Y. F., Greene, J. E., Ho, L. C., et al. 2011, ApJ, 742, 68
- Jordan et al. (2007) Jordan, A., McLaughlin, D. E., Cote, P., et al. 2007, ApJS, 171, 101
- Kartha et al. (2014) Kartha, S. S., Forbes, D. A., Spitler, L. R., et al. 2013, MNRAS, 437, 273
- Kepley et al. (2014) Kepley, A. A., Reines, A. E., Johnson, K. E., & Walker, L. M. 2014, AJ, 147, 43
- Knapp et al. (1996) Knapp, G. R., Gunn, J. E., Bowers, P. F., & Vasquez Poritz, J. F. 1996, ApJ, 462, 231
- Konstantinidis et al. (2013) Konstantinidis, S., Amaro-Seoane, P., & Kokkotas, K. D. 2013, A&A, 557, a135
- Kormendy & Ho (2013) Kormendy, J., & Ho, L. C. 2013, ARA&A, 51, 511
- Larsen & Brodie (2000) Larsen, S. S., & Brodie, J. P. 2000, AJ, 120, 2938
- Larsen (2001) Larsen, S. S. 2001, AJ, 122, 1782
- Larsen & Brodie (2002) Larsen, S. S., & Brodie, J. P. 2002, AJ, 123, 1488
- Lindroos et al. (2015) Lindroos, L., Knudsen, K. K., Vlemmings, W., Conway, J., & Marti-Vidal, I. 2015, MNRAS, 446, 3502
- Liu (2011) Liu, J. 2011, ApJS, 192, 10
- Lu & Kong (2011) Lu, T.-N., & Kong, A. K. H. 2011, ApJ, 729, L25
- Maccarone (2004) Maccarone, T. J. 2004, MNRAS, 351, 1049
- Maccarone & Servillat (2008) Maccarone, T. J., & Servillat, M. 2008, MNRAS, 389, 379
- Maccarone & Servillat (2010) Maccarone, T. J., & Servillat, M. 2010, MNRAS, 408, 2511
- Mayya et al. (2013) Mayya, Y. D., Rosa-Gonzalez, D., Santiago-Cortes, M., et al., 2013, MNRAS, 436, 2763
- McMullin et al. (2007) McMullin, J. P., Waters, B., Schiebel, D., Young, W., & Golap, K. 2007, in ASP Conf. Ser. 376, Astronomical Data Analysis Software and Systems, IVI, ed. R. A. Shaw, F. Hill, & D. J. Bell (San Francisco, CA: ASP), 127
- Merloni et al. (2003) Merloni, A., Heinz, S., & DiMatteo, T. 2003, MNRAS, 345, 1057
- Miller & Hamilton (2002) Miller, M. C., & Hamilton, D. P. 2002, MNRAS, 330, 232
- Miller et al. (2014) Miller, M. C., Farrell, S. A., & Maccarone, T. J. M. 2014, ApJ, 788, 116
- Miller-Jones et al. (2012) Miller-Jones, J. C. A., Wrobel, J. M., Sivakoff, G. R., et al. 2012, ApJ, 755, L1
- Morganti et al. (2006) Morganti, R., de Zeeuw, P. T., Oosterloo, T. A., et al. 2006, MNRAS, 371, 157
- Perley et al. (2011) Perley, R. A., Chandler, C. C., Butler, B. J., & Wrobel, J. M. 2011, ApJ, 739, L1
- Plotkin et al. (2012) Plotkin, R. M., Markoff, S., Kelly, B. C., Koerding, E., & Anderson, S. F. 2012, MNRAS, 419, 267
- Portegies Zwart et al. (2004) Portegies Zwart, S. F., Baumgardt, H., Hut, P., Makino, J., & McMillian, S. L. W. 2004, Nature, 428, 724
- Seth et al. (2014) Seth, A. C., van den Bosch, R., Mieske, S., et al. 2014, Nature, 513, 398
- Soria et al. (2010) Soria, R., Hau, G. K. T., Graham, A. W., et al. 2010, MNRAS, 405, 870
- Soria et al. (2012) Soria, R., Hakala, P. J., Hau, G. K. T., et al. 2010, MNRAS, 420, 3599
- Strader et al. (2012a) Strader, J., Chomiuk, L., Maccarone, T. J., et al. 2012a, ApJ, 750, L27
- Strader et al. (2012b) Strader, J., Chomiuk, L., Maccarone, T. J., Miller-Jones, J. C. A., & Seth, A. C. 2012b, Nature, 490, 71
- Sun et al. (2013) Jun, M. Y., Jin, Y. L., Gu, W. M., et al. 2013, ApJ, 776, 118
- Swartz et al. (2003) Swartz, D. A., Ghosh, K. K., McCollough, M. L., et al. 2003, ApJS, 144, 213
- Vilardell et al. (2010) Vilardell, F., Ribas, I., Jordi, C., Fitzpatrick, E. L., & Guinan, E. J. 2010, A&A, 509, 70
- Volonteri (2012) Volonteri, M. 2012, Science, 337, 544
- Wall & Jenkins (2003) Wall, J. V., & Jenkins, C. R. 2003, Practical Statistics for Astronomers, Cambridge: CUP, Table A2.2
- Webb et al. (2012) Webb, N., Cseh, D., Lenc, E., et al. 2012, Science, 337, 554
- Wiersema et al. (2010) Wiersema, K., Farrell, S. A., Webb, N. A., et al. 2010, ApJ, 721, L102
- Wrobel et al. (2011) Wrobel, J. M., Greene, J. E., & Ho, L. C. 2011, AJ, 142, 113
- Xiao et al. (2011) Xiao, T., Barth, A. J., Greene, J. E., et al. 2011, ApJ, 739, 28
- Young et al. (2012) Young, M. D., Dowell, J. L., & Rhode, K. 2012, AJ, 144, 103