Previous address: ]P. L. Kapitza Institute for Physical Problems RAS
Electron spin resonance in a model chain antiferromagnet with a uniform Dzyaloshinskii–Moriya interaction
Abstract
The electron spin resonance spectrum of a quasi 1D antiferromagnet K2CuSO4Br2 was found to demonstrate an energy gap and a doublet of resonance lines in a wide temperature range between the Curie–Weiss and Neèl temperatures. This type of magnetic resonance absorption corresponds well to the two-spinon continuum of excitations in antiferromagnetic spin chain with a uniform Dzyaloshinskii–Moriya interaction between the magnetic ions. A resonance mode of paramagnetic defects demonstrating strongly anisotropic behavior due to interaction with spinon excitations in the main matrix is also observed.
pacs:
75.40.Gb, 76.30.-v, 75.10.JmI Introduction
One-dimensional antiferromagnets are intensively studied because of the numerous collective quantum effects, including the spin-liquid behavior at zero temperature and fractionalized spin excitations (spinons),Faddeev and Takhtajan (1981) revealing itself in a form of two-particle continuum.Tennant et al. (1995); Lake et al. (2013) In applied magnetic field this continuum splits into transverse and longitudinal branches and develops a fine structure.Müller et al. (1981); Dender et al. (1997) Typically, this fine structure is undetectable by the electron spin resonance (ESR) experiments probing strictly excitations. However, some additional perturbations may dramatically modify the long-wavelength response of the spin chain.Oshikawa and Affleck (2002) We address now to a fine structure of the two-spinon continuum, appearing at in spin chains with the so-called uniform Dzyaloshinskii–Moriya (DM) interaction.
A feature of the uniform DM interaction is the parallel orientation of characteristic vectors for all bonds within a chain. This pattern is fundamentally different from that of a conventional staggered DM interaction, when vectors compose an alternating antiparallel structure. The staggered DM interaction is known to induce a canting of magnetic sublattices in a classical antiferromagnet, resulting in a weak ferromagnetic moment. Dzyaloshinsky (1958); Moriya (1960) The uniform interaction would stabilize a spiral spin structure in a classical chain. For a quantum spin chain, which has a disordered ground state, a uniform DM interaction modifies the spectrum of excitations.Gangadharaiah et al. (2008); Povarov et al. (2011); Karimi and Affleck (2011) In particular, this causes a shift of the spinon continuum in momentum space by a specific wavevector (here is the exchange integral and - interspin distance). As a result, in a magnetic field the ESR line splits into a doublet. The frequencies of the doublet components are at the upper and lower boundaries of the initial (i.e. unshifted) continuum of transversal spin fluctuations at the wavevector .Gangadharaiah et al. (2008); Karimi and Affleck (2011) Thus, the doublet is marking the width of the continuum at this particular wavevector.
At the same time, ESR signal should not split at . Another consequence of the spectrum modification is a gap of the ESR absorption in zero field. This case should not be confused with the gapped “breather” mode arising in nonzero field in spin chains with staggered DM, as described in Refs. Oshikawa and Affleck, 2002; Ajiro, 2003. The described modifications stem from the non-equivalence of spinons, propagating in different directions along the spin chain under the action of uniform DM interaction and they are the consequence of the fractionalized nature of excitations.Gangadharaiah et al. (2008); Karimi and Affleck (2011) Emerging fine structure enables one, in particular, to measure the width of the continuum of transverse spin oscillations near the origin of the Brillouin zone by means of ESR. The manifestation of the spinon continuum in ESR response was indeed observed in Cs2CuCl4 — a frustrated quasi-2D distorted triangular lattice antiferromagnet.Povarov et al. (2011); Smirnov et al. (2012, 2015) The observed 1D behavior in a nominally 2D system was associated with the effective decoupling of spin chains due to the frustration of interchain bonds within the triangular lattice.
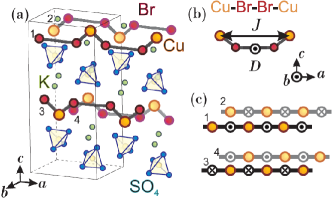
Recently, a true spin antiferromagnetic chain compound with uniform Dzyaloshinskii–Moriya interaction K2CuSO4Br2 was synthesized and studied by Hälg et al.Hälg et al. (2014) The structure of this orthorhombic Pnma mineral is shown in Fig. 1. The magnetic Cu2+ ions are linked by the two-bromine superexchange pathways in chains, running along the axis. The value of the intrachain exchange integral K is 600 times larger than the interchain exchange . Thus, the correspondence of this material to the 1D model is much more exact than for the above mentioned Cs2CuCl4. Like other low-dimensional magnets, K2CuSO4Br2 does not order magnetically at cooling far below the Curie–Weiss temperature. It orders antiferromagnetically at mK, while the Curie–Weiss temperature is about 20 K, thus demonstrating a very good correspondence to 1D model. The model Hamiltonian of a spin chain including Heisenberg exchange and uniform Dzyaloshinskii–Moriya interactions may be written as:
| (1) |
Here is the intrachain exchange integral and vector is the parameter of DM interaction. For K2CuSO4Br2 the DM vectors in adjacent chains are of the same absolute value but are directed along opposite directions, being parallel to -axis, as shown by the symmetry analysis.Hälg et al. (2014) This arrangement is simpler than in Cs2CuCl4, where a few non-parallel DM vector directions exist in adjacent chains. The simple collinear structure of DM vectors in this compound enables one to adjust the magnetic field parallel to all DM vectors, which was impossible for Cs2CuCl4. The observation of the splitting of the ESR line in K2CuSO4Br2 at the frequency GHz at cooling below 20 K was briefly reported in Ref. Hälg et al., 2014. Now we describe the investigation of the ESR spectrum of this compound in a wide frequency and temperature range. Our measurements cover the sub-gap and over-gap frequency domains, reconstructing the entire frequency-field dependence of ESR absorption. The anisotropy of the effect is also checked to be consistent with the spinon-based theory.Gangadharaiah et al. (2008) Besides, we follow the temperature dependence of the gap and of the splitting of the doublet at cooling down to the temperature of K corresponding to the energy of Dzyaloshinskii–Moriya interaction.
II Experimental details
Experiments were performed using a set of ESR spectrometers, combined with a superconducting 12 T solenoid and a 3He cryostat, providing temperature down to K. A standard of 2,2-diphenyl-1-picrylhydrazyl (known as DPPH) was employed as a marker for the magnetic field. Backward wave oscillators, Gann diodes and klystrons were microwave sources, covering the range GHz. The microwave units with cylindrical, rectangular, cut-ring and spiral resonators were used for recording the resonance absorption of microwaves. In case of a properly tuned resonator at frequency we observe the diminishing of the transmission, proportional to the imaginary part of the uniform susceptibility of the sample . The ESR line of a conventional paramagnet, recorded in this case as a dependence of the transmission on the external field, should have a Lorentzian shape. Unfortunately, for frequencies above 200 GHz the spectrum of eigenfrequencies of the cavity is too dense and proper tuning is difficult, therefore a distortion of the ESR line is possible. The presence of this parasitic effect was checked by recording test ESR lines at higher temperatures in the paramagnetic phase. In case of a parasitic distortion an error for the resonance field of about a half of the resonance width was inserted.
The samples used in our measurements were the single crystals of K2CuSO4Br2 from the same batch as in Ref. Hälg et al., 2014. We used two samples with the principal structure axes matching the crystal facets. A smaller sample A had a mass of 6 mg, and a bigger sample B was about 64 mg. Sample B was used in experiments in lower frequency range 25 GHz where larger size sample is required due to the larger resonator volume.
III Experimental results
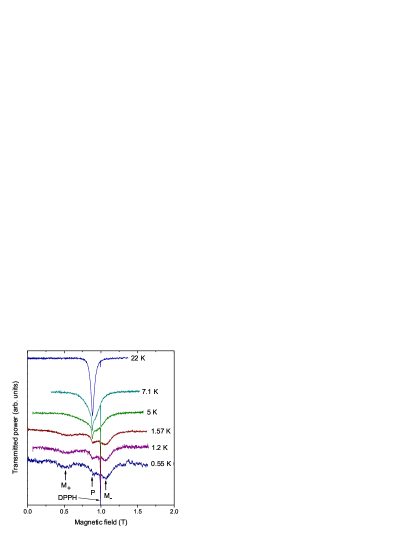
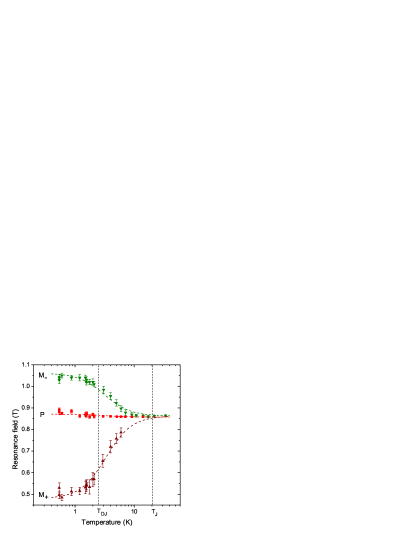
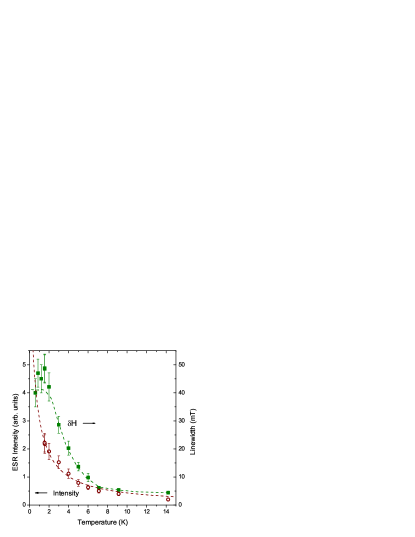
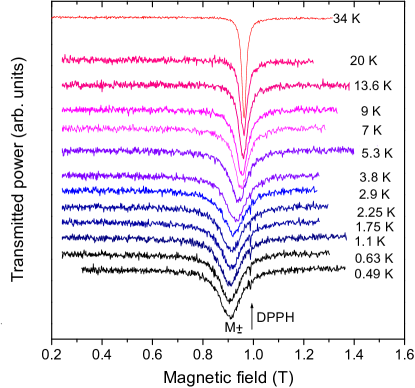
The temperature evolution of the GHz ESR line is present in Fig. 2. Here the magnetic field is applied along the -axis, parallel to the DM vector . We observe that a single ESR line with the -factor of found in a paramagnetic phase at K evolves at cooling in a spectrum of three components, labeled as , , . The components and exhibit a shift from the paramagnetic resonance field, increasing with cooling. A weak line remains at the paramagnetic resonance field. The temperature dependencies of the resonance fields of modes and , as well as of mode are present in Fig. 3. The intensity of mode grows with cooling following Curie law , the linewidth also increases (see Fig. 4). Due to broadening this line is not so well visible at most low temperature, as for K.
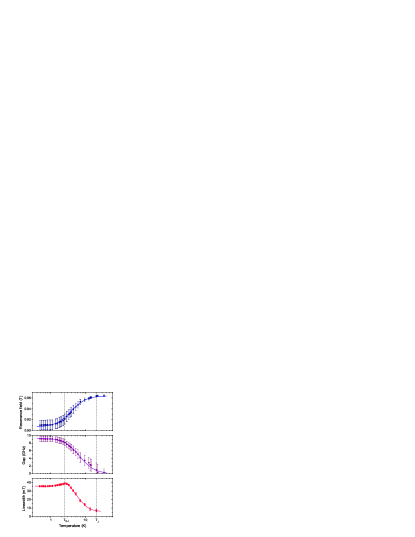
One can see that the shift of resonance lines and from the paramagnetic resonance field evolves with the decrease of temperature and saturates only around K. These data expand the temperature range of previous measurementsHälg et al. (2014) to lower temperatures and reveal a saturation of the resonant field shift. The linewidth of mode increases with cooling similarly to the increase of the resonant field shift for modes . It also saturates at K.
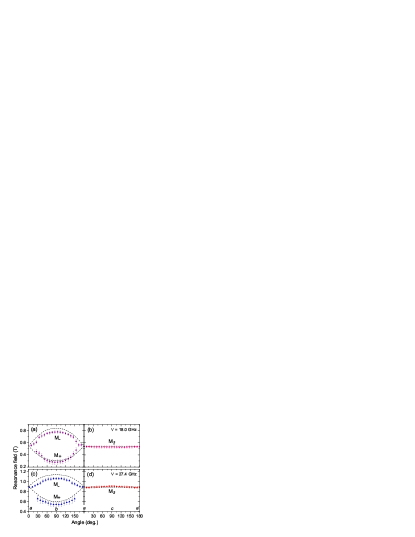
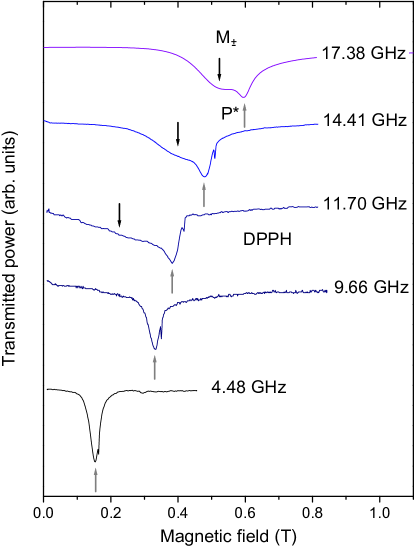
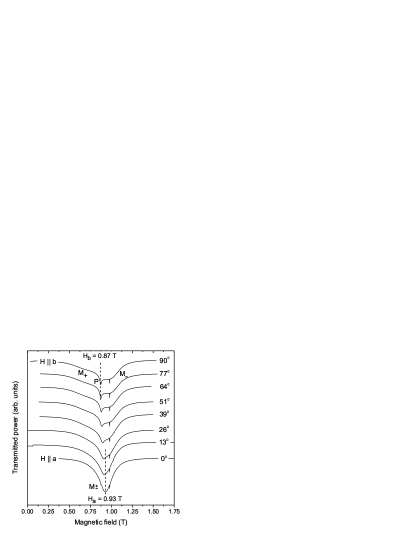
The temperature evolution of GHz ESR spectrum at is present in Fig. 5. Here the single line survives at cooling, but demonstrates a shift to lower fields. The shift of this single mode also reaches a limit value at K as shown in Fig. 6. The transformation of the single-mode spectrum at into a doublet at is traced in the angular dependencies shown in Fig. 7. For the rotation of the magnetic field within the -plane the single-mode spectrum is conserved and has a negligible angular dependence, as seen in the right panels of Fig. 7. The high-temperature ( K) -factors at these orientations are also identical.
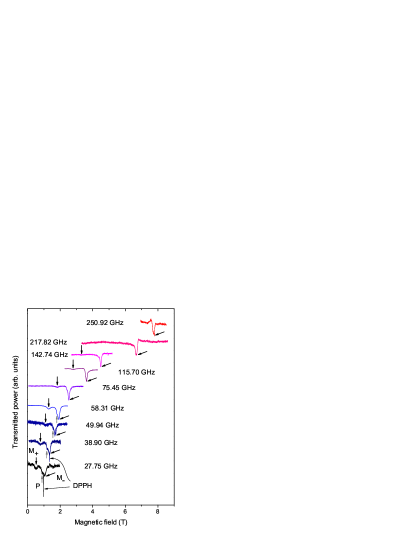
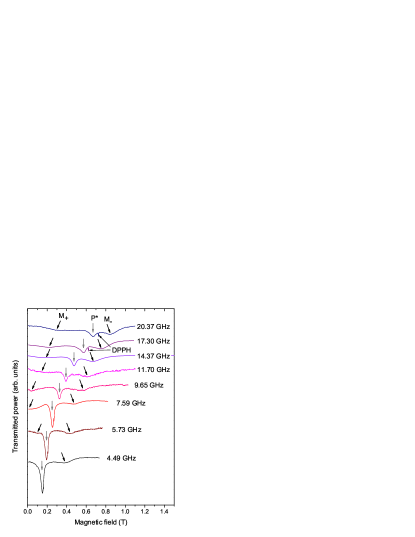
Examples of ESR records taken at different frequencies for are presented in Figs. 8, 9, 10. The data for GHz at K were taken using the sample A. For lower frequencies, for the reason described in Sec.II, we used sample B, which was studied at temperatures K. As the positions of resonance fields practically do not evolve below 1.3 K, the 1.3 K data present the low-temperature limit values of the resonance fields. Sample B has a larger relative intensity of impurity mode (∗ in Fig. 10) with respect to the intrinsic signal. The fraction of paramagnetic defects was estimated from the comparison of the total intensity of ESR signal in the paramagnetic phase ( K), with the intensity of defect ESR measured at . Intensity of the paramagnetic signal at K is ascribed to the total number of spins. The intensities of these two signals were measured at different temperatures. Therefore we have normalized them to get the ratio of numbers of spins using the Curie-Weiss law with Curie-Weiss temperature for the main signal at and Curie-Weiss law with for ESR of defects. As a result, for sample A the content of defects was estimated as , for sample B .
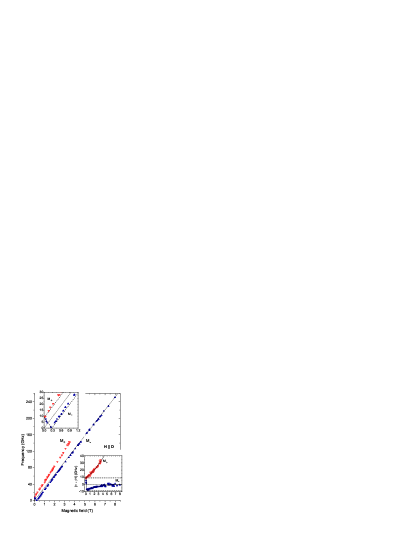
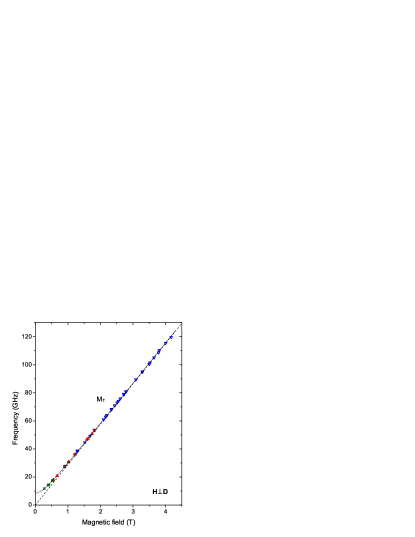
Measurements of resonance fields of the intrinsic signal at different frequencies are summarized in frequency-field diagrams in Figs. 11, 12. The formation of the zero-field gap of about GHz is clearly seen here. Besides, for we see the falling branch, reaching zero frequency at T and a rising branch, originating from zero frequency at the same field. The latter transforms into the component of the doublet in the frequency range above the gap. With the increase of the field the low-field component of the doublet vanishes and above 3.5 T we observe only a single line in the spectrum.
For and we observe in the whole field range only a single line (mode in Fig. 10) originating approximately at GHz and a paramagnetic line of defects ∗, which has different intensity for different samples. At frequencies lower than GHz we observe only the paramagnetic ESR line of defects.
The low-intensity residual paramagnetic line P correlates with the main ESR signal. At first, the broadening of mode at cooling below K has a temperature dependence analogous to that of the resonance field shifts for modes , and . The second evidence for correlation may be found in the angular dependence of ESR response taken at K, which is present in Fig. 13. Here we see a narrow paramagnetic resonance line with at . With the rotation of the magnetic field towards the -axis this narrow line shifts towards and then merges with the main signal. As a result, at there is a single line with . If the narrow line would have survived as an independent signal, it would be seen as a narrow sharp peak on the background of a wider resonance line.
IV Discussion
IV.1 ESR modes of a spin chain
The spinon continuum and the related ESR doublet observed in K2CuSO4Br2 are consequences of quantum fluctuations in quasi-1D spin system, which remains disordered far below the Curie–Weiss temperature. The observed formation of the ESR doublet , in the temperature range below the temperature is fully consistent with the scenario of the spin chain entering a quantum critical regime upon cooling. The anisotropic behavior of the doublet is in a perfect agreement with the symmetry considerations for Dzyaloshinskii–Moriya vector . The symmetry of the orthorhombic Pnma structure of K2CuSO4Br2 implies , as shown in Fig. 1. The theory prediction (Refs. Gangadharaiah et al., 2008; Povarov et al., 2011) is that the ESR doublet should be observable only when the magnetic field has a component along . In a full correspondence with the above symmetry restrictions we observe a doublet at and a single line at . For an arbitrarily aligned magnetic field and the theoretical analysisPovarov et al. (2011) predicts two following resonance frequencies:
| (2) | ||||
In the limiting cases of and the equation set (2) correspondingly transforms into:
| (3) | |||||
| (4) |
Here is the value of g-factor for the field oriented perpendicular to . These relations give the zero-field gap and the soft mode for is predicted to occur at .
IV.2 Data analysis
In the above description of the low-temperature spectrum is the only open parameter, as the -factor values are given by the paramagnetic resonance at high temperatures (when ). This single parameter is easily determined from the zero-field energy gap . We derive GHz by fitting the experimental dependence for (Fig.12) with the relation (4). Thus we get the value of K. The frequency–field dependencies calculated for according to equation (3) are shown in the upper and lower inserts of Fig. 11 by dashed lines. Both rising and falling branches, as well a change from falling to rising behavior at T are in a good agreement with the theoretical predictions in the low-field regime at 1.2 T. We would like to note that observation of such a soft mode at is impossible in the other model compound Cs2CuCl4 due to non-collinear arrangement of DM vectors in adjacent chains. The low-frequency angular dependence of the ESR fields, taken at the rotation of the magnetic field in - and -planes is also in a good agreement with the theoretical relations (2), as shown in the upper panel of Fig. 7.
Nevertheless, the agreement gets worse with the field increase. Positions of the doublet components start to deviate from the calculated frequencies. One can see this behaviour in frequency–filed diagrams of Fig. 11 as well as in GHz angular dependence in the lower panel of Fig. 7. The resonance shift of the component rises in a non-linear way with the increasing field, while for the component it gradually disappears. This behavior is emphasized in the “resonance shift” representation shown in the lower inset of Fig. 11. As the mode vanishes around T, even a qualitative agreement with the theory predictions is completely lost. The spectrum becomes indistinguishable from a conventional paramagnet — a single line at Larmor frequency:
| (5) |
For the resonance at such high frequencies becomes indistinguishable from a paramagnetic spectrum as well, being, nevertheless, in accordance with theoretical relation (4).
On the one hand, this transformation to the Larmor-type ESR spectrum is not unexpected as the magnetic field suppresses quantum fluctuations which are the natural ground for the spinon continuum, and hence for the spinon ESR doublet. The theoretical analysis of the spinon continuum in a magnetic field predicts a collapse of the continuum at the saturation field.Müller et al. (1981) Besides, the appearance of the spinon doublet in ESR response is related to the effect of weak DM interaction. The actual observed field of the doublet collapse is only T, constituting about (the saturation field of K2CuSO4Br2 is about 27 T Hälg et al. (2014)). Such a low value of the collapse field indicates that the corresponding energy scale is related to the DM interaction. One can empirically estimate the collapse field as T. For the previously studied material Cs2CuCl4 the doublet collapse was observed at the magnetic field of about T,Smirnov et al. (2015) which is a half of the saturation field. However, the DM interaction strength in this compound is larger, corresponding to zero-field ESR gap of GHz. The estimation according to the above empiric rule gives T for Cs2CuCl4 in a good agreement with the experiment. It is worth to note, that the final formation of the doublet and the maximum of the resonance field shift for the doublet components in K2CuSO4Br2 are achieved at K, which is much lower, than the characteristic exchange temperature K. The value of , analogous to the field of the doublet collapse is rather of the order of intermediate temperature , than of the order of the exchange temperature .
IV.3 Paramagnetic defects
The paramagnetic mode observed at in sample A may be separated from the ESR signal of the main matrix in the temperature interval K due to its narrow line and the position, different from the resonances and (see Fig. 2). The position of line does not depend on temperature and corresponds to the -factor value of the paramagnetic phase within the experimental accuracy. This indicates that the mode may originate from intrinsic defects such as breaks of the spin chains. The growth of the linewidth of signal at cooling is similar to the growth of the energy gap and the mode linewidth, as shown in Fig. 6. This observation confirms the proposition on the interaction between the defects and the spin chains.
The growth of the linewidth may be qualitatively explained considering the effective exchange interaction between the defects and spin chains using a concept of the exchange narrowing and broadening developed by Anderson.Anderson (1954) Indeed, the exchange interaction between two magnetic systems with the resonance frequencies differing for is known to modify the ESR spectrum. In case of the “slow” exchange (), the lines of the initial spectrum are broadened, while at the broadening is absent. This may presumably explain the broadening of the mode at cooling as the difference in resonance frequencies of modes , and mode develops. In case of a “fast” exchange () the ESR lines should merge into a single narrow line.Anderson (1954) The vanishing of the defect mode at the rotation of the magnetic field in the -plane, present in Fig. 13 may be attributed to the transition from the “slow” exchange at (lines are observed separately) to the “fast” exchange at , when the difference between resonance frequencies becomes smaller because of the angular dependence and the lines may merge due to the effective exchange . In the absence of interaction between the defects and spin-chain matrix the narrow line should be observable together with the wider line .
V Conclusion
A detailed ESR study of the quasi-1D antiferromagnetic system with uniform Dzyaloshinskii-Moriya interaction was performed. The energy gap of GHz was observed in zero field and a characteristic doublet of resonance lines was found in a magnetic field. The zero-field gap, ESR doublet and its anisotropy as well as the frequency-field dependencies for three orientations of the magnetic field are in a good agreement with the theory of spinon continuum modification by uniform Dzyaloshinskii–Moriya interaction, compatible with crystal symmetry of K2CuSO4Br2. There is only one fitting parameter in this theory. On the other hand, with the increase of the magnetic field the low-frequency approximation fails, and the deviation from the linear frequency-field dependencies in a high field and vanishing of the doublet in a rather low field of are not understood now. The system of magnetic defects, interacting with the spin excitation of the main matrix was also revealed by ESR experiment.
VI Acknowledgements
We thank V.N. Glazkov, S.S. Sosin, L.E. Svistov for numerous discussions and comments, and for help with microwave spectrometers, O.A. Starykh for discussions. Work at the Kapitza Institute is supported by Russian Foundation for Basic Research, grant No. 15-02-05918, and by the Program for Basic Research of the Presidium of Russian Academy of Sciences. ETHZ team acknowledges support from Swiss National Science Foundation, Division 2.
References
- Faddeev and Takhtajan (1981) L. D. Faddeev and L. A. Takhtajan, “What is the spin of a spin wave?” Phys. Lett. A, 85, 375 (1981).
- Tennant et al. (1995) D. A. Tennant, R. A. Cowley, S. E. Nagler, and A. M. Tsvelik, “Measurement of the spin-excitation continuum in one-dimensional using neutron scattering,” Phys. Rev. B, 52, 13368–13380 (1995).
- Lake et al. (2013) B. Lake, D. A. Tennant, J.-S. Caux, T. Barthel, U. Schollwöck, S. E. Nagler, and C. D. Frost, “Multispinon Continua at Zero and Finite Temperature in a Near-Ideal Heisenberg Chain,” Phys. Rev. Lett., 111, 137205 (2013).
- Müller et al. (1981) G. Müller, H. Thomas, H. Beck, and J. C. Bonner, “Quantum spin dynamics of the antiferromagnetic linear chain in zero and nonzero magnetic field,” Phys. Rev. B, 24, 1429–1467 (1981).
- Dender et al. (1997) D. C. Dender, P. R. Hammar, Daniel H. Reich, C. Broholm, and G. Aeppli, “Direct Observation of Field-Induced Incommensurate Fluctuations in a One-Dimensional Antiferromagnet,” Phys. Rev. Lett., 79, 1750–1753 (1997).
- Oshikawa and Affleck (2002) M. Oshikawa and I. Affleck, “Electron spin resonance in antiferromagnetic chains,” Phys. Rev. B, 65, 134410 (2002).
- Dzyaloshinsky (1958) I. Dzyaloshinsky, “A thermodynamic theory of ’weak’ ferromagnetism of antiferromagnetics,” J. Phys. Chem. Solids, 4, 241 (1958), ISSN 0022-3697.
- Moriya (1960) T. Moriya, “Anisotropic Superexchange Interaction and Weak Ferromagnetism,” Phys. Rev., 120, 91 (1960).
- Gangadharaiah et al. (2008) S. Gangadharaiah, J. Sun, and O. A. Starykh, “Spin-orbital effects in magnetized quantum wires and spin chains,” Phys. Rev. B, 78, 054436 (2008).
- Povarov et al. (2011) K. Yu. Povarov, A. I. Smirnov, O. A. Starykh, S. V. Petrov, and A. Ya. Shapiro, “Modes of Magnetic Resonance in the Spin-Liquid Phase of ,” Phys. Rev. Lett., 107, 037204 (2011).
- Karimi and Affleck (2011) H. Karimi and I. Affleck, “Transverse spectral functions and Dzyaloshinskii-Moriya interactions in spin chains,” Phys. Rev. B, 84, 174420 (2011).
- Ajiro (2003) Y. Ajiro, “ESR Experiments on Quantum Spin Systems,” J. Phys. Soc. Jpn., 72, 12 (2003).
- Smirnov et al. (2012) A. I. Smirnov, K. Yu. Povarov, S. V. Petrov, and A. Ya. Shapiro, “Magnetic resonance in the ordered phases of the two-dimensional frustrated quantum magnet Cs2CuCl4,” Phys. Rev. B, 85, 184423 (2012).
- Smirnov et al. (2015) A. I. Smirnov, T. A. Soldatov, K. Yu. Povarov, and A. Ya. Shapiro, “High-field magnetic resonance of spinons and magnons in a triangular lattice S=1/2 antiferromagnet ,” Phys. Rev. B., 91, 174412 (2015).
- Hälg et al. (2014) M. Hälg, W. E. A. Lorenz, K. Yu. Povarov, M. Månsson, Y. Skourski, and A. Zheludev, “Quantum spin chains with frustration due to Dzyaloshinskii-Moriya interactions,” Phys. Rev. B, 90, 174413 (2014).
- Anderson (1954) P. W. Anderson, “A Mathematical Model for the Narrowing of Spectral Lines by Exchange or Motion,” J. Phys. Soc. Jpn., 9, 316 (1954).