A Pilot Deep Survey for X-Ray Emission from fuvAGB Stars
Abstract
We report the results of a pilot survey for X-ray emission from a newly discovered class of AGB stars with far-ultraviolet excesses (fuvAGB stars) using XMM-Newton and Chandra. We detected X-ray emission in 3 of 6 fuvAGB stars observed – the X-ray fluxes are found to vary in a stochastic or quasi-periodic manner on roughly hour-long times-scales, and simultaneous UV observations using the Optical Monitor on XMM for these sources show similar variations in the UV flux. These data, together with previous studies, show that X-ray emission is found only in fuvAGB stars. From modeling the spectra, we find that the observed X-ray luminosities are , and the X-ray emitting plasma temperatures are K. The high X-ray temperatures argue against the emission arising in stellar coronae, or directly in an accretion shock, unless it occurs on a WD companion. However, none of the detected objects is a known WD-symbiotic star, suggesting that if WD companions are present, they are relatively cool ( K). In addition, the high X-ray luminosities specifically argue against emission originating in the coronae of main-sequence companions. We discuss several models for the X-ray emission and its variability and find that the most likely scenario for the origin of the X-ray (and FUV) emission involves accretion activity around a companion star, with confinement by strong magnetic fields associated with the companion and/or an accretion disk around it.
Subject headings:
binaries: general — binaries: symbiotic —stars: AGB and post-AGB — stars: mass-loss — stars: individual (EY Hya, Y Gem, CI Hyi) — circumstellar matter1. Introduction
Almost all of our current understanding of the late evolutionary stages of ( stars is based on single-star models. However, binarity can drastically affect late stellar evolution by (a) cutting short normal AGB evolution or even preventing stars from reaching the AGB, due to a phase of strong binary interaction, when the primary was an RGB star, and (b) prolonging post-AGB evolution due to mass-transfer back onto the primary from a circumstellar disk around the companion (van Winckel 2003). It has long been argued that binarity is responsible, directly or indirectly, for the dramatic and poorly-understood changes in the history and geometry of mass loss that occurs in stars as they evolve off the AGB to become PNs. A variety of binary models (e.g., review by Balick & Frank 2000) have been proposed, which can lead to the generation of accretion disks and magnetic fields. The latter are likely the underlying physical cause for the highly collimated jets that have been proposed as the primary agents for the formation of bipolar and multipolar PNs (Sahai & Trauger 1998, Sahai et al. 2011a).
However, observational evidence of binarity in AGB stars is sorely lacking simply because AGB stars are very luminous and variable, invalidating standard techniques for binary detection such as radial-velocity and photometric variations due to a companion star. Sahai et al. (2008: Setal08) therefore used an innovative technique of searching for UV emission from AGB stars with GALEX (Morrissey et al. 2007) that exploits the favorable secondary-to-primary photospheric flux contrast ratios reached in the UV for companions of spectral type hotter than about G0 (=6000 K) and luminosity, . Setal08 detected emission from 9/21 objects in the GALEX FUV ( Å, effective =1516 Å) and NUV ( Å, effective =2267 Å) bands; since these objects (hereafter fuvAGB stars) also showed significant UV variability, Setal08 concluded that the UV source was unlikely to be solely a companion’s photosphere, and was dominated by emission from variable accretion activity.
From a subsequent search of the MAST111Mikulski Archive for Space Telescopes/GALEX archive, we found about 100 fuvAGB stars detections in the FUV band. We required the UV source position to be coincident, within , with the optical position of the AGB target stars (sp. types M4 or later). The chance coincidence probability with random sources for our objects is extremely low (Setal08). Even for the hottest sources in our catalog (sp. type M4), the detected FUV fluxes (20 Jy) correspond to a significant excess above photospheric emission – e.g., for an M4 III giant with , K (e.g., Ridgway et al. 1980, Perrin et al. 1993), and distance 500 pc, the blackbody flux at 1500 Å is Jy. Many fuvAGB stars show extreme UV variability as well, such as Y Gem (Sahai et al. 2011b: Setal11).
We report here the results of a pilot search for X-ray emission from a small subset of fuvAGB stars. Our detection of X-ray emission from 3 objects more than doubles the known number of X-ray emitting AGB stars, providing, for the first time, high-quality X-ray spectra and X-ray and UV light curves.
2. Observation & Results
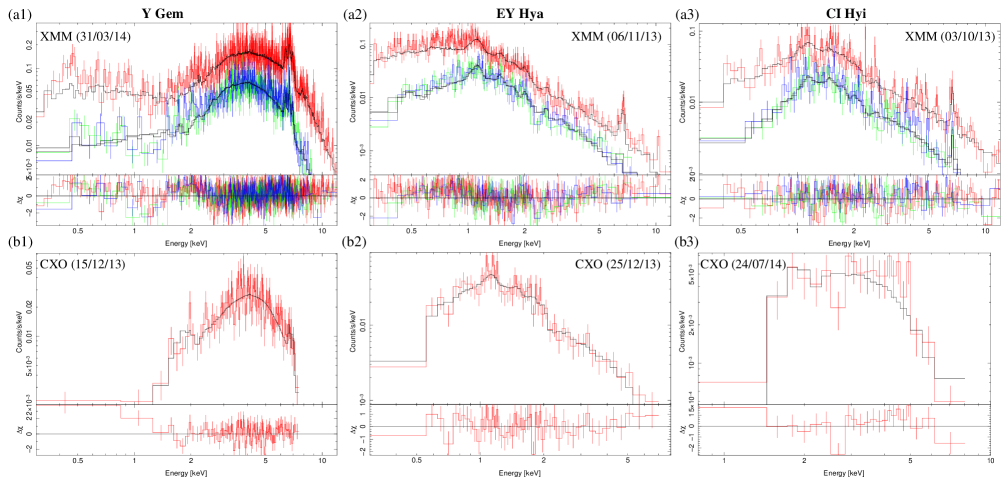
We observed 5 sources with XMM-Newton using EPIC in full window mode, (AO-13 Priority C proposal 072034), and 4 sources with the Chandra X-Ray Observatory (CXO) using ACIS-S (Cycle 15 proposal 15200476.) Three sources, CI Hyi, Y Gem & EY Hya, were common to both programs, and were detected in X-ray emission (Fig. 1a,b). Simultaneous UV observations, providing us UV light-curves for these 3 sources were obtained using the Optical Monitor on XMM through the UVM2 ( nm) and UVW2 (212 nm) filters in Fast Mode. Essential observing details are given in Table 1. Data were reduced following standard procedures, and cleaned by removing time intervals affected by high background, and the cleaned observations were used to extract the X-ray spectral energy distributions in the 0.3–10 keV range (see, e.g., Sanz-Forcada et al. 2011).
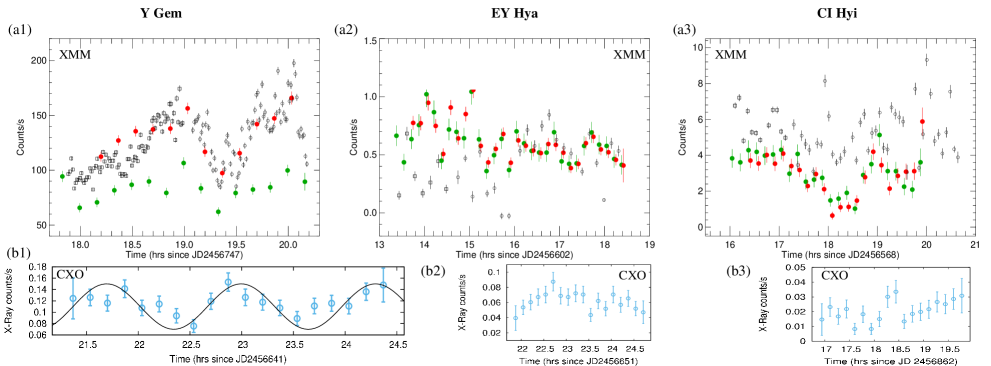
Short-term flux X-ray variations are seen during the course of each observation, spanning a factor on hour-long timescales (Fig. 2a,b). The energy ranges used to extract these curves was keV for the XMM/EPIC instruments, and keV in CXO/ACIS (for the latter, the removal of data for keV is because that region has more problems due to background noise, as explained in Chandra documentation.) For CI Hyi and EY Hya, the variations appear to be stochastic or quasi-periodic. In Y Gem, the light-curves give stronger evidence of a discrete period of about 1.2–1.4 hr, best seen in the CXO/ACIS-S light curve (Fig. 2b1) that spans a longer period than the EPIC one. For the longer time-scales between the XMM and CXO observational epochs for each source, we find changes in the observed fluxes up to a factor 1.8 (in Y Gem and EY Hya); however a direct comparison cannot be made between the spectra as these were taken with different instruments.
The UV fluxes also show short-term variations like the X-ray fluxes (Fig. 2a). Since the UVM2 and UVW2 data were taken sequentially (the OM can take data only through one filter at a time), we have scaled the UVW2 count rate to match that of UVM2 at the time of transition between the two. We find that the UV and X-ray variations appear reasonably well correlated in the case of Y Gem and CI Hyi. For EY Hya, the correlation appears to be weaker.
The ISIS package (Houck & Denicola 2000) and the Astrophysics Plasma Emission Code (APEC, Smith et al. 2001) were used to fit the spectra with thermal models. The background spectrum was estimated from an empty field on the same detector chip as the source, and provided to the ISIS software that then used it to compute and fit a model ”Source+Background” spectrum to the total spectrum extracted from a circular aperture centered on the source. For XMM, we simultaneously fit the data from the EPIC pn, MOS 1 and MOS 2 detectors. For each object we first fit the EPIC spectrum as it has higher S/N than the ACIS one. The elemental abundances used are those of Anders & Grevesse (1989), except for the Fe abundance ([Fe/H]=log10 of the Fe abundance divided by the solar value) which was chosen to be a free parameter only if the S/N was sufficiently high, or fixed appropriately (see below).
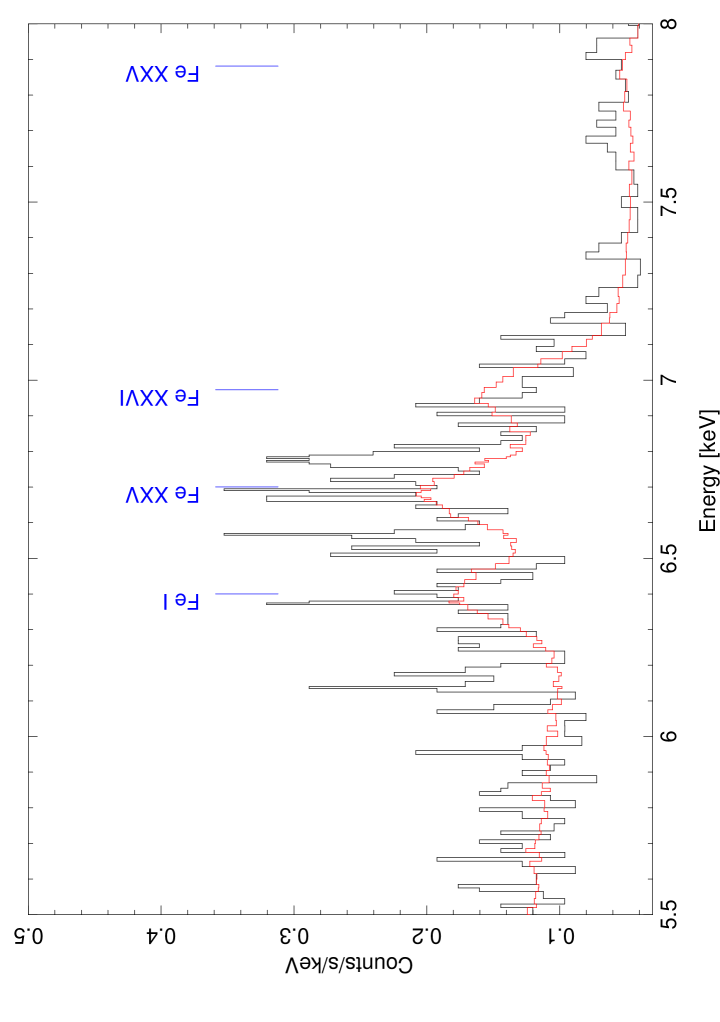
All 3 sources also show a weak line feature at keV in their XMM spectra, that is likely due to emission from (a) the Fe XXV, XXVI lines complexes at keV from the very hot plasma that we have found in these objects, and/or (b) the 6.4 keV Fe I K line. We present an expanded version of the Y Gem XMM pn spectrum that clearly shows these lines in Figure 3. The origin of Fe I K line may be the same as in Young Stellar Objects (YSOs), where it has been inferred to be flourescent emission from cold, neutral ( MK) material in a disk irradiated with energetic ( keV) X-rays (Favata 2005).
The most robust parameters from our models are the X-ray temperature (Tx) and the emission measure (EM), followed by the hydrogen absorption column density (NH) – these provide us with the intrinsic X-ray luminosity (Lx) of each of our objects. We find that and MK for our detected objects (Table 2). For the minor Fe I line component, our derived values of the line flux are sensitive to the emission measure (EM) of the hot plasma that contributes to the nearby Fe XXV, XXVI complex, and are less robust than indicated by the formal uncertainties derived from the least-squares fitting.
The simplest fit to the Y Gem XMM spectrum (Epoch 2, Fig. 1a1), which has the highest S/N of all the spectra reported here, requires two APEC components with the same temperature but with different levels of absorption (NH(1) and NH(2)) and emission measure (EM(1) and EM(2)), and a gaussian Fe I line. For the latter, we had to impose the condition that the line is narrow, and we therefore fixed its width (FWHM) at a nominal value of 0.002 keV222Since this width is much less than the instrumental resolution, its actual value does not affect the derived line flux; the line energy was fixed at 6.4 keV. We allow [Fe/H] to vary. The Fe I line is assumed to be extincted by NH(2), which is significantly smaller than NH(1) – assuming this line comes from a cold disk, the lower attentuation could be an effect of disk inclination and viewing geometry, with the flourescing region on the disk having a smaller amount of extincting gas between it and the observer. The derived [Fe/H] is not significantly different from the solar value. For the CXO spectrum (Epoch 1, Fig. 1b1), which has fewer counts, we derived our model fit with two components as above, but without a Fe I line (as none could be seen in the spectrum), and we fixed the iron abundance to the XMM-model value.
For CI Hyi and EY Hya, we fit the EPIC spectra with a 1-T APEC model (Fig. 1a2,a3), allowing [Fe/H] to vary. A gaussian Fe I line component was also included for fitting EY Hya, in the same manner as for the modeling of the Y Gem XMM spectrum. The derived [Fe/H] values are not significantly different from the solar value. For the lower S/N ACIS spectrum of EY Hya (Fig. 1b2), we fitted 1-T models fixing the value of [Fe/H] to be the same as in the EPIC fit, and derived the required Tx and NH. For the even lower S/N ACIS spectrum of CI Hyi (Fig. 1b3), we fixed both Tx and [Fe/H] to be the same as in the EPIC fit, and derived the required NH. Our modeling shows significant variations in NH for each source.
These data, together with previous studies (Ramstedt et al. 2012 [RMKV12], Kastner & Soker 2004 [KS04]), show that X-ray emission is found only in fuvAGB stars – these include 3 objects from our study (CI Hyi, EY Hya, Y Gem) and 2 from archival data, R Uma and T Dra (RMKV12). We exclude the fuvAGB star SS Vir from this list, since its tentative detection, counts ks-1, may be an artifact of optical loading (RMKV12). For the set of AGB stars not detected in X-ray emission but with adequate exposure times, 0.5 ks (thus allowing meaningful upper limits) and that were observed with GALEX in the FUV, we have 2 objects from archival data, RT Eri and TX Cam (RMKV12, KS04) in addition to the 3 non-detected objects from our study (NU Pav, del01 Aps, and V Hya). However, as TX Cam and RT Eri are not fuvAGB stars (we find upper limits of 8.5 and 12.4 Jy, respectively, for their FUV fluxes), these are not considered further.
Amongst the well-known symbiotic systems with AGB primaries, Mira, R Aqr and CH Cyg, only Mira has been observed in the FUV with GALEX, is both an X-ray emitter (Karovska et al. 2005) and a fuvAGB star (Setal11), and believed to have a WD companion (Sokoloski & Bildsten, 2010).
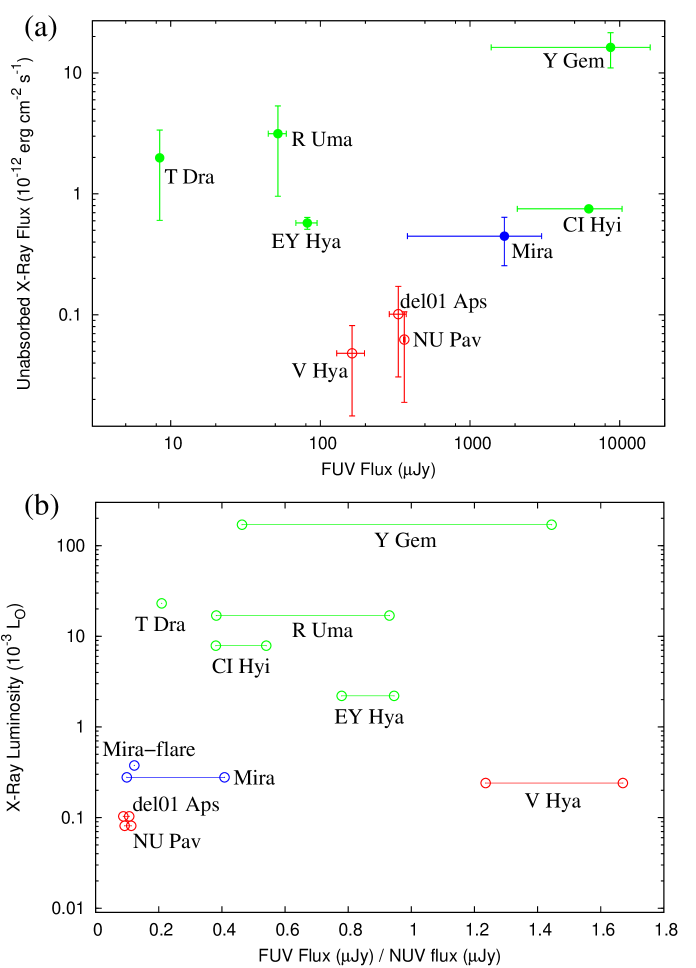
In Fig. 4a, we plot the unabsorbed, average, X-ray flux versus the observed average (GALEX) FUV flux for fuvAGB stars (and Mira) – it appears that the FUV flux is not a good indicator of the X-ray emission. For the FUV data, the error bars show the flux ranges when data are available for more than one epoch. For the X-ray data, the error bars are as follows : (i) for the 3 detected sources in this paper, the errors bars show the range covered by the X-ray fluxes over two epochs, (ii) for the 2 detected sources from RMKV12, the error bars show the range in the unabsorbed flux assuming (as NH is not well constrained in their models, we assume a typical NH value and a conservatively large uncertainty), (iii) for each of the 3 non-detected sources in this paper, we use the Lx versus NH relationship in Fig. 4 of RMKV12 for T Dra, and , to convert the upper limit on the X-ray count rate to an Lx upper limit. The FUV fluxes have not been corrected for dust extinction (intrinsic or extrinsic to the source) as we do not have a reliable way of estimating these – however, it is unlikely that accounting for these would affect our conclusion above. Since our co-eval observations show at least a modest correlation between the variations of the X-ray and UV fluxes, implying a close relationship between the X-ray and FUV emission, the observed absence of a correlation in non-coeval observations is likely due to the fact that both are variable.
In Fig. 4b, we plot the average X-ray (i.e., 0.3-10 kev) luminosity versus the GALEX FUV/NUV flux ratio, . For stars with multi-epoch UV observations, the error bars cover the full range between minimum and maximum values of . We find in the 5 fuvAGB stars with X-ray emission (and Mira.) Amongst the 3 fuvAGB stars without X-ray emission, for NU Pav and del01 Aps; for V Hya, . Thus appears to be a better indicator of X-ray emission than the FUV flux – but we must caution that this is a tentative result since the total number of fuvAGB sources in this plot is small.
3. Discussion
We now discuss several models for the X-ray emission that we have observed from fuvAGB stars – all but one of these require binarity (note that at present there is no other evidence of binarity in our targets).
3.1. X-ray and UV Variability in fuvAGB Stars
The X-ray and UV variability provide useful constraints on the nature and diagnostics of the emitting region. The observed variability is perhaps the strongest indication that these emissions are related to the presence of a binary companion.
Although the short-term variations in EY Hya and CI Hyi don’t show obvious periodicity, the variability time-scales are similar to that in Y Gem, hence it is plausible that the variability mechanism is the same in all three objects.
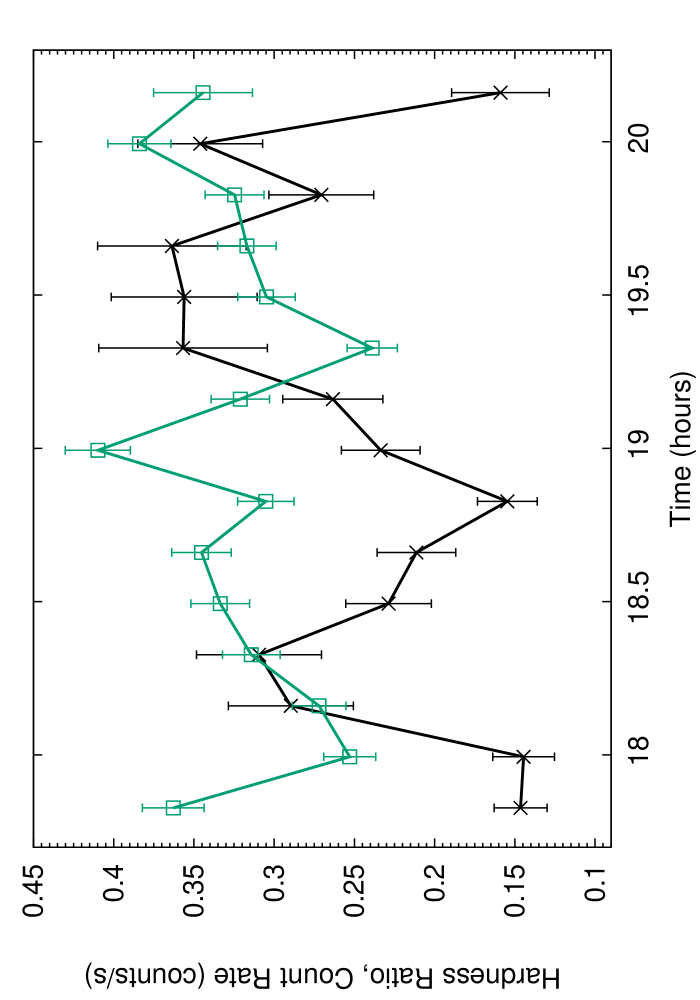
It is unlikely that the X-ray variability is due to flare activity since the fuvAGB stars’ X-ray light curves do not show the temporal behaviour seen in YSO flares that have rapid rise times followed by slower exponential decay. Secondly, in flares the hardness ratio increases during the flare peaks, but for Y Gem, where the XMM count rate is high enough to determine the hardness-ratio variations, we find an anti-correlation between these two quantities (Fig. 5). We defined the hardness ratio as , where and are the fluxes in the energy bands 4–10 keV and 2–4 keV. We excluded the flux at energies shorter than 2 keV in defining this ratio because the former has much larger errors due to the smaller number of counts.
The hardness ratio variations in Y Gem are consistent with the X-ray changes occuring predominantly as a result of changes in NH (for EY Hya and CI Hya, the count rates are too low for such hardness-ratio light-curve analysis.) We note that our modeling of the X-ray spectra shows that NH varies significantly on long time scales in all 3 X-ray fuvAGB stars. It is thus likely that NH variations are the dominant cause of short and long-term X-ray variations in fuvAGB stars, which may be produced by changes in viewing geometry (e.g., due to a warped rotating accretion disk), the presence of variable accretion streams, or both.
3.2. Models for X-ray Emission from fuvAGB Stars
3.2.1 Model 1. Accretion Disk around a Companion
If we assume that the periodicity in Y Gem is associated with the orbital period of a central binary, then using Kepler’s law, we find that the semi-major-axis is, AU or cm, assuming primary and companion masses of , . Since such values for would place the companion deep inside the AGB star’s photosphere, the X-ray variation is unlikely to be associated with the orbital period of the binary.
The 1.3 hr time-scale is similar to the period of material orbiting close to the inner radius of an accretion disk around a sub-solar mass companion, i.e., with (implying cm); for larger masses, the orbit radius becomes smaller than the stellar radius. Y Gem’s X-ray and UV variability therefore suggests that these emissions arise at or near the magnetospheric radius in a truncated disk, or the boundary layer between the disk and star. In either case, the relatively large emission measures derived from our APEC modelling imply large densities, , in the emitting region. Assuming that the emission comes from a torus of inner radius and circular cross-section with fractional radius , we find that
| (1) |
The magnetic field required to confine such a dense, hot plasma is correspondingly large since the magnetic energy density must be greater than or equal to the thermal energy density. We find that the magnetic field at the inner radius, is,
| (2) |
For a truncated disk, the magnetospheric radius, , depends on the magnetic field of the companion, , and the accretion rate (acc) (see Eqn. 8 of Stute & Camenzind 2005). Assuming the same geometry for the X-ray emitting region as above, and the derived value of (260 G), extrapolated to the stellar surface assuming a dipole field, we find that, , if yr-1 and . The magnetic field at the stellar surface is, G. The derived value of is relatively insensitive to the unknown accretion rate, since .
Since the values of and are so similar, then given the uncertainties in the estimates of both, due to our assumptions on the geometry of the emitting region, the magnetic field geometry, and the accretion rate, it is possible that the disk is not truncated, but is connected to the star via a boundary layer.
3.2.2 Model 2. Accretion Onto a Companion
The generally accepted model for accretion from the disk into YSOs (the magnetospheric model) envisions plasma being channeled into magnetic flux tubes and ramming onto the star at essentially free-fall speed (e.g., Favata 2005). The X-ray temperature of the shocked gas resulting from such a process is, (from Eqn. 9 of Calvet & Gullbring 1998), where the companion mass and radius, and , are in solar units. Thus, for a Sun-like companion, is significantly lower than observed; for more massive dwarf companions, even upto B5, . Considering substellar companions, only the most massive brown-dwarfs (BDs) provide a somewhat larger value of , e.g., for a BD with mass 0.1 , . Only for white-dwarf (WD) companions, with , the observed values of Tx ( K) can be easily produced as a result of accretion.
However, none of our X-ray emitting AGB stars is known to be a symbiotic star with a WD companion. For EY Hya, an optical spectrum taken with the Palomar 5m telescope shows no emission lines in the 3889–5436 Å region (K. Findeisen, private communication). But we cannot rule out the possibility that fuvAGB stars have WD companions that are not hot enough to ionize a detectable amount of gas and produce emission lines (e.g., the Balmer lines or forbidden lines such as [OI] or [NII] ). If so, these WD companions must have cooled to effective temperatures K. However, in the case of Y Gem, Setal11 have shown that its intense UV emission requires a much larger surface area than that of a WD, hence its UV emission cannot be due to accretion onto a WD.
However, if an adequate mass of accreting gas can be pre-accelerated to high speeds () by magnetic reconnection (e.g., de Gouveia Dal Pino et al. 2014, Hamaguchi et al. 2012), then the shock temperature is, using Eqn. 9 of Calvet & Gullbring (1998), , assuming a mean molecular weight, , and is not constrained by the mass-to-radius ratio of the companion.
Hamaguchi et al. (2012) propose that such “accretion-induced magnetic reconnection” generates the X-ray emission in the YSO V1647 Ori; the differential rotation between star and its accretion disk shears the star’s magnetic field, causing the field lines to twist and continuously reconnect.
The quasi-periodic variability in the X-ray light curve of V1647 Ori, rather similar to what we find for the fuvAGB stars, is a by-product of this mechanism due to the production of hot-spots on the rotating central star, where, matter that is accelerated to high speeds by the magnetic reconnection collides with the star to produces X-ray emission with high Tx. It is possible that such a model applies to Y Gem (and possibly EY Hya and CI Hyi) as well.
3.2.3 Model 3: Stellar Coronal Emission
X-ray emission from stellar coronae has been extensively studied (e.g., Güdel 2004). The relatively high values of Tx that we have found in our fuvAGB sources argues against the X-ray emission coming from such coronae, which typically show values of Tx in the range MK and rarely as high as the lowest Tx value in our sample, MK (e.g., Schmitt et al. 1990). We also note that stellar coronae are usually accompanied by stellar chromospheres, and the latter produce strong Ca II H & K emission lines – however the optical spectrum of EY Hya (K. Findeisen, private communication) shows no such emission. We discuss coronal models in more detail below, and present additional arguments against them as being the likely source of X-ray emission in fuvAGB stars.
(a) From a main-sequence companion
“Saturated” coronae around low-mass () main sequence stars reach a maximum of Lx/Lc (Pizzolato et al. 2003). More massive stars (1.1–1.29) follow a lower ratio, Lx/Lc. Our observed values of Lx lie in the range . Then, if this X-ray luminosity comes from coronal emission from a main sequence companion, the implied companion luminosity is Lc . But since Lc, the companions must have masses . Thus the implied companion luminosities are even higher, Lc15-500 , implying masses Mc12, which is not allowed, since the companion mass must be less than that of the primary AGB star (1–8 ).
(b) From the AGB star
Since plasma at temperatures keV cannot be gravitationally confined on the surface of giants and supergiants (Rosner, Golub & Vaiana 1985), the very high values of Tx that we have found imply that the emitting plasma in fuvAGB stars, must be magnetically confined (and heated). A universal relationship between magnetic flux and the power dissipated through coronal heating is suggested by the linear dependence between the total unsigned magnetic flux, and Lx for the Sun and active dwarf stars (Pevtsov et al. 2003) over 12 orders of magnitude. Applying this relationship to our fuvAGB stars, with erg s-1, we get G cm2, implying, for a AGB star with radius 1 AU, an average magnetic field , where is the fraction of the AGB’s star’s surface covered by the field ( for a large-scale field and for localized fields). Since we also need to produce substantial amounts of plasma implied by our derived values of the X-ray emission measure, around the fuvAGB stars, and since these objects are cool, late-type stars, with three of them known to drive cool, dusty molecular winds (EY Hya, T Dra, R Uma), the surface filling factor of the coronal gas (and thus ) is likely to be relatively small.
The linear relationship between Lx- appears to saturate at the largest values of Lx (i.e., at erg s-1, in a region populated by T Tauri stars) with 5/6 objects showing Lx values a factor of 10 or more below the linear fit. Hence the value of implied by Lx in fuvAGB stars may be higher by a factor 10 or more. Recent studies show that such values of are plausible: e.g., magnetic fields strengths of () G have been inferred for the stellar surfaces in 3 AGB stars by extrapolating the field-strength from observations of polarization in the 22 GHz H2O maser line, assuming an () radial variation, appropriate for a toroidal (dipole) field (Leal-Ferreira et al. 2013).
However, a sensitive XMM search for X-ray emission in two AGB stars with known or suspected strong B-fields yielded null detections (KS04), making coronal emission from the AGB star a less likely candidate for producing the observed X-ray emission.
4. Concluding Remarks
In a survey for X-ray emission from 6 AGB stars with far-ultraviolet excesses, we detected 3/6 objects with relatively high X-ray luminosities and plasma temperatures; furthermore the X-ray flux in each of these is variable on hour-long time-scales. In contrast, a similar sensitive search for X-rays in 2 AGB stars with evidence for magnetic fields, was unsuccessful, and these stars show no FUV emission. We believe therefore that the most likely scenario for the origin of the X-ray (and FUV) emission involves accretion activity around a companion star, with confinement by strong magnetic fields associated with the companion and/or an accretion disk around it. However, an extended survey of AGB stars with and without UV excesses (including those with evidence of magnetic fields) is needed to help us robustly test this hypothesis.
References
- Anders & Grevesse (1989) Anders, E., & Grevesse, N. 1989, Geochim. Cosmochim. Acta, 53, 197
- Balick & Frank (2002) Balick, B. & Frank, A. 2002, ARA&A, 40, 439
- Calvet & Gullbring (1998) Calvet, N., & Gullbring, E. 1998, ApJ, 509, 802
- de Gouveia Dal Pino et al. (2014) de Gouveia Dal Pino, E. M., Kowal, G., & Lazarian, A. 2014, 8th International Conf. of Numerical Modeling of Space Plasma Flows (ASTRONUM 2013), 488, 8
- Favata (2004) Favata, F. 2005, Mem. Soc. Astron. Italiana, 76, 337
- Favata et al. (2005) Favata, F., Flaccomio, E., Reale, F., et al. 2005, ApJS, 160, 469
- Güdel (2004) Güdel, M. 2004, A&A Rev., 12, 71
- Hamaguchi et al. (2012) Hamaguchi, K., Grosso, N., Kastner, J. H., et al. 2012, ApJ, 754, 32
- Houck & Denicola (2000) Houck, J. C., & Denicola, L. A. 2000, Astronomical Data Analysis Software and Systems IX, 216, 591
- Houck (2013) Houck, J. C 2013, ISIS 1.0 Technical Manual, Chandra X-Ray Observatory Center
- Kahane & Jura (1994) Kahane, C., & Jura, M. 1994, A&A, 290, 183
- Karovska et al. (2005) Karovska, M., Schlegel, E., Hack, W., Raymond, J. C., & Wood, B. E. 2005, ApJ, 623, L137
- Kastner & Soker (2004) Kastner, J. H., & Soker, N. 2004, ApJ, 608, 978 (KS04)
- Leal-Ferreira et al. (2013) Leal-Ferreira, M. L., Vlemmings, W. H. T., Kemball, A., & Amiri, N. 2013, A&A, 554, AA134
- Morrissey et al. (2007) Morrissey, P., Conrow, T., Barlow, T. A., et al. 2007, ApJS, 173, 682
- Nazé et al. (2011) Nazé, Y., Broos, P. S., Oskinova, L., et al. 2011, ApJS, 194, 7
- Perrin et al. (1998) Perrin, G., Coudé du Foresto, V., Ridgway, S. T., et al. 1998, A&A, 331, 619
- Pevtsov et al. (2003) Pevtsov, A. A., Fisher, G. H., Acton, L. W., et al. 2003, ApJ, 598, 1387
- Pizzolato et al. (2003) Pizzolato, N., Maggio, A., Micela, G., Sciortino, S., & Ventura, P. 2003, A&A, 397, 147
- Ramstedt et al. (2012) Ramstedt, S., Montez, R., Kastner, J., & Vlemmings, W. H. T. 2012, A&A, 543, A147 (RMKV12)
- Ridgway et al. (1980) Ridgway, S. T., Joyce, R. R., White, N. M., & Wing, R. F. 1980, ApJ, 235, 126
- Rosner et al. (1985) Rosner, R., Golub, L., & Vaiana, G. S. 1985, ARA&A, 23, 413
- Sahai & Trauger (1998) Sahai, R. & Trauger, J.T. 1998, AJ, 116, 1357
- Sahai et al. (2008) Sahai. R., Findeisen, K., Gil de Paz, A., Sáanchez Contreras, C. 2008, ApJ, 689, 1274 (Setal08)
- Sahai et al. (2011) Sahai, R., Morris, M. R., & Villar, G. G. 2011a, AJ, 141, 134
- Sahai et al. (2011) Sahai, R., Neill, J. D., Gil de Paz, A., & Sánchez Contreras, C. 2011b, ApJ, 740, L39 (Setal11)
- Sanz-Forcada et al. (2011) Sanz-Forcada, J., Micela, G., Ribas, I., et al. 2011, A&A, 532, AA6
- Sokoloski and Bildsten (2010) Sokoloski, J. & Bildsten, L. 2010 ApJ, 723, 1188
- Schmitt et al. (1990) Schmitt, J. H. M. M., Collura, A., Sciortino, S., et al. 1990, ApJ, 365, 704 pJ, 723, 1188
- Smith et al. (2001) Smith, R. K., Brickhouse, N. S., Liedahl, D. A., & Raymond, J. C. 2001, ApJ, 556, L91
- Stute et al. (2005) Stute, M., Camenzind, M., & Schmid, H. M. 2005, A&A, 429, 209
- van Winckel (2003) van Winckel, H. 2003, ARA&A, 41, 391
| XMM-Newton observations | |||||||
|---|---|---|---|---|---|---|---|
| Target | Camera | Filter | Eff. Exp | V | Date | X-Ray | Spect. |
| Time (sec) | (mag) | dd/mm/yyyy | Emiss.? | Type | |||
| CI Hyi | pn | Medium | 7897 | 9.3 | 03/10/2013 | Yes | M6 |
| MOS1 | Medium | 13843 | |||||
| MOS2 | Medium | 14006 | |||||
| OM | UVM2 | 4000 | |||||
| OM | UVW2 | 11700 | |||||
| Y Gem | pn | Medium | 6238 | 9.09 | 31/03/2014 | Yes | M8 |
| MOS1 | Medium | 8250 | |||||
| MOS2 | Medium | 8510 | |||||
| OM | UVM2 | 4000 | |||||
| OM | UVW2 | 4000 | |||||
| EY Hya | pn | Medium | 16839 | 9.37 | 06/11/2013 | Yes | M7 |
| MOS1 | Medium | 17284 | |||||
| MOS2 | Medium | 17968 | |||||
| OM | UVM2 | 4400 | |||||
| OM | UVW2 | 12800 | |||||
| del01 Aps | pn | Thick | 11539 | 4.76 | 18–19/08/2013 | No | M5 |
| MOS1 | Thick | 13166 | |||||
| MOS2 | Thick | 13172 | |||||
| NU Pav | pn | Thick | 10039 | 5.06 | 26–27/09/2013 | No | M6 |
| MOS1 | Thick | 11701 | |||||
| MOS2 | Thick | 11672 | |||||
| Chandra observations | |||||||
| Target | Camera | Eff. Exp | V | Date | X-Ray | Spect. | |
| Time (sec) | (mag) | dd/mm/yyyy | Emiss.? | Type | |||
| CI Hyi | ACIS-S | 9838 | 9.3 | 24/07/2014 | Yes | M6 | |
| Y Gem | ACIS-S | 10335 | 9.09 | 15/12/2013 | Yes | M8 | |
| EY Hya | ACIS-S | 9839 | 9.37 | 25/12/2013 | Yes | M7 | |
| V Hya | ACIS-S | 9660 | 9.70 | 18/12/2013 | No | C | |
| Detected Sources: Models | |||||||||
| Target | NH | log(Tx) | log(EM) | Fx11The observed X-ray flux in the 0.03-10 kev range | Lx22The intrinsic X-ray luminosity in the 0.03-10 kev range | D33Distances: from Hipparcos parallax; if unavailable, using MK=-7.6 for late-M semi-regular stars, as in Kahane & Jura (1994) | flux[FeI(6.4)]44Fe I 6.4 kev line flux (a Gaussian line-shape was assumed and the line energy and width (FWHM) were fixed at 6.4 keV and 0.002 keV during fitting) | [Fe/H]55logarithm of the ratio of star’s Fe abundance to that of the Sun | 66reduced value |
| cm-2 | K | cm-3 | erg cm-2 s-1 | kpc | phot s-1 cm-2 | (dex) | |||
| CI Hyi/XMM | 0.33 | 7.87 | 54.2 | 0.58 | … | 0.12 | 1.2 | ||
| range77+,- values for NH, log(Tx), log(EM), Fx, and the FeI(6.4) line flux | |||||||||
| CI Hyi/CXO | 2.8 | 7.8788Parameter value (in italics) was fixed, hence no uncertainties are provided | 54.2 | … | 0.1288Parameter value (in italics) was fixed, hence no uncertainties are provided | 1.2 | |||
| range77+,- values for NH, log(Tx), log(EM), Fx, and the FeI(6.4) line flux | … | ||||||||
| EY Hya/XMM | 0.095 | 7.57 | 53.7 | 0.35 | 1.35 | ||||
| range77+,- values for NH, log(Tx), log(EM), Fx, and the FeI(6.4) line flux | |||||||||
| EY Hya/CXO | 0.05 | 7.74 | 53.7 | … | 0.1688Parameter value (in italics) was fixed, hence no uncertainties are provided | 0.70 | |||
| range77+,- values for NH, log(Tx), log(EM), Fx, and the FeI(6.4) line flux | |||||||||
| Y Gem/XMM | 8.1399NH(1), EM(2) | 8.1 | 55.699NH(1), EM(2) | 0.58 | 1.1 | ||||
| range77+,- values for NH, log(Tx), log(EM), Fx, and the FeI(6.4) line flux | |||||||||
| 0.0431010NH(2), EM(2) | 8.188Parameter value (in italics) was fixed, hence no uncertainties are provided | 53.71010NH(2), EM(2) | |||||||
| range77+,- values for NH, log(Tx), log(EM), Fx, and the FeI(6.4) line flux | |||||||||
| Y Gem/CXO | 15.699NH(1), EM(2) | 8.2 | 55.299NH(1), EM(2) | … | 0.1088Parameter value (in italics) was fixed, hence no uncertainties are provided | 1.2 | |||
| range77+,- values for NH, log(Tx), log(EM), Fx, and the FeI(6.4) line flux | 0.14,-0.21 | ||||||||
| 3.041010NH(2), EM(2) | 8.288Parameter value (in italics) was fixed, hence no uncertainties are provided | 54.61010NH(2), EM(2) | |||||||
| range77+,- values for NH, log(Tx), log(EM), Fx, and the FeI(6.4) line flux | |||||||||
| Non-Detected Sources | |||||||||
| del01 Aps/XMM | 1111 upper limit | 0.23 | |||||||
| NU Pav/XMM | 1111 upper limit | 0.16 | |||||||
| V Hya/CXO | 1111 upper limit | 0.40 | |||||||