Early Science with the Large Millimeter Telescope: Dust constraints in a galaxy
Abstract
Recent observations with the GISMO (Goddard-IRAM Superconducting 2 Millimeter Observer) 2 mm camera revealed a detection arcsec away from the lensed galaxy MACS1149-JD1 at . Within the arcsec FWHM GISMO beam, this detection is consistent with the position of the high-redshift galaxy and therefore, if confirmed, this object could be claimed to be the youngest galaxy producing significant quantities of dust. We present higher resolution ( arcsec) observations of this system taken with the AzTEC 1.1 mm camera mounted on the Large Millimeter Telescope Alfonso Serrano. Dust continuum emission at the position of MACS1149-JD1 is not detected with an r.m.s. of 0.17 mJy/beam. However, we find a detection arcsec away from MACS1149-JD1, still within the GISMO beam which is consistent with an association to the GISMO source. Combining the AzTEC and GISMO photometry, together with Herschel ancillary data, we derive a for the dusty galaxy. We conclude therefore that the GISMO and AzTEC detections are not associated with MACS1149-JD1. From the non-detection of MACS1149-JD1 we derive the following () upper limits corrected for gravitational lensing magnification and for cosmic microwave background (CMB) effects: dust mass M⊙, IR luminosity L⊙, star formation rate M⊙ yr-1, and UV attenuation mag. These limits are comparable to those derived for other high-redshift galaxies from deep Atacama Large Millimeter/submillimeter Array (ALMA) observations.
keywords:
dust, extinction - galaxies: high redshift - galaxies: ISM - submillimetre: galaxies1 Introduction
Dust is an extremely important ingredient of the Universe and plays an essential role in the formation and growth of different astronomical objects, from planets to the most massive galaxies. Dust obscures ultraviolet (UV) and optical emission from young stars in regions of intense star-formation and re-emits it into far-infrared (FIR) bands, affecting the observed spectral properties (e.g. Draine 2003). Understanding the properties of dust in the very young universe is of great importance, since its abundance and composition provide critical information about the interstellar medium conditions at the epoch of reionisation, as well as about the number and total energy output of stellar sources which likely contributed to the process of reionisation. Furthermore, observations at these early epochs, when dust was being formed for the first time, have important consequences on our understanding of dust formation processes and the chemical enrichment of the Universe (e.g. Dwek et al. 2007; Michałowski et al. 2010b; Calura et al. 2014; Valiante et al. 2014; Mancini et al. 2015; Michałowski 2015).
Dust has been detected in the submm galaxy HLFS3 (Riechers et al. 2013), the quasars SDSS J1148+5251 at z = 6.42 (Fan et al. 2003) and ULAS J1120+0641 at (Venemans et al. 2012), and the ’normal’ star-forming galaxy A1689-zD1 (Watson et al. 2015). On the other hand, recent interferometric studies report non-detections of dust in –8 galaxies (Walter et al. 2012; Ouchi et al. 2013; Berger et al. 2014; González-López et al. 2014; Ota et al. 2014; Schaerer et al. 2015), leading to the belief that most normal galaxies at these high-redshifts may be largely dust-free due to their presumed low metallicities. This is supported by the demonstration of a very low mass dust reservoir in IZw18, a metal-poor local galaxy (Fisher et al. 2014; Hunt et al. 2014). Clearly, the presence and abundance of dust in the high-redshift Universe is still poorly understood and, therefore, observations of dust of larger samples of galaxies at high-redshifts are necessary.
MACS1149-JD1 is believed to be a gravitationally lensed galaxy, which is strongly magnified (, Zheng et al. 2012) by the Frontier Field (FF) galaxy cluster MACS J1149.6+2223 at (Ebeling et al. 2007). The Hubble Space Telescope (HST) and Spitzer colours indicate that MACS1149-JD1 is a young galaxy with a photometric redshift of (Zheng et al. 2012). The large number of bands used to derive the photometric redshift makes it one of the most accurate estimates obtained for such a distant object. Recently, Dwek et al. (2014) have reported a potential 2 mm detection of MACS1149-JD1, using the Goddard-IRAM Superconducting 2 Millimeter Observer (GISMO) camera (Staguhn et al. 2008) mounted at the Institut de Radioastronomie Millimétrique (IRAM) 30m telescope, with a arcsec full width at half maximum (FWHM) beam size, but with an effective arcsec FWHM smoothed-beam for point-source extraction. The 99 per cent confidence interval for the positional uncertainty of this source is arcsec, following the description by Ivison et al. (2007), consistent with the offset from the high-redshift galaxy ( arcsec). Furthermore, the 2 mm number counts (Staguhn et al. 2014) predicts a probability of 0.3–0.8 per cent to find such a source at random, which suggests that the GISMO detection might be associated with the high-redshift galaxy.
In this Letter, we present arcsec FWHM resolution observations taken during the Early Science Phase of the Large Millimeter Telescope Alfonso Serrano (LMT; Hughes et al. 2010) using the 1.1 mm continuum camera AzTEC (Wilson et al. 2008) in order to confirm or rule out the association of the mm-wavelength source with MACSJ1149-JD1, as well as constrain the dust properties of this system.
All our calculations assume a cold dark matter cosmology with , , and kms-1Mpc-1 (Planck Collaboration XVI 2014).
2 OBSERVATIONS
2.1 AzTEC/LMT observations
Our observations were obtained using the 1.1 mm continuum camera AzTEC on the LMT. During this Early Science Phase (see also Zavala et al. 2015), only the inner 32 m diameter section of the LMT primary surface is illuminated, leading to an effective beam size of 8.5 arcsec, a factor of better than the smoothed-GISMO/IRAM beam.
The observations were conducted in photometry mode over several observing nights between 2014 December and 2015 April with opacities in the range of –0.12. The scanning technique used was a Lissajous pattern covering a 1.5 arcmin diameter region with uniform noise centred at the HST position of MACS1149-JD1. Pointing observations towards the bright millimetre source J1159+292 (2 Jy) were acquired every 30 min to ensure positional accuracy. A total on-source integration time of h was obtained in the photometry mode map, achieving an r.m.s. of 0.19 mJy. Additional data from a wider area ( arcmin2) map of the MACS cluster (Montaña et al. in preparation; Pope et al. in preparation) were co-added to obtain a final r.m.s. of 0.17 mJy at the position of MACS1149-JD1. These observations have a similar depth to the GISMO observations at 2 mm assuming an average SMG spectral energy distribution (SED) template (Michałowski et al. 2010a) at . Alternatively, the map is times deeper if the SMG template is located at a less extreme redshift of . To generate the final 1.1 mm maps from the raw data we used the AzTEC Standard Pipeline described by Scott et al. (2008).
The distance between 15 AzTEC sources with S/N detected in the full map and the nearest Spitzer Infrared Array Camera 4.5 m sources has a 1 offset of arcsec, including the overall systematic offset between the two images and the positional uncertainty in AzTEC source positions. Therefore, the astrometric accuracy of the AzTEC image is estimated to be better than arcsec.
2.2 Ancillary data
We use public Herschel Lensing Survey (HLS;111http://herschel.as.arizona.edu/hls/hls.html Egami et al. 2010) data in order to complete the SED of our AzTEC detection (see Section 3.1). HLS is an imaging survey of massive galaxy clusters in the FIR and submillimetre using the Herschel Space Observatory (Pilbratt et al. 2010), that includes observations from both PACS (Poglitsch et al. 2010) and SPIRE (Griffin et al. 2010) instruments at 100, 160, 250, 350, and 500 m, with angular resolutions of , 13, 18, 25, 36 arcsec, respectively.
To search for possible optical counterparts to our AzTEC detection we also use a catalogue from the Cluster Lensing And Supernovae survey with Hubble (CLASH, Postman et al. 2012), which consists of HST observations of massive galaxy clusters. CLASH observations are carried out in 16 bands from the UV to the NIR ( m) and can be used to derive reliable estimates of optical-IR photometric redshifts.
| (mJy) | (mJy) | (mJy) | (mJy) | (mJy) | (mJy) | (mJy) |
| aWe consider the detection to be an upper limit. | ||||||
3 Results
3.1 The (sub-)millimetre source around MACS1149-JD1
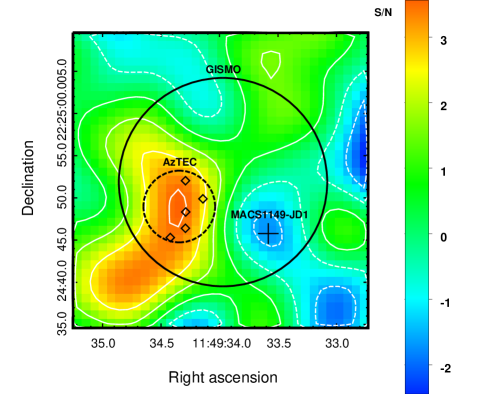
Despite achieving 0.17 mJy r.m.s. we have not found evidence of 1.1 mm continuum emission at the position of MACS1149-JD1. The closest source in our 1.1 mm map has a arcsec offset from MACS1149-JD1 (see Fig. 1), and is detected with an S/N ( mJy) at RA Dec.
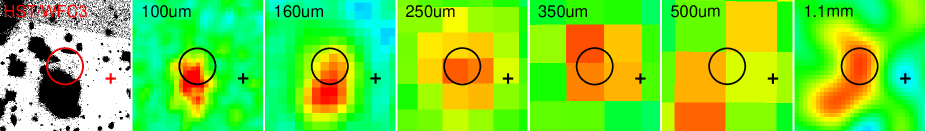
In order to measure the positional uncertainty of this AzTEC source, we randomly insert and extract 100 000 simulated sources from our AzTEC map following the procedure described in Scott et al. (2010). These simulations use the actual AzTEC map and so include random and confusion noise and any associated biases present in the image. We find no instance of a source located at a distance arcsec from the input position, and hence we infer that the probability that the AzTEC source is the counterpart of MACS1149-JD1 is , and therefore we can reject the association. However, our detection lies inside of the GISMO beam (see Fig. 1), and hence both detections likely correspond to the same object. Furthermore, there are significant detections in some Herschel bands within the AzTEC beam (see Fig. 2), which supports our association.
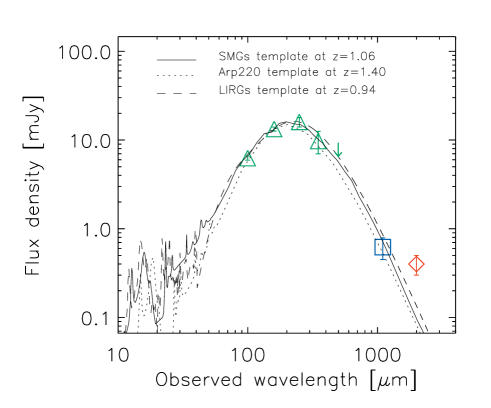
We have obtained the Herschel fluxes at the AzTEC position by fitting a Gaussian function with the corresponding beam FWHM of each Herschel map. We fit the Herschel, AzTEC, and GISMO photometry (see Table 1) with different SED templates, including the local ULIRG galaxy Arp220 (Silva et al. 1998), an average SMG template (Michałowski et al. 2010a) and an average 24 m-selected star-forming galaxy template, corresponding to LIRG luminosity (Kirkpatrick et al. 2012). The range for the photometric redshifts obtained from the SED fitting is (see Fig. 3). This implies that this galaxy likely lies within the lower tail of the redshift distribution of SMGs (e.g. Chapman et al. 2005; Aretxaga et al. 2007; Michałowski et al. 2012a; Yun et al. 2012; Zavala et al. 2014), although with an intrinsic luminosity and star formation rate (SFR) lower than the typical values found for this population of galaxies. From the SED fitting we derive an and SFR yr-1 , where is the lens amplification which, based on public FF lensing models222www.stsci.edu/hst/campaigns/frontier-fields/Lensing-Models (e.g. Richard et al. 2014), is expected to be (depending on redshift and the adopted model).
Our fits do not reproduce well the 2 mm data point. However, confusion noise, which has been well characterized in a shallower GISMO 2 mm-map (Staguhn et al. 2014), may contaminate the measured flux density, as well as surrounding sources. The 2 mm GISMO flux was nevertheless deboosted to the best knowledge of the 2 mm number counts (Dwek, private communication). Using our simulations, we find that the boosting factor for the AzTEC flux density is less than 5 per cent, which is smaller than the calibration error, and hence insignificant.
Searching for possible optical counterparts in the CLASH catalogue, we find five sources within the AzTEC beam (see Fig. 1), with optical photometric redshifts within the range of our estimated (sub-)mm photometric redshift. We propose that one (or a blend) of these galaxies is the real counterpart of the AzTEC and GISMO sources.
We have also detected other AzTEC sources in our extended map with S/N4 which also have Herschel counterparts. These sources, however, are 30 arcsec from MACS1149-JD1. The analysis of these detections will be presented in subsequent papers describing the AzTEC/LMT FF programme (Montaña et al. in preparation; Pope et al. in preparation).
3.2 Constraints on the dust properties of MACS1149-JD1
The AzTEC flux density upper limit of 0.51 mJy (3) at the position of MACS1149-JD1 can be used to obtain an upper limit on the dust mass () for this high-redshift galaxy, once a dust temperature () and a dust mass absorption coefficient are assumed. However, the strong dependence on makes it difficult to obtain meaningful constraints on unless reasonable temperature estimates are available. In particular, for the upper limit of , it is more important to constrain the lower limit of the dust temperature, since lower values of result in higher dust masses (e.g. Hirashita et al. 2014). We compute the mass of dust by assuming a dust mass absorption coefficient m2 kg-1 (Dunne et al. 2003), and by removing the contribution of the cosmic infrared background (CMB) to dust heating as detailed by da Cunha et al. (2013). Finally, to examine the range of , we assume a dust temperature range of K, where is the dust temperature without the contribution due to the CMB heating. Using these values we estimate a dust mass limit of , where the lower limit corresponds to the higher dust temperature. Correcting for the lens amplification (; Zheng et al. 2012), the mass dust limit corresponds to .
Using the yr-1 (Zheng et al. 2012), the SFR- relation found for local galaxies (e.g. da Cunha et al. 2010; Smith et al. 2012) suggests an . This value is slightly higher than our upper limit, which may indicate a deficit of dust when compared to local galaxies. This has been predicted by Hjorth et al. (2014) and has also been found for other high-z galaxies as Himiko at (Ouchi et al. 2013; see also Tan et al. 2014).
We also estimate the upper limit on the intrinsic infrared luminosity (, ) scaling different SED templates to our CMB-corrected AzTEC upper limit. We obtain . Correcting again for the lens amplification, this limit corresponds to . Using the Kennicutt (1998) relation, the total IR luminosity corrected for magnification converts to a dust-obscured star formation rate of yr-1.
A proxy for the UV attenuation () may be constrained by combining our observed limit on and the estimated by Zheng et al. (2012), where , as in Michałowski et al. (2012b). We obtained a limit of mag ( mag, assuming the SMC attenuation curve). This limit is comparable to those derived for other Ly and Lyman break galaxies at (Schaerer et al. 2015; Watson et al. 2015).
4 Summary
We present arcsec FWHM angular resolution observations at 1.1 mm with the AzTEC camera on the LMT towards the galaxy MACS1149-JD1, for which a possible 2 mm detection with the GISMO camera has been reported. These new observations are a factor of better in angular resolution and a factor of deeper than the GISMO observations assuming an average SMGs template (Michałowski et al. 2010a) at (or similar depth at ). However, despite the achieved depth of mJy in the AzTEC map, we have not found evidence of 1.1 mm continuum emission at the position of MACS1149-JD1.
A AzTEC detection at arcsec from MACS1149-JD1, consistent with the GISMO position, is the most likely counterpart for the GISMO source. Combining the AzTEC and GISMO photometry with Herschel ancillary data we derive a , which further indicates that this galaxy is not associated with MACS1149-JD1.
Finally, from the non-detection of the galaxy MACS1149-JD1, we derive the following () upper limits corrected for gravitational lensing magnification and for CMB effects: dust mass , IR luminosity , SFR yr-1, and UV attenuation mag. These values, which represent some of the highest redshift estimations for these quantities, are consistent with measurements in other galaxies.
Acknowledgements
This work would not have been possible without the longterm financial support from the Mexican Science and Technology Funding Agency, CONACYT, during the construction and early operational phase of the LMT, as well as support from the US NSF, the Instituto Nacional de Astrofísica, Óptica y Electrónica (INAOE) and the University of Massachusetts (UMASS). This work has been mainly supported by Mexican CONACyT research grants CB-2011-01-167291 and CB-2009-133260. JAZ acknowledges support from a CONACyT studentship. MJM acknowledges the support of the UK Science and Technology Facilities Council (STFC), British Council Researcher Links Travel Grant, and the hospitality at INAOE. JSD acknowledges the support of the European Research Council through the award of an ERC Advanced Grant. Herschel is an ESA space observatory with science instruments provided by European-led Principal Investigator consortia and with important participation from NASA. This work utilizes gravitational lensing models produced by PIs Bradač, Ebeling, Merten & Zitrin, Sharon, and Williams funded as part of the HST Frontier Fields programme conducted by STScI. STScI is operated by the Association of Universities for Research in Astronomy, Inc. under NASA contract NAS 5-26555. The lens models were obtained from the Mikulski Archive for Space Telescopes (MAST).
References
- Aretxaga et al. (2007) Aretxaga I. et al., 2007, MNRAS, 379, 1571
- Berger et al. (2014) Berger E. et al., 2014, ApJ, 796, 96
- Calura et al. (2014) Calura F., Gilli R., Vignali C., Pozzi F., Pipino A., Matteucci F, 2014, MNRAS, 438, 2765
- Chapman et al. (2005) Chapman S. C., Blain A. W., Smail I., & Ivison R. J., 2005, ApJ, 622, 772
- da Cunha et al. (2010) da Cunha E., Eminian C., Charlot S., & Blaizot J., 2010, MNRAS, 403, 1894
- da Cunha et al. (2013) da Cunha E. et al., 2013, ApJ, 766, 13
- Draine (2003) Draine B. T., 2003, ARA&A, 41, 241
- Dunne et al. (2003) Dunne L., Eales S., Ivison R., Morgan H., Edmunds M., 2003, Nature, 424, 285
- Dwek et al. (2007) Dwek E., Galliano F., Jones, A. P., 2007, ApJ, 662, 927
- Dwek et al. (2014) Dwek E., Staguhn J., Arendt R. G., Kovacks A., Su T., Benford D. J., 2014, ApJ, 788, L30
- Ebeling et al. (2007) Ebeling H., Barrett E., Donovan D., Ma C.-J., Edge A. C., van Speybroeck L., 2007, ApJ, 661, L33
- Egami et al. (2010) Egami E. et al., 2010, A&A, 518, L12
- Fan et al. (2003) Fan X. et al., 2003, AJ, 125, 1649
- Fisher et al. (2014) Fisher D. B. et al., 2014, Nature, 505, 186
- González-López et al. (2014) González-López J. et al., 2014, ApJ, 784, 99
- Griffin et al. (2010) Griffin M. J. et al. 2010, A&A, 518, L3
- Hirashita et al. (2014) Hirashita H., Ferrara A., Dayal P., Ouchi M., 2014, MNRAS, 443, 1704
- Hjorth et al. (2014) Hjorth J., Gall, C., Michałowski M. J., 2014, ApJ, 782, L23
- Hughes et al. (2010) Hughes D. H. et al., et al., 2010, in Stepp L. M., Gilmozzi R., Hall H. J., eds, Proc. SPIE Conf. Ser. Vol. 7733, Ground-based and Airbone Telescope III. SPIE, Bellingham, p.12
- Hunt et al. (2014) Hunt L. K. et al., 2014, A&A, 561, A49
- Ivison et al. (2007) Ivison, R. J. et al., 2007, MNRAS, 380, 199
- Kennicutt (1998) Kennicutt R. C., Jr., 1998, ApJ, 498, 541
- Kirkpatrick et al. (2012) Kirkpatrick A. et al., 2012, ApJ, 759, 139
- Mancini et al. (2015) Mancini M., Schneider R., Graziani L., Valiante R., Dayal P., Maio U., Ciardi B., Hunt L., K., 2015, MNRAS, 451, L70
- Mattsson (2015) Mattsson L., 2015, preprint (arXiv:1505.04758)
- Michałowski (2015) Michałowski, M. J., 2015, A&A, 577, A80
- Michałowski et al. (2010a) Michałowski M., Hjorth J., Watson D., 2010a, A&A, 514, A67
- Michałowski et al. (2010b) Michałowski M. J., Murphy E. J., Hjorth J., Watson D., Gall C., Dunlop J., 2010b, A&A, 522, A15
- Michałowski et al. (2012a) Michałowski M. J., et al., 2012a, MNRAS, 426, 1845
- Michałowski et al. (2012b) Michałowski M. J. et al., 2012b, ApJ, 755, 85
- Ota et al. (2014) Ota K. et al., 2014, ApJ, 792, 34
- Ouchi et al. (2013) Ouchi M. et al., 2013, ApJ, 778, 102
- Pilbratt et al. (2010) Pilbratt G. L. et al., 2010, A&A, 518, L1
- Planck Collaboration XVI (2014) Planck Collaboration XVI, 2014, A&A, 571, A16
- Poglitsch et al. (2010) Poglitsch A. et al., 2010, A&A, 518, L2
- Postman et al. (2012) Postman M. et al., 2012, ApJ, 199, 25
- Richard et al. (2014) Richard J. et al., 2014, MNRAS, 444, 268
- Riechers et al. (2013) Riechers D. A. et al., 2013, Nature, 496, 329
- Schaerer et al. (2015) Schaerer D., Boone F., Zamojski M., Staguhn J., Dessauges-Zavadsky M., Finkelstein S., Combes F., 2015, A&A, 574, A19
- Scott et al. (2008) Scott K. S. et al., 2008, MNRAS, 385, 2225
- Scott et al. (2010) Scott K. S. et al., 2010, MNRAS, 405, 2260
- Silva et al. (1998) Silva L., Granato G. L., Bressan A., Danese, L., 1998, ApJ, 509, 103
- Smith et al. (2012) Smith D. J. B. et al., 2012, MNRAS, 427, 703
- Staguhn et al. (2008) Staguhn J. G. et al. 2008, Proc. SPIE, 7020, 702004
- Staguhn et al. (2014) Staguhn J. G. et al., 2014, ApJ, 790, 77
- Tan et al. (2014) Tan Q. et al., 2014, A&A, 569, A98
- Valiante et al. (2014) Valiante R., Schneider R., Salvadori S., Gallerani, S., 2014, MNRAS, 444, 2442
- Venemans et al. (2012) Venemans B. P. et al., 2012, ApJL, 751, L25
- Walter et al. (2012) Walter F. et al., 2012, ApJ, 752, 93
- Watson et al. (2015) Watson D., Christensen L., Knudsen K. K., Richard J., Gallazzi A., Michałowski M. J., 2015, Nature, 519, 327
- Wilson et al. (2008) Wilson G. W. et al., 2008, MNRAS, 386, 807
- Yun et al. (2012) Yun M. S. et al., 2012, MNRAS, 420, 957
- Zavala et al. (2014) Zavala J. A., Aretxaga I., Hughes D. H., 2014, MNRAS, 443, 2384
- Zavala et al. (2015) Zavala J. A., et al., 2015, MNRAS, 452, 1140
- Zheng et al. (2012) Zheng W., et al., 2012, Nature, 489, 406