Isotope shift of 40,42,44,48Ca in the transition
Abstract
We report on improved isotope shift measurements of the isotopes 40,42,44,48Ca in the (D2) transition using collinear laser spectroscopy. Accurately known isotope shifts in the (D1) transition were used to calibrate the ion beam energy with an uncertainty of V. The accuracy in the D2 transition was improved by a factor of . A King-plot analysis of the two transitions revealed that the field shift factor in the D2 line is about 1.8(13) % larger than in the D1 transition which is ascribed to relativistic contributions of the wave function.
1 Introduction
Hyperfine structure and isotope shifts have been studied in various transitions of calcium isotopes for decades both experimentally (see e.g. [1, 2, 3, 4, 5, 6, 7, 8, 9, 10, 11, 12]) and theoretically (e.g. [13, 14, 15, 16, 17, 18]). This is due to the importance of this element in various fields: With 40Ca and 48Ca the calcium isotopic chain is the only one that contains two naturally occurring doubly magic isotopes. Moreover, the nuclear charge radii along these stable isotopes show a very peculiar behaviour, having a maximum at 44Ca, a strong odd-even staggering and almost identical charge radii for 40Ca and 48Ca [19, 20] despite the large difference in nuclear mass. The isotopic chain has therefore been of great interest for nuclear structure physics.
Additionally, the long-lived isotope 41Ca can be used for dating applications [21] as well as a tracer in biology and medicine to study the physiology of calcium in the human body [22, 23, 24]. Hence, isotope shifts and hyperfine structure were also studied in several atomic transitions [25, 26] for isotope selective resonance ionization and ultra-trace analysis [27]. The calcium ion is a workhorse in the field of quantum-optical applications in ion traps and has thus also been studied with high accuracy[10, 28, 29]. Moreover, the isotope shift information in the infrared triplet [30] has led to the discovery of an anomalous isotopic composition in mercury-manganese (HgMn) stars, in which the isotopic Ca ratio in the stellar atmosphere is dominated by 48Ca [31, 32].
Precision data are available for many transitions, but the isotope shift in the transition of calcium, often called D2 line111since it is isoelectronic to the corresponding Fraunhofer D2 line in Na, is only known with moderate accuracy [33], even though this transition is preferred for studies of nuclear moments in short-lived isotopes. It allows for an extraction of the nuclear spectroscopic quadrupole moment from the electric hyperfine structure, in contrast to the (D1) transition. This is of special importance because of the revived interest of nuclear structure physics in spectroscopic information on stable and short-lived calcium isotopes. The interest concentrates on the neutron-rich region where new shell closures have been observed recently for the isotopes 52,54Ca at neutron numbers [34] and [35]. These shell closures are associated with three-nucleon forces and can be studied theoretically using chiral effective field theory [17, 36]. In order to provide additional information about these shell closures, nuclear moments and isotope shifts of neutron-rich calcium isotopes have been studied at ISOLDE/CERN. The COLLAPS collaboration has measured hyperfine structure and isotope shifts beyond , namely the isotopes 49-52Ca. Results for the nuclear moments have already been reported [37], while the analysis of the isotope shifts is hampered by the large uncertainties in the D2 isotope shifts of the stable isotopes. These data are required because of the large measuring uncertainty of the exact high voltage potential of the RFQ cooler and buncher ISCOOL [38, 39]. This device is used to collect the ions delivered from the ISOLDE on-line ion source and to send them in short bunches towards the collinear laser spectroscopy setup.
The ion beam energy is usually the limiting systematic uncertainty for isotope shift measurements in collinear laser spectroscopy. But if accurate isotope shifts are available for several isotopes, the beam energy can be calibrated using this information.
In order to provide the required reference data for the analysis of the short-lived isotopes, we have performed isotope shift measurements of 40,42,44,48Ca+ at the TRIGA-LASER setup in the Institute of Nuclear Chemistry in Mainz [40].
High-accuracy data of the isotope shifts in the transition, recently obtained using logical spectroscopy in an ion trap with an accuracy better than kHz [29], were used for a reliable calibration of the ion source potential. In this way we have extracted the isotope shifts in the D2 line with up to tenfold improved accuracy. In addition, the two transitions D1 and D2 can be compared via a King plot to examine the effect of the electron density of the electron at the nucleus. Similar studies have previously been performed for instance in Ba [41], Mg [42] and Ra [43].
2 Experimental setup
The TRIGA-LASER experiment is part of the TRIGA-SPEC setup at the TRIGA research reactor Mainz [40]. The reactor will provide exotic nuclei produced by neutron-induced fission inside the reactor core for ’online’ collinear laser spectroscopy measurements.
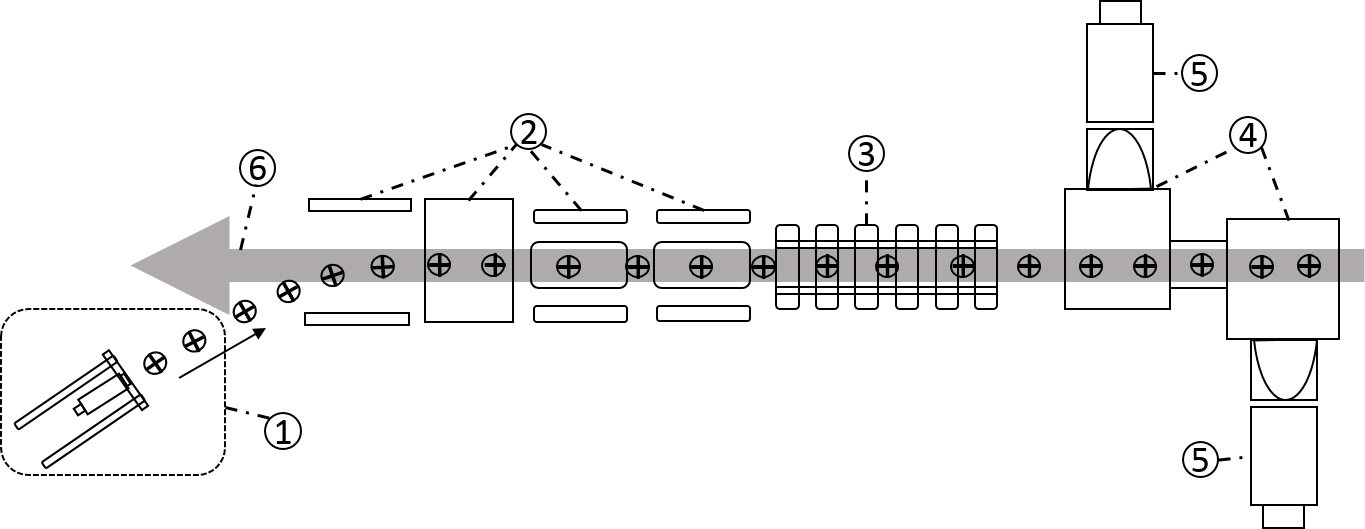
The measurements on stable calcium isotopes presented in this work were performed on ion beams of typically nA with the natural isotopic composition produced in an offline ion source: A graphite tube with a central bore was filled with a few grains of metallic calcium. This crucible was heated by applying a current of about 50 A causing a voltage drop of about V along the crucible. The complete ion source is mounted on a high-voltage platform to which a potential of about is applied. The ions are accelerated towards ground potential. The ion source voltage is generated by a Heinzinger PNChp60000-10ump power supply with a relative stability specified to be better than . The potential of the high-voltage platform is continuously monitored and recorded using a Julie Research KV-10R high-voltage divider.
The divider ratio is known with a relative precision of and a high-precision voltmeter of the type Agilent 34401A is used to measure the voltage across the precision resistor at the end of the divider chain. The divider ratio has been determined by comparison with the KATRIN high-voltage divider [44, 45] at the University of Münster. The starting potential of the ions inside the graphite furnace can differ from the platform potential by up to 4 V due to the voltage drop caused by direct heating of the graphite furnace.
A deflector is used to superimpose the uv-laser beam with the ion beam in anticollinear geometry.
The beamline is equipped with two pairs of deflector electrodes in vertical and horizontal direction and a quadrupole doublet for beam steering and shaping.
Superposition of the two beams is ensured using several apertures with different sizes at two positions of the beamline.
The optical detection region is supplied with two mirror systems for light collection and appropriate photomultiplier tubes. They are mounted on an insulated platform to allow for Doppler-tuning by accelerating or decelerating the ions into the detection region. An offset potential of up to kV can be applied to the platform by a high-voltage device with similar specifications as described above. This supply is again mounted on a platform and can be raised in potential by a Kepco BOP 500M fast high-voltage amplifier. This allows fast Doppler scanning across V, corresponding to almost 30 GHz scanning range in the case of calcium and 10 kV beam energy. The voltages applied to this platform during the measurements were also continuously monitored and recorded by a high-voltage divider and an Agilent 34401A.
A Matisse TS titanium:sapphire (Ti:Sa) ring-laser pumped by a Verdi Nd:YVO4 laser is used to produce infrared light at and for excitation of the and the transition, respectively, after second-harmonic generation in a Wavetrain frequency doubling cavity. The Ti:Sa laser is actively stabilized to an external cavity to correct for short-term fluctuations and to a FC1500 frequency comb to ensure long-term stability and an accurately known laser frequency during the measurements. The linewidth of the laser is approximately 250 kHz per 4 hours. The uv light is coupled to a 180 m long single-mode fiber and transported to the beamline. The beam leaving the fiber is collimated, beam-halo is removed by a spatial mode filter to reduce scattered light background and coupled into the beamline through a quartz window. The light leaves the vacuum system through a second window on the opposite side of the beamline. The light power was kept below 150 W in a beam of approximately 1.5 mm diameter and no appreciable sign of saturation broadening was observed at these intensities. With the optical detection setup composed of two mirror systems based on non-imaging optics an efficiency of one detected fluorescence photon per 200 calcium ions has been demonstrated for the even isotopes without hyperfine splitting.
3 Experimental procedure
We have performed measurements in the transition before and after the measurements in the line. All measurements were performed at a constant starting potential without changing the ion optical settings and with the same laser system. For switching between the two transitions, the laser was changed in wavelength and the SHG cavity was optimized again. The fiber transport of the laser beam ensured that the alignment of the laser through the beamline did not change. The laser frequencies for both transitions were chosen such that comparable voltages had to be applied to the optical detection region for each isotope in order to avoid systematic changes of beam focussing. To increase the measurement accuracy, spectra of the heavier calcium isotopes were always alternated with reference measurements of 40Ca+.
4 Analysis
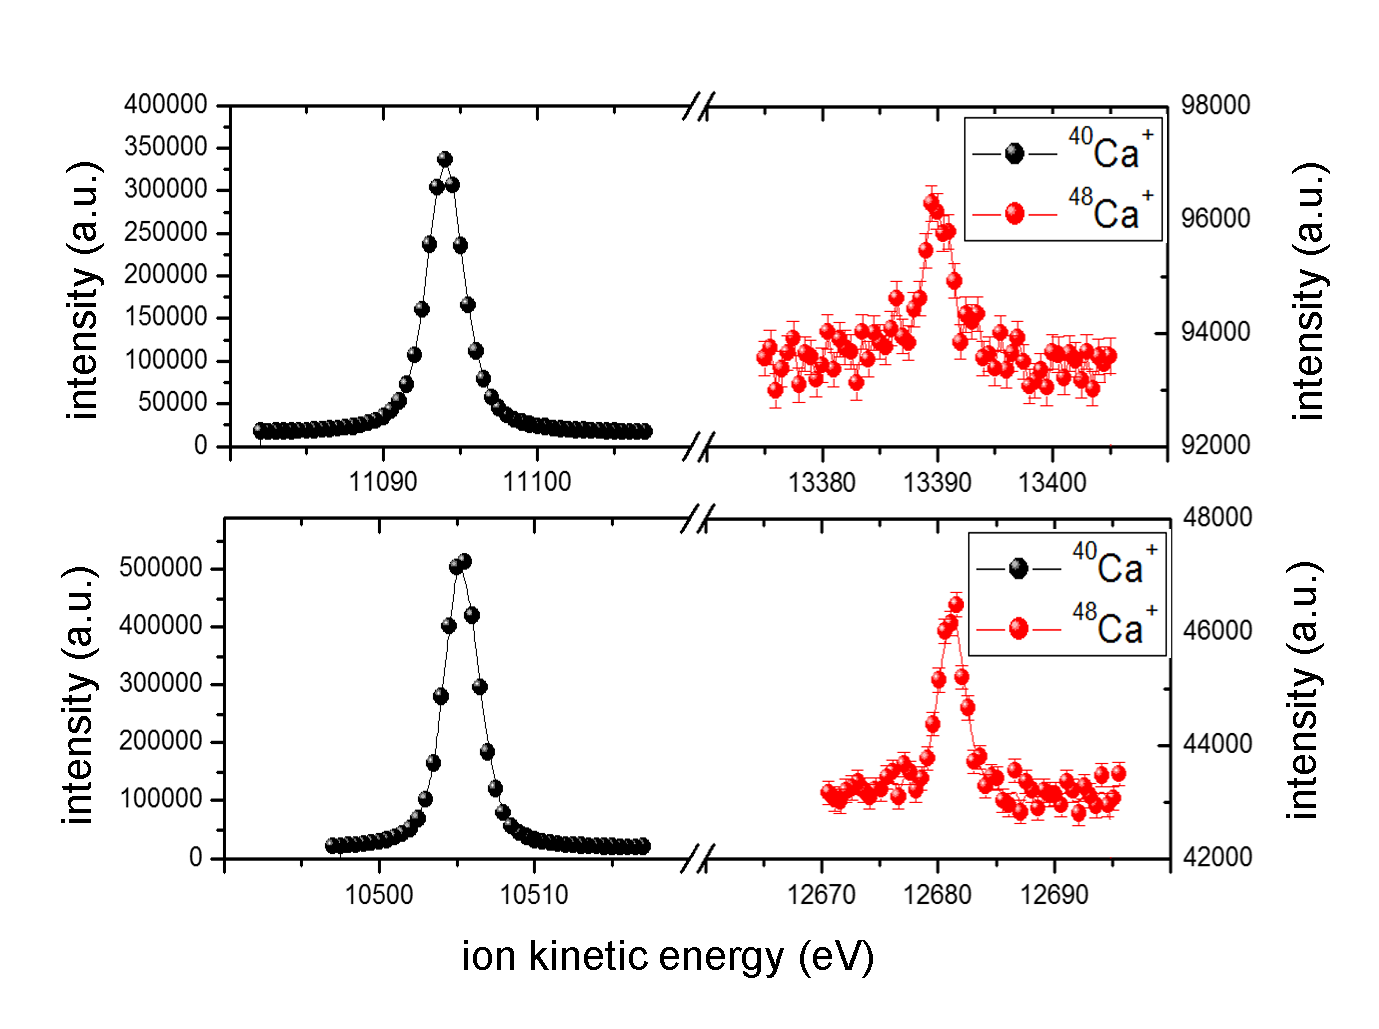
Line profiles of 40Ca+ and 48Ca+ in both transitions are depicted in Fig. 2. In the analysis of the spectra, for each data point the total acceleration voltage was converted into the corresponding Doppler-shifted frequency in the rest frame of the Ca+ ion. All lines were then fitted with Voigt profiles using a fixed Lorentzian width of (natural linewidth). Gaussian linewidth , amplitude, background and peak center position were used as free parameters. The linewidth parameter MHz was obtained from the fitting routine, with little changes between the isotopes due to the different masses.
A slight asymmetry that is observed in the peak shape was similar for all isotopes. Tests with different lineshapes that better fitted to the profile, did not result in any significant change in the isotope shift.
4.1 Beam energy calibration
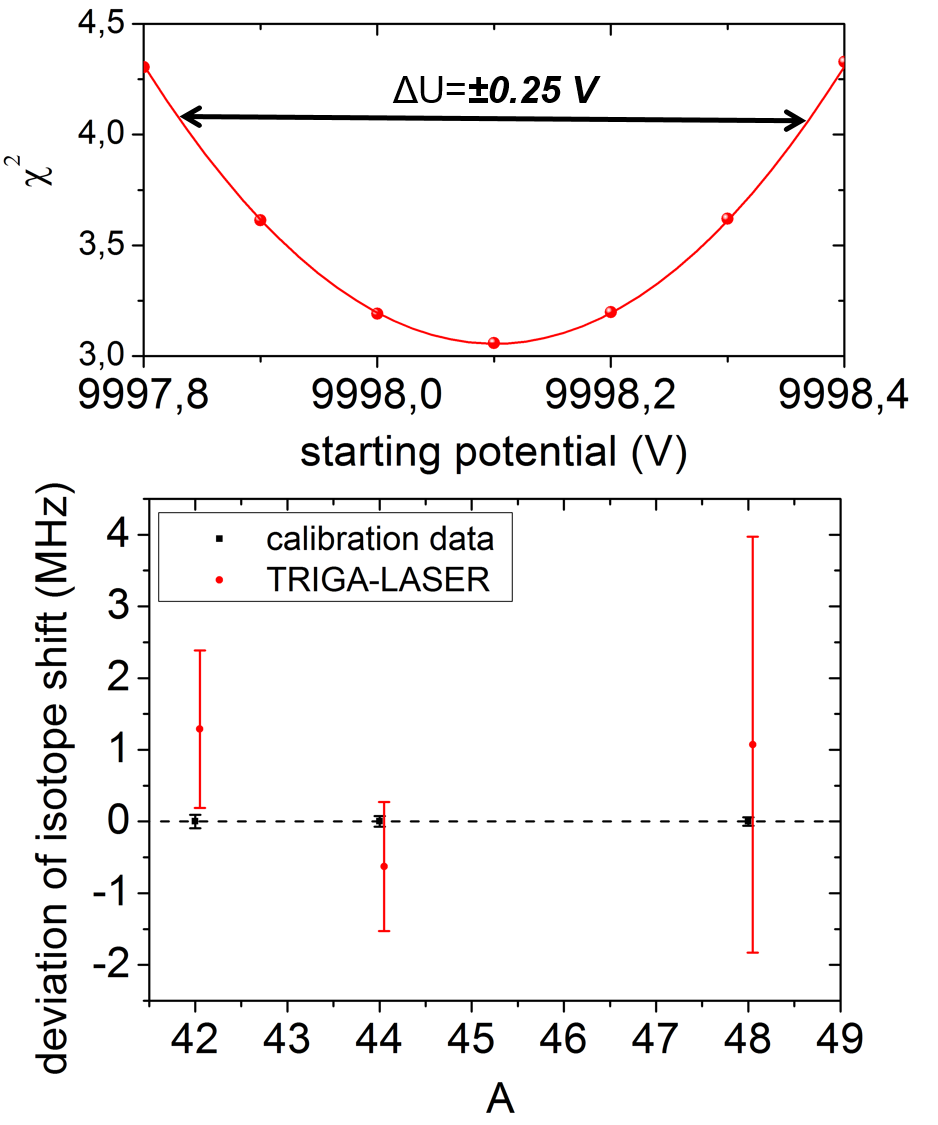
To increase the measurement accuracy, resonance scans of the isotope of interest XCa+ () and the reference isotope 40Ca+ were alternated such that two scans of XCa+ were interleaved by four scans of 40Ca+ to reduce the influence of long-term fluctuations. The whole measuring cycle (cycle I) was repeated at a day about three months later (cycle II). In the meantime the beamline was modified at different points and everything was readjusted. As described above, the starting potential is known to , where the uncertainties are determined by the accuracy of the voltage measurement () and the voltage drop along the crucible that will always lead to a higher voltage than that applied to the platform. To reduce the uncertainty, the resulting isotope shifts of all isotopes in the D1 line for various starting potentials between V and kV were derived and for each voltage the mean square deviation from the precise calibration data
| (1) |
with the purely statistical uncertainty , was calculated.
The value of obtained as a function of the starting potential is plotted in Fig. 3 for the case of the second cycle. The data are very well fitted by a parabola and the minimum of the curve is the most probable starting potential. The uncertainty is estimated to be V, which corresponds to an increase of by 1 as indicated in Fig. 3. The results are for the first and for the second measuring cycle. The small change in the starting potential is within the uncertainty of the results and might actually be due to a shifted ionization region for the ions within the graphite furnace caused by, e.g., different filling levels with calcium.
The results of the calibration measurements are presented in the lower panel of Fig. 3.
Shown are the statistical uncertainties. The absolute values of the isotope shifts can be found in Table 1.
4.2 Results
With the calibrated starting potential we can derive the isotope shifts in the transition. All measurements of 40,42,44,48Ca+ of both cycles have been combined to yield the isotope shift values listed in Table 1.
The first bracket for each value shows the statistical uncertainty which is the standard deviation of all measurements and the second bracket represents the systematic uncertainty. The latter depends mainly on the two voltage uncertainties: the one of the starting potential and the one of the voltage floating the optical detection region . The systematic uncertainty is derived as [46]:
| (2) |
with
| (3) |
and
| (4) |
and the reference mass , the mass difference , the speed of light and the laser frequency . The isotope masses have been derived from the AME2012 atomic-mass evaluation table [47], taking into account the mass of the missing electron while the missing binding energy of the electron needs not to be considered here.
The offset voltages were measured continuously using a voltage divider providing a relative uncertainty of the respective acceleration voltage of /.
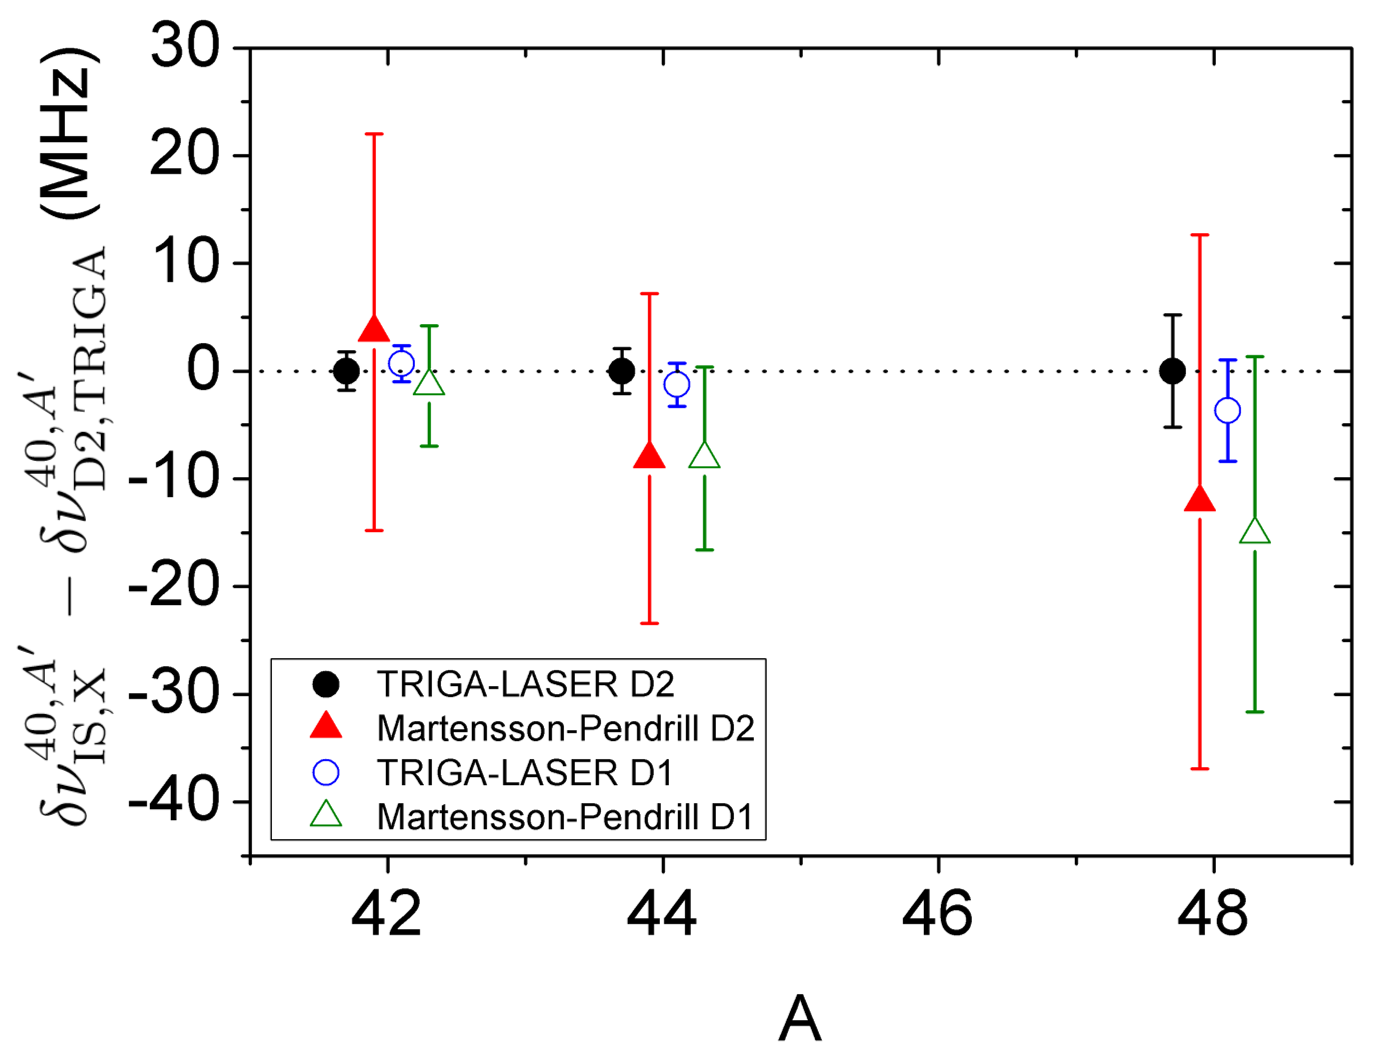
The determined isotope shifts are shown in Fig. 4 where the error bars represent the total uncertainty which was obtained as the geometrical average of the statistical and the systematic uncertainty. The agreement with literature as well as the significant improvement in accuracy is clearly visible.
| A | Ref | ||
| (MHz) | (MHz) | ||
| 42 | 427.0 (11) | 426.4(15) | |
| 425(4) | 430 (18) | [33] | |
| 425.706(94) | [29] | ||
| 848.8(9) | 850.1(10) | ||
| 842(3) | 842(13) | [33] | |
| 849.534(74) | [29] | ||
| 1707.2 (29) | 1710.6(35) | ||
| 1696(4) | 1699(19) | [33] | |
| 1705.389(60) | [29] |
The isotope shift between two isotopes and is caused by the change in mass and volume of the nuclei and can be split into the mass shift (MS) and the field shift (FS).
| (5) |
The functional relation
| (6) |
with field shift factor , mass shift constant and change in mean square charge radius is well known (see e.g. [33]). Both, the field and the mass shift depend on the investigated transition, but is identical in both transitions. Hence it can be eliminated by comparing two transitions and . Eq. (6) can thus be transformed into a linear relation between the isotope shifts in two transitions[48, 49]:
| (7) |
where
| (8) |
is the modified isotope shift.
The modified isotope shifts in the D2 line determined here are plotted in Fig. 5 as a function of the modified isotope shift in the D1 line as measured in the ion trap [29]. The data show an excellent linear behaviour as expected from Eq. 7. From the linear regression we obtained the ratio of the field shift factors of / which deviates from unity by .
The field shift factor is proportional to the difference of the electron probability density at the nucleus
| (9) |
and might therefore be slightly smaller for D1 since the electron can obtain a small admixture of to the wavefunction. This would result in a ratio slightly larger than 1 as observed. For a firm statement, a higher precision is needed.
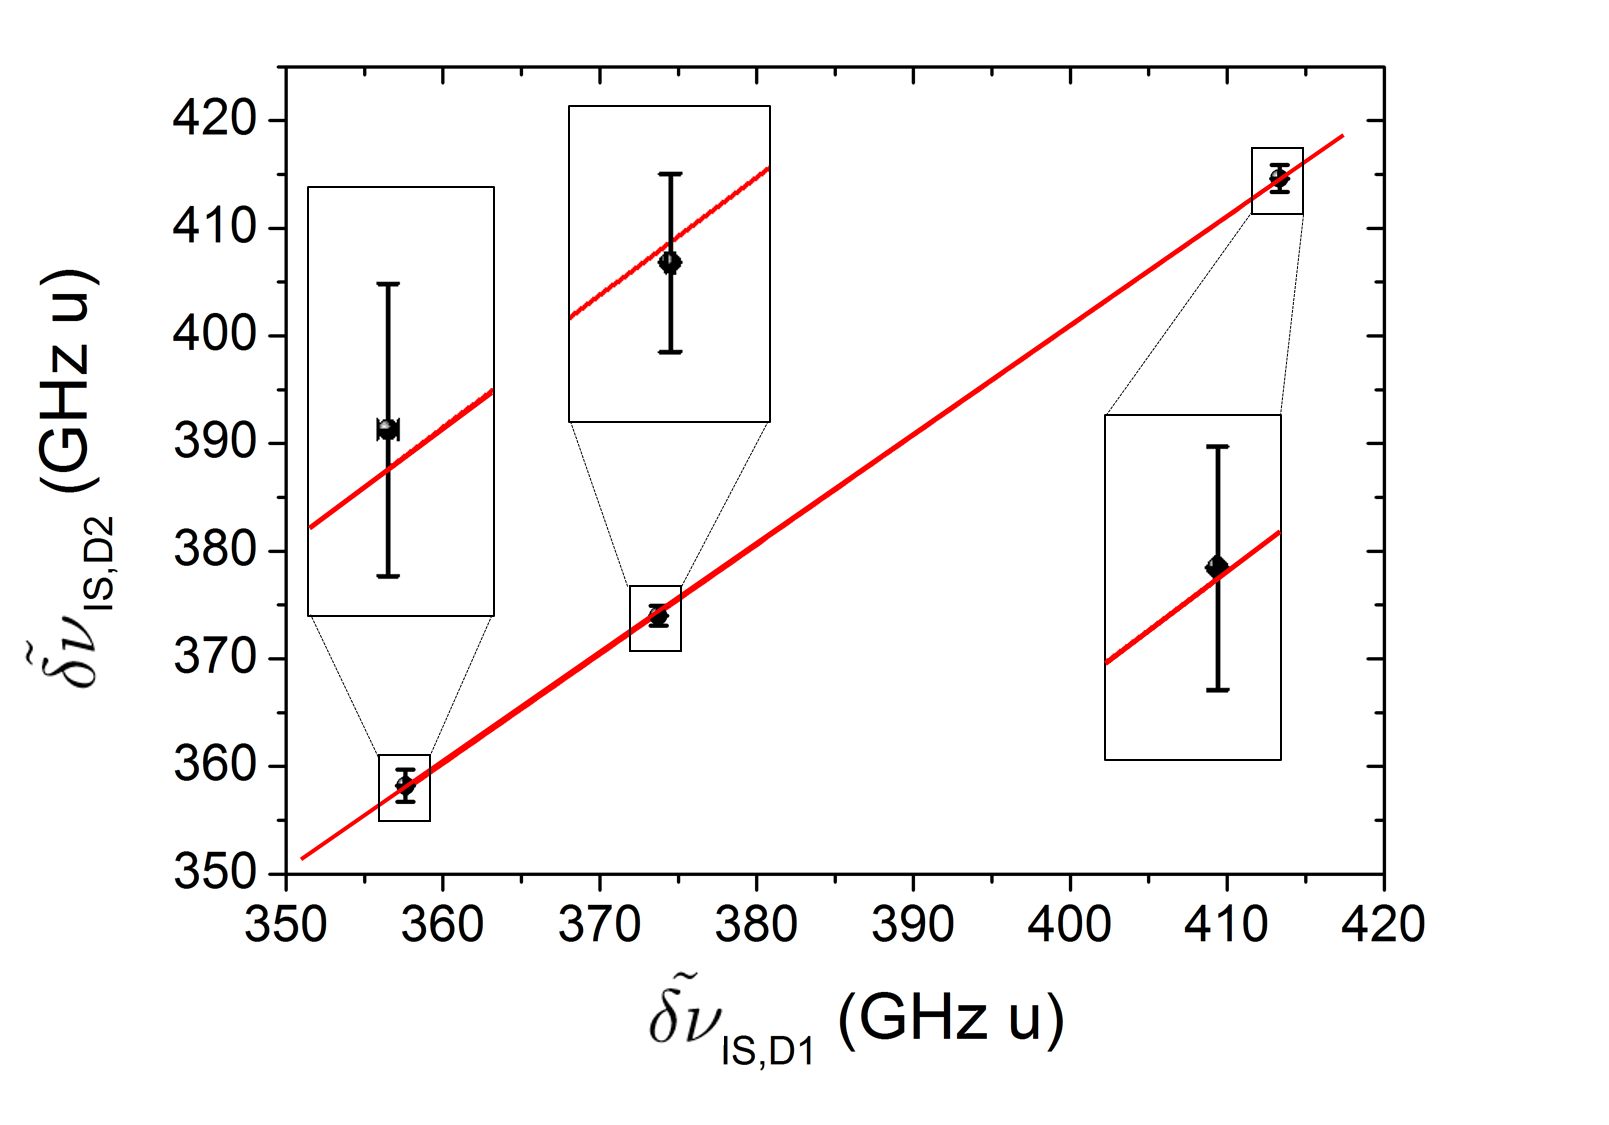
From the -axis intersection we can obtain the ”weighted” difference between the specific mass shifts, which is
| (10) |
as well compatible with zero within . In order to improve the accuracy of the field shift factor ratio and the mass shifts, more precise measurements in a Paul trap will be carried out in the D2 line [50].
5 Conclusion
We have performed precision measurements of the isotope shifts in the D1 and the D2 transition in singly ionized calcium. The results agree with existing literature values and improve the accuracy in the D2 line considerably. They provide important reference data for isotope shift values of stable calcium ions and helpful calibration data for collinear laser spectroscopy measurements on the neutron-rich isotopes beyond 48Ca investigating the transition.
The field shift in the D2 line is 1.8(13) % larger than in the D1 line. This observation might be used as a benchmark for relativistic atomic structure calculations.
6 Acknowledgments
We acknowledge financial support from the German Federal Ministry for Education and Research (BMBF) under contract 05P12UMFN8, the Helmholtz Association of National Research Centers under contract VH-NG-148, the Helmholtz International Center for FAIR (HIC for FAIR) within the LOEWE program by the State of Hesse, and the Precision Physics, Fundamental Interactions and Structure of Matter Cluster of Excellence (PRISMA). N.F. received support through GRK Symmetry Breaking (DFG/GRK 1581), M. H. and S. K. from HGS-Hire and A. K. from the Carl-Zeiss-Stiftung (AZ:21-0563-2.8/197/1).
References
- [1] R.E. Silverans et al., Z. Phys. D 18, 351 (1991).
- [2] C.W. Palmer et al., J. Phys. B 17, 2197 (1984).
- [3] L. Vermeeren et al., Phys. Rev. Lett. 68, 1679 (1992).
- [4] A. Mortensen et al., Phys. Rev. A 69, 042502 (2004).
- [5] E. Brun et al., Phys. Rev. Lett. 9, 166 (1962).
- [6] D. Lucas et al., Phys. Rev. A 69, 012711 (2004).
- [7] M. Bini et al., Lettere al Nuovo Cimento 5, 14 (1972).
- [8] E. Salumbides et al., Phys. Rev. A 83, 012502 (2011).
- [9] P. Grundevik et al., Phys. Rev. Lett. 42, 1528 (1979).
- [10] A.L. Wolf et al., Phys. Rev. Lett. 102, 223901 (2009).
- [11] A. Andl et al., Phys. Rev. C 26, 2194 (1982).
- [12] A. Gade et al., Phys. Rev. C 74, 021302 (2006).
- [13] E. Caurier et al., Phys. Lett. B 522, 240 (2001).
- [14] J. D. Holt et al., Jour. Phys. G 40, 075105 (2013).
- [15] R. Roth et al., Phys. Rev. Lett. 109, 052501 (2012).
- [16] V. Somà et al., Phys. Rev. C 89, 061301 (2014).
- [17] G. Hagen et al., Phys. Rev. Lett. 109, 032502 (2012).
- [18] J. D. Holt et al., Jour. Phys. C 90, 024312 (2014).
- [19] H. D. Wohlfahrt et al., Phys. Lett. 73B, 131 (1978).
- [20] H. J. Emrich et al., Nucl. Phys. A 396, 401 (1983).
- [21] K. Brown et al., Mass Spectrometry Rev. 25, 127 (2006).
- [22] E. Denk et al., Anal. Bioanal. Chem. 386, 1587 (2006).
- [23] K.W. Turteltaub and J.S. Vogel, Curr. Pharm. Design 6, 991 (2000).
- [24] J.S. Vogel et al., Nucl. Instr. Meth. Phys. Res. B 123, 241 (1997).
- [25] W. Nörtershäuser et al., Spectrochimica Acta B 53, 709 (1998).
- [26] P. Müller et al., Eur. Phys. J. D 12, 33 (2000).
- [27] Z.-T. Lu and K.D.A. Wendt, Rev. Sc. Instr. 74, 1169 (2003).
- [28] Y. Wan et al., Nature Comm. 5, 4096 (2014).
- [29] F. Gebert et al., Phys. Rev. Lett. 115, 053003 (2015).
- [30] W. Nörtershäuser et al., Eur. Phys. J. D 2, 33 (1998).
- [31] F. Castelli and S. Hubrig, Astronomy & Astrophysics 421, L1 (2004).
- [32] C.R. Cowley and S. Hubrig, Astronomy & Astrophysics 432, L21 (2005).
- [33] A.-M. Mårtensson-Pendrill et al., Phys. Rev. A 45, 4675 (1992).
- [34] F. Wienholtz et al., Nature 498, 346 (2013).
- [35] D. Steppenbeck et al., Nature 502, 207 (2013).
- [36] J. D. Holt et al., Jour. Phys. G 39, 085111 (2012).
- [37] R.F. Garcia Ruiz et al., Phys. Rev. C 91, 041304(R) (2015).
- [38] H. Frånberg et al., Nucl. Instr. Meth. Phys. Res. B 266, 4502 (2008).
- [39] E. Mané et al., Eur. Phys. J. A 42, 503 (2009).
- [40] J. Ketelaer et al., Nucl. Instr. Meth. Phys. Res. A 594, 162 (2008).
- [41] K. Wendt et al., Z. Phys. A 318, 125 (1984).
- [42] V. Batteiger et al., Phys. Rev. A 80, 022503 (2009).
- [43] W. Neu et al., Z. Phys. D 11, 105 (1989).
- [44] Th. Thuemmler et al., New Jour. Phys. 11, 103007 (2009).
- [45] S. Bauer et al., Jour. Instr. 8, P10026 (2013).
- [46] A. C. Mueller et al., Nucl. Phys. A 403, 234 (1983).
- [47] M. Wang et al., Chin. Phys. C 36, 1603 (2012).
- [48] W.H. King, Proceedings of the Royal Society of London Series A 280, 430 (1964).
- [49] K. Heilig and A. Steudel, Atomic Data and Nuclear Data tables 14, 613 (1974).
- [50] private communication, Piet O. Schmidt (PTB)