Interplay between effective mass anisotropy and Pauli paramagnetic effects in a multiband superconductor —Application to Sr2RuO4—
Abstract
We investigate the mixed state properties in a type II multiband superconductor with uniaxial anisotropy under the Pauli paramagnetic effects. Eilenberger theory extended to a multiband superconductor is utilized to describe the detailed vortex lattice properties, such as the flux line form factors, the vortex lattice anisotropy and magnetic torques. We apply this theory to Sr2RuO4 to analyze those physical quantities obtained experimentally, focusing on the interplay between the strong two-dimensional anisotropy and the Pauli paramagnetic effects. This study allows us to understand the origin of the disparity between the vortex lattice anisotropy (60) and the anisotropy (20). Among the three bands; with the effective mass anisotropy 180, with 120, and with 60, the last one is found to be the major band, responsible for various magnetic responses while the minor band plays an important role in the vortex formation. Namely, in a field orientation slightly tilted away from the two dimensional basal plane those two bands cooperatively form the optimal vortex anisotropy which exceeds that given by the effective mass formula with infinite anisotropy. This is observed by small angle neutron scattering experiments on Sr2RuO4. The pairing symmetry of Sr2RuO4 realized is either spin singlet or spin triplet with the d-vector strongly locked in the basal plane. The gap structure is that the major band has a full gap and the minor band has a like gap.
pacs:
74.25.Uv, 74.70.Pq, 74.25.Ha, 61.05.fgI Introduction
It is now widely recognized that multiband superconductors are omnipresent perali . This recognition may be triggered by MgB2 akimitsu where there exist distinctive two bands; the 3D -band and 2D like -bandmazin . They play different role in forming superconductivity, in particular in magnetic properties under an applied field, such as symmetry of vortex latticeshirano or the form factors probed by small angle neutron scattering (SANS) experimentsmortenmgb2 . To understand its detailed magnetic response, a two band model is indispensable. In fact different dimensionality of the band structures between the -band and -band gives rise to rotation of the triangular vortex lattice under varying fieldhirano . The form factors of SANS experiments clearly demonstrate a gradual change of the two components of the -band and -band as field variesmortenmgb2 . It is also true for other materials among unconventional and conventional superconductors where multiband description is essential, such as heavy fermion superconductors kittakace ; shimizu and iron pnictides kittaka122 ; kuhn .
We have been seeing that the Pauli paramagnetic effect (PPE) is important when combined with this multiband effect in certain superconductors, which give rise to a variety of unexpected phenomena. Typical examples are the oldest heavy fermion superconductors CeCu2Si2kittakace and UBe13 shimizu , and also KFe2As2 kittaka122 ; kuhn , which necessitate the multiband description in fully understanding of their vortex properties. Those include the hidden first order transition phenomenon tsutsumi and the disparity kuhn between the vortex lattice anisotropy and Fermi velocity anisotropy as discussed later.
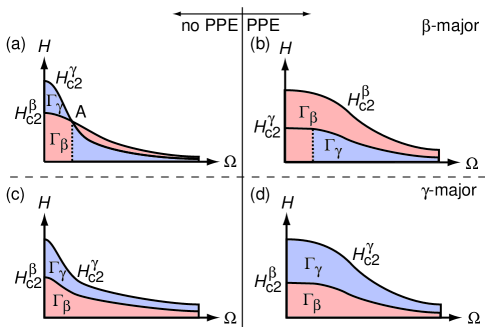
Here we study the interplay between PPE and multiband effects in a uniaxial anisotropic superconductor in which each band has a different uniaxial anisotropy: For the case of two bands which we consider in this paper we can envisage two possible situations as schematically illustrated in Fig. 1. Let us consider the first case shown in Figs. 1 (a) and (b). In the absence of PPE the two orbital limited upper critical fields and cross at A in versus plane ( is the angle from the plane), each of which is characterized by the effective mass anisotropy for two bands and , assuming . As indicated in Fig. 1 (a) the four divided regions are characterized by each . In particular, along the characteristic anisotropy of the total system is switched at the intersecting point A from to as increases. When traversing at a higher , the anisotropy for the band is sensed only.
Now let us switch on PPE, then both orbital limited are suppressed towards lower fields, especially if we assume that the superconducting gaps for the two bands such that . This is because the Pauli limited fields . The resulting phase diagram is shown in Fig. 1 (b). As seen from it the crossing point A is removed and three regions are now occupied by while the region is hidden deep inside at lower fields and finite ’s. In particular, along the region persists all the way from to . Thus the higher field scan is sensing only the anisotropy while a lower field scan is sensing as increases. This non-trivial anisotropy evolution is caused by the interplay between the effective mass anisotropy and PPE.
Another possible phase diagrams are depicted in Figs. 1(c) and (d) where is assumed, keeping . The () band with () is now major (minor). In the absence of PPE shown in Fig. 1(c) the two orbital limited curves are not crossed, thus the higher (lower) field region is occupied by (). In the presence of PPE those curves are both suppressed downwards. Thus the two regions ( and ) are simply shifted downwards, keeping its phase diagram topologically unchanged. Note that . Therefore, a higher (lower) field scan is exclusively sensing the () anisotropy of the total system as increases.
The purpose of this paper is to investigate the physics of Sr2RuO4 through the studies of the mixed state properties in this multiband superconductor where the interplay between the effective mass (or Fermi velocity) anisotropy and PPE is important in understanding of the vortex lattice state in vs plane. This superconductor is known to have the strong two dimensional uniaxial anisotropies for the three bands MackenzieMaeno , the band (180) the band (120) and the band (60). Since the density of states (DOS) at the Fermi level (=0.53, =0.10 and =0.37 of the total DOS), the band is neglected in this paper for simplicity. In the following we consider a two band model: the band with =0.53 and the band with =0.47.
In Sr2RuO4 there are several outstanding unsolved issues:
(1) Which bands is the major band for superconductivity, either the band or the band ? or ?
(2) Can the PPE resolve the observed disparity between the vortex lattice anisotropy Rastovski 60 and the anisotropy MackenzieMaeno 20 ?
The first issue (1) has been extensively debated, in particular in connection with the pairing mechanism of this material to stabilize the chiral p-wave state zhito ; nomura ; kivelson ; simon . We approach this issue from the different view point by analyzing the mixed state vortex states. The second issue (2) has been investigated by us Machida ; amano2 based on the single band picture. In this paper we revisit it based on a more realistic two band model, which is able to allow us to study the issue (1).
We base our computations on the quasiclassical theory eilenberger ; larkin1 ; usadel . The original single band theory is extended to various multiband cases, including MgB2 koshelev ; nakai2band , iron pnictides vorontsov ; schmalian ; efetov . The applicability of the quasiclassical theory eilenberger ; larkin1 ; usadel is given in general by the condition with the Fermi wave number and the coherence length under the assumption that the normal state properties are described by a Fermi liquid theory. For Sr2RuO4 the three bands , and are =0.304, 0.622 and 0.753 (), respectively. The in-plane and axis coherence lengths are 660 and 33 (), respectively MackenzieMaeno . Thus for any combinations is well satisfied. We also notice that the lattice constants =3.862 and =12.722 are short enough compared with those coherence lengths, thus Sr2RuO4 is a three dimensional normal metal. Moreover, most physical quantities, including various transport coefficients and thermodynamic properties can be consistently and coherently described by a Fermi liquid theory as explained in details by Mackenzie and Maeno MackenzieMaeno . Therefore we can quite safely apply the quasiclassical theory to Sr2RuO4.
By self-consistently solving microscopic quasiclassical Eilenberger equation with two bands, we calculate a variety of the physical quantities relevant to available experiments, such as the form factors probed by SANS experiments Rastovski ; morten , magnetic torques kittaka , and the vortex lattice anisotropy which differs generally from the effective mass anisotropy mentioned above.
The arrangement of this paper is as follows: After introducing Eilenberger theory extended to multibands nakai2band with PPE in Sec. 2 which was done in our previous paper tsutsumi , we construct a model system for considering Sr2RuO4 by fixing the several model parameters in Sec. 3. Here we compare the two scenarios, one is the major and the other in equal footing, finding that the former is better than the latter relative to the existing experiments. Then we come to the main theme of the present paper in Sec.4; computations and analyses of the form factors and vortex lattice anisotropies as a function of the angle compared with the data of SANS experiments Rastovski ; kuhn . In Sec. 5 we examine the magnetic torques which are also measured recently by Kittaka et alkittaka . The final section 6 is devoted to discussions and conclusion. This paper is an extension of our previous work based on a single band modelamano2 ; amano1 ; ishihara and also closely related to our two band model calculationstsutsumi ; nakai2band .
II Quasiclassical theory including PPE for two bands
We start with the free energy in the quasiclassical theory eilenberger ; larkin1 ; usadel extended to the two band case koshelev ; nakai2band ; vorontsov ; schmalian ; efetov , which is given by
| (1) |
with , and
| (2) |
The flux quantum . is the Fermi velocity at of the band j. The Fermi surface average is normalized within each band as . Here we introduced the interaction matrix with 22 for two bands where is the pairing interaction on the band and for is the Cooper pair transfer between the and bands. , , and are the quasiclassical Green’s functions for the band. is the pair potential and describes the gap symmetry of the band in reciprocal space, which allows us to choose the gap form depending upon each band as will be done in the following. The vector potential and the internal field are related to with uniform field.
By following the same procedure by Eilenberger eilenberger , the functional derivatives with respect to , and yield the so-called Eilenberger equation extended to the two band case:
| (3) |
This form is understandable because the fourth term in the free energy Eq. (1), which includes the Green’s functions, is separable in the band index, thus the resultant equation of the functional derivative should be separable for each band. The stationary conditions of Eq. (1) with respect to the functionals and the vector potential give rise to a complete set of the self-consistent equations extended to the two band case, which are given below; Eqs. (4) and (5). This complete set of the self-consistent equations coincides and is consistent with those obtained previously koshelev ; nakai2band .
The electronic state is calculated by solving the Eilenberger equation Eq. (3) in the clean limit ichioka , including the Pauli paramagnetic effect (PPE) due to the Zeeman term IchiokaPara , where is a renormalized Bohr magneton related to the so-called Maki parameter . The quasiclassical Green’s functions , , and with the band index depend on the direction of the Fermi momentum for each band, the center-of-mass coordinate for the Cooper pair, and Matsubara frequency with . They are calculated in a unit cell of the triangle vortex lattice.
The unit of Fermi velocity is defined by , where the density of states (DOS) in the normal state at each Fermi surface is defined by . Throughout this paper, temperatures, energies, lengths, and magnetic fields are, respectively, measured in units of the transition temperature , , , and . We calculate the spatial structure of in a fully self-consistent way.
The pairing potential is calculated by the gap equation
| (4) |
which is coupled via the interaction matrix . We use the energy cutoff . The vector potential is also self-consistently determined by
| (5) |
which includes the contribution of the paramagnetic moment with
| (6) |
Here is the averaged flux density mentioned above, the normal state paramagnetic moment , and . The Ginzburg-Landau (GL) parameter is the ratio of the penetration depth to coherence length for . Using Doria-Gubernatis-Rainer scaling Doria , we obtain the relation ichioka of and the external field . The total magnetization including both the diamagnetic and the paramagnetic contributions is derived.
We solve Eq. (3) with for the electronic state. The local density of states (LDOS) is given by where
| (7) |
with for up (down) spin component. We typically use the smearing factor . The DOS is obtained by the spatial average of the LDOS as .
We consider a simplified model of a two-band system with a larger superconducting gap band (band-1) and a smaller gap band (band-2). As a model of the Fermi surfaces, we use two quasi-two dimensional Fermi surfaces with rippled cylinder shapes. The Fermi velocity is assumed to be at on the Fermi surfaces Hiragi . We consider a case , to produce large anisotropy ratio of the coherence lengths,
| (8) |
with where indicates an average over the Fermi surface on each band. The magnetic field orientation is tilted by from the axis towards the plane. Since we set axis to the vortex line direction, the coordinate for the vortex structure is related to the crystal coordinate as .
We set unit vectors of the vortex lattice as
| (9) |
with and the vortex lattice anisotropy is defined by . The anisotropic ratio , which comes from the Fermi velocity anisotropy,
| (10) |
with and 2.
To discuss -dependence of the internal field distribution , we consider flux line lattice (FLL) form factor , which is obtained by Fourier transformation of the internal field distribution as with the wave vector . and are integers. The unit vectors in reciprocal space are given by and . The -component from gives the intensity of conventional non-spinflip SANS. The transverse component, , is accessible by spin-flip SANS experiments.Kealey ; Rastovski
III Model construction and physics for
III.1 Specific heat and anisotropy ratio
In order to determine the model parameters appropriate for Sr2RuO4, we start out to fix the gap magnitudes and and their nodal structures. We first analyze the electronic specific heat data at zero field deguchi by solving self-consistently the Eilenberger equation Eq. (3) for the uniform system without using the phenomenological so-called model alpha . Here we have assumed that the minor component induced only by the Cooper pair transfer coupling . The direct attractive coupling among the minor component is vanishing; .
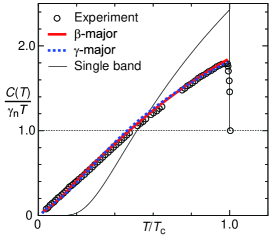
As seen from Fig.2 the data is equally well explained either by
(A) the scenario with at where both bands have line nodes as coincided with other authorsnomura ,
(B) the scenario with where the band has a full gap and the band line nodes.
It is apparent that the linear behavior of at lower indicates that the nodal gap is necessary somewhere; for the scenario in both bands and for the the scenario only in the band. This nodal structure difference between them is decisive for the two scenarios as will be seen shortly.
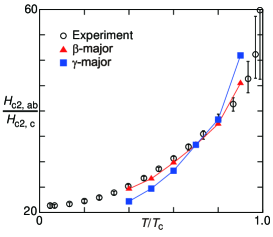
According to Kittaka et al kittaka-ratio , the upper critical field ratio for the two directions ( and ) is -dependent, implying that PPE becomes stronger as the field applied to the plane increases. Here we calculate for both scenarios and depict the results in Fig. 3. Since near the intrinsic effective mass anisotropy governs its tending limit (), namely, 180 (60) for the () scenario. The experimental data kittaka-ratio shown support the scenario within the experimental accuracy where there is no indication of the ratio with tending to 180. This is one of the most clear signatures for the major scenario. By adjusting the parameters for both scenarios the best fittings are accomplished in =0.04 (0.02) for the () scenario. From now on we use those values in the following calculations.
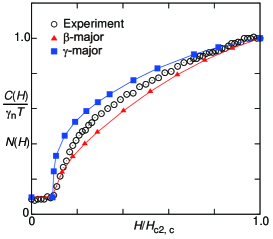
In order to further distinguish between the two scenarios, we take up the experimental data deguchi of the field dependence of for at the available lowest temperature =60 mK, which best mimics the zero-energy density of states at in the theoretical calculation. In Fig. 4 we compare the experimental data with the theoretical values as a function of the field applied parallel to the axis. As seen from it, the scenario overestimates the data while the scenario underestimates it. If taking into the finite effect in the experimental data, the theoretical curves should move up when considering thermal excitations, resulting in further departure of the -major curve while the -major curve comes closer to the data. We also note from Fig. 4 that too much low energy excitations are released at lower fields in the scenario because the nodal gap exists in the minor band, causing the overestimate. This fact, which has been unnoticed so far is quite fatal for the scenario.
Thus it is clear from those two criteria that the scenario is far better than the scenario. The best fitting also yields the value for , that is, =2.7 whose value is used in the following computations. But we should keep in mind that this low value delicately depends on the particular sample used. This quantity is known to be sample dependent.
III.2 Form factors for
The form factors of the longitudinal components and which are measured by SANS experiments forgan for are compared with the two scenarios whose magnitudes are multiplied by a factor of 1.7 for the scenario and 3.5 for the scenario. This is partly because the actual =2.7 determined by fitting previously might be different from the SANS experiment (In fact =58mT and =2.0 differ from =75mT and =2.3 in the best samples MackenzieMaeno ). Since the form factor magnitudes are sensitive to the value (), it is permissible to adjust it to fit with data. As seen from Fig. 5 the field dependences of and are far better explained by the scenario than by the scenario.
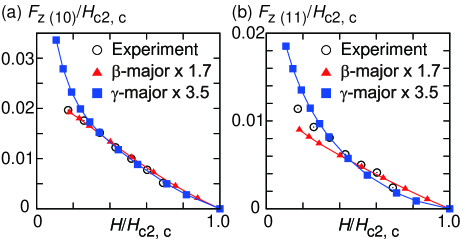
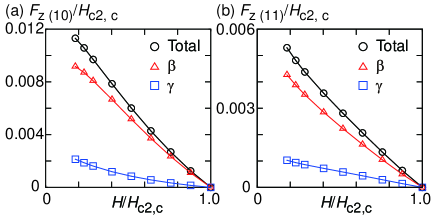
In Fig. 6 we decompose the longitudinal form factors and into the two contributions of the band and band in the case of the scenario. It is seen that the minor contribution amounts to of the total at this temperature for both and . Thus in order to understand the field dependence of the form factors, the multiband effect is essential, which further becomes clear later. Note in passing as mentioned in Introduction on MgB2 Cubitt et al mortenmgb2 discover the additional contribution of the minor band to the main band contribution at lower . This general trend here supports their discovery (see Fig. 2 in Ref. mortenmgb2, ). Note that the relative weight of the main contribution and minor contribution depends on temperature, field and field orientation . Generally as and decrease, the minor contribution increases because the two order parameters are more competitive there.
III.3 Phase diagrams in vs
Since we have determined the gap ratios for each scenario, it is possible to establish the phase diagrams on vs plane. For the two orbital limited ratio () with the obvious notations is written as
| (11) |
It is knownMackenzieMaeno that the Fermi velocity ratio . Thus for the scenario while for the scenario, those corresponding to Fig. 1(a) and Fig. 1(c) at respectively. On the other hand, at
| (12) |
This yields for the scenario while for the scenario, thus giving rise to the situations depicted in Fig. 1(a) and Fig. 1(c) at respectively. Note that the crossing point A of the two orbital limited ’s in Fig. 1(a) is located at around .
IV Form factors and vortex lattice anisotropy
IV.1 Form factors
The form factors FF are a sensitive and useful probe measured by SANS in order to detect the field distribution in the vortex state. The SANS experiments Rastovski ; morten on Sr2RuO4 are performed. They find the transverse components of FF as a function of near the plane. Here we obtain FF by evaluating the field distribution via a self-consistent solution of Eq. (3).
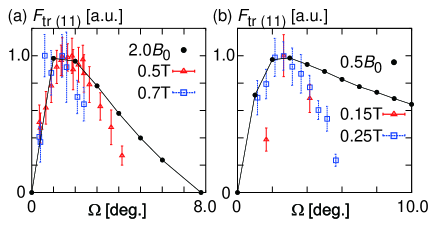
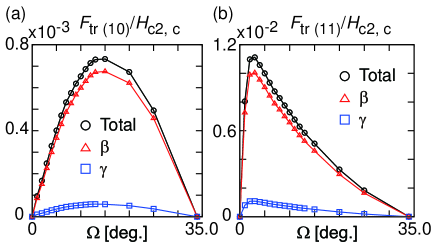
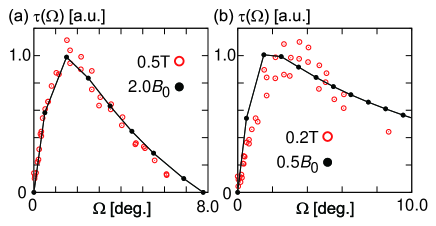
It is seen from Figs. 7 (a) and (b) that the angle dependences of the transverse component of FF for two fields (high field) and (low field) exhibit a different characteristic; The high field data show a simple monotonic decrease after taking a maximum towards at which the superconducting-normal state transition takes place. The monotonic transverse FF curve is similar to that of the single band case shown in previous papersamano1 ; amano2 . This high field scan () corresponds to the horizontal scanning path in Fig.1(b) where only the region is sensed. The maximum position coincides with those of the single band result amano2 with . The overall features of the experimental data for T and 0.7T are well reproduced as seen from Fig. 7 (a) except for a few data points at higher angles.
On the other hand, for the low field result () shown in Fig.7 (b), it is seen that the theoretical FF curve coincides with the maximum angle of the experimental data at T and 0.25T. However, it deviates from those data after that. The experimental data tend to vanish at round , which is by far from the known at (0.25)T, which should be ultimate vanishing angle for FF amplitude. We will discuss this discrepancy shortly. Here we just point out that those low field data correspond to the low field scanning paths in Fig.1(b) where the crossover of the regions is sensing with increasing .
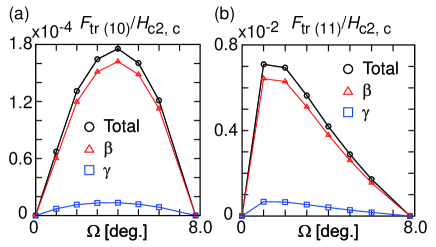
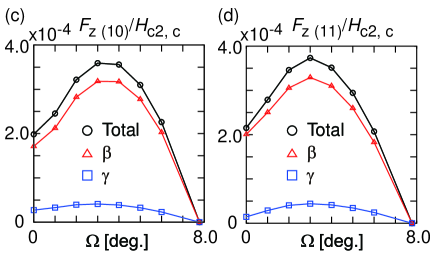
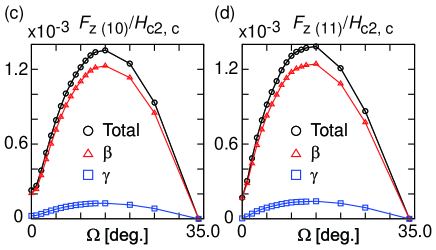
We decompose the FF contributions from the major band and the minor band for the transverse components (a) and (b) and the longitudinal components (c) and (d) as shown in Fig. 8 for the high field and Fig. 9 for the low field. The relative weight of the minor component in this transverse FF is around of the total FF and their peak contribution coincides with the maximum position for both (high field) and (low field) data. As for the longitudinal components of and , it is reasonable to see that the maximum angle is shifted to a higher angle than . This is because when is approached in which the “effective” field virtually increases because the decreasing means decreasing and hence enhances PPE, thus pushing up the longitudinal FF .
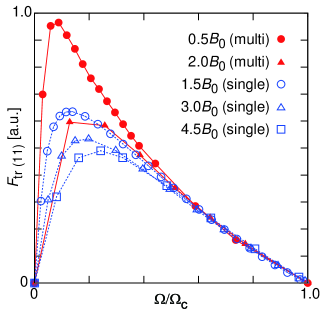
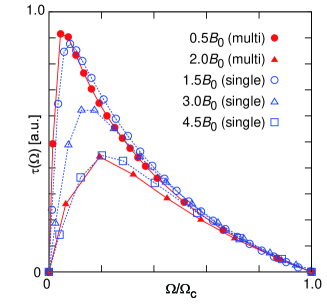
In order to clearly see the different angle dependences for the two cases and to understand the discrepancy of the low field data mentioned above shown in Fig. 7 (b), we replot those theoretical results normalized by the own in Fig. 10 and compare those with the corresponding single band results amano2 where we have adjusted the vertical scale so that the slopes of these curves near coincide with each other. It is now seen clearly that
(1) The high field result belongs to the single band universality curve. This is because the high field scanning path is sensing only the region in Fig. 1 (b). This is virtually same as in the single band case. Namely after taking the maximum the FF curve simply goes to vanish at .
(2) The low field result behaves differently from those single band universality curves and exhibits a “bimodal” dependence where the FF peak is additionally enhanced. Thus the curve just after taking the maximum tends to vanish earlier than at which is the ultimate vanishing angle.
Let us come back to understand the low field FF data shown in Fig. 7 (b). The bimodal structure at the low field shown in Fig. 9 (b) where the slope just after the maximum differs from the slope at higher angles as increases. This crossover angle . This low field scan corresponds to the low field scanning path in Fig. 1(b) where the crossover of the regions is sensing with increasing . In particular, the central peak region () in the bimodal structure corresponds to the middle region in this crossover. This theoretical curve is compared with the SANS data morten at T in Fig.7 (b). Although the present experimental data do not exhibit this bimodal FF structure, the existing data are understood as coming only from the middle region among the bimodal structure because the extrapolated vanishing angle . This critical angle is too small compared with which must be the ultimate vanishing angle of the FF intensity. Thus we interpret this so that the existing FF data are coming for the peak region of the bimodal FF distribution. This interpretation is strengthened later when analyzing the vortex lattice anisotropy .
IV.2 Vortex lattice anisotropy
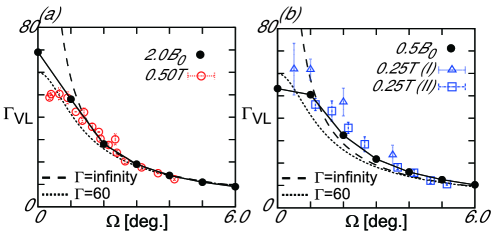
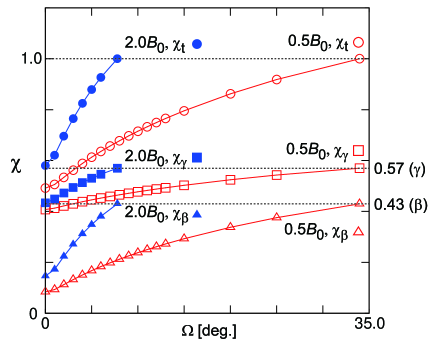
Figure 11 shows the results of the vortex lattice anisotropy compared with the SANS experiments morten where for a given and the self-consistent solutions of Eq. (3) are optimized for varying as shown in Fig. 12 to seek the free energy minimum where the free energy form is given by Eq. (1). In general the optimized is that given neither by the effective mass anisotropies with =60 nor with =180 alone given by Eq. (10). This is obvious because those two anisotropies are coupled and competed by the multiband effect.
The higher field results in Fig. 11 (a) follow rather well those given by the above formula of Eq. (10) for for the higher angles . We note that at where =70 corresponds precisely to the anisotropy for . Between the angles the theoretical results deviate upwards, that is, . The high field scan in Fig.1(b) is barely touching the region whose anisotropy can be certainly larger than =60 because =180.
The low field theoretical results shown in Fig. 11 (b) follow the curve for and remarkably exceed the curve in . This window in corresponding to the region appears because there the =180 anisotropy further modifies the value upwards, simultaneously enhancing the transverse FF. We point out a theoretical fact that as increases, becomes larger. We anticipate that the results at lower temperatures than the present one at would improve the quantitative fittings of and simultaneously . Note that =52 corresponds to the single band anisotropy for the band at lower fields amano2 . The T data nicely fit our theoretical result. The important point here is that not only the experimental data exceed the line, but also there exists a wider window where the experimental data deviate from the single band curve.
IV.3 Order parameters, free energy and magnetization
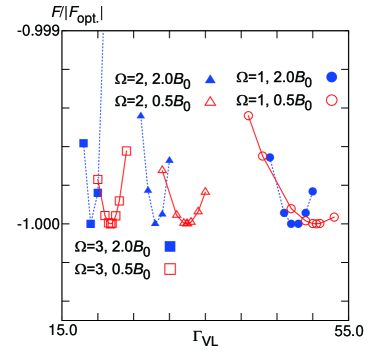
We illustrate the dependences of several physical quantities of interest which are the basis of the form factors and magnetic torque calculations as shown shortly. The free energy is shown in Fig. 13, from which we will evaluate the magnetic torques. Since the transition at is of second order at those fields and temperature (T=0.5Tc), becomes zero smoothly at the transition point .
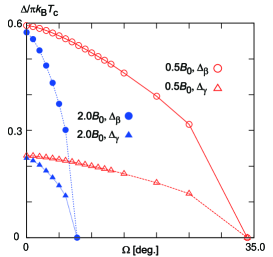
As seen from Fig. 14, the two order parameters; the major and minor start decreasing from towards as a function of . The two curves change smoothly in parallel because the minor component is induced by the major one through the Cooper pair transfer in the absence of . In this case we expect no hidden first order transition phenomenatsutsumi where there is an abrupt change of the two order parameters inside the superconducting state.
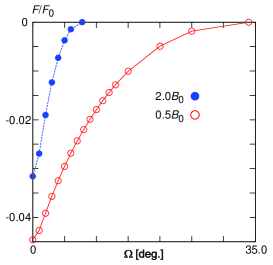
In Fig. 15 the total paramagnetic susceptibility and decomposed and are displayed as a function of . Since we assume the density of states and of the total DOS, the corresponding paramagnetic values as expected. We also point out that the base paramagnetic moment values at is large because the calculations are done at rather high temperature . Needless to say, at T should vanish at . As increases becomes larger because the system is approaching the transition point at where the normal value must be recovered, that is, .
V Magnetic torques
Magnetic torque defined by provides several important information on a uniaxial anisotropic superconductor. We can know the intrinsic anisotropy of a system by the peak position of the torque curve . This can be easily performed by using a phenomenological theory based on London theorykogan for single band superconductors. In our previous papersamano1 ; amano2 we examine the applicability of this approach and propose a modification to this. Extending this single band Eilenberger calculations, here we show the results of the torque curves for the present two band model and use those to analyze the data on Sr2RuO4 where the torque curves are measured recentlykittaka .
We first display our results for the torque curves in Fig. 16 where our results for and are compared with the experimental data for =0.5T (former) and =0.2T (latter). It is seen from Fig. 16 (a) at the high field that the fitting is done well, such as the peak position and the value. Since the high field result is sensing only on the region, it is reasonable that the theoretical curve nicely explains the experimental data at =0.5T and the peak position coincides with the single band result amano2 . This peak position also coincides with of the form factor (). Thus the four values and both for theory and experiment are coinciding with each other, leading us to firmly conclude that in high fields the system is virtually in the single band-like region.
On the other hand, the low field result () shown in Fig. 16 (b) explains the experimental torque curves for =0.2T, but the peak position differs slightly from each others. We also notice here that the theoretical and () agrees with the experimental data as shown before.
It is interesting to compare our torque curves with those for the single band case which are displayed in Fig. 17. It is seen that the two torque curves nicely correspond to the single band curves, which is in contrast with the FF case shown in Fig. 10 where the low field curve markedly deviates from the single band case. This means that the magnetic torque is a rather insensitive probe to see the subtle, but important multiband effect. In other words, the form factor measurement is sensitive enough to distinguish the multiband effect from the single band effect. This is because the torques comes from the total free energy while the FF is probing the particular Fourier component of the spatially modulated magnetic field in the mixed state selectively. Thus it is natural to expect that the FF measurement is more sensitive than the torque measurement in picking up the multiband effect.
VI Discussions
VI.1 single band vs multiband
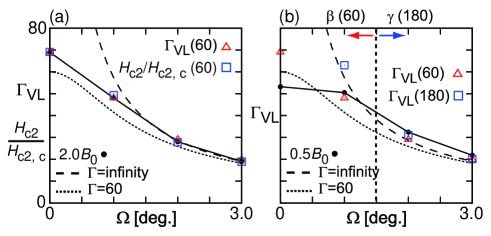
In order to describe the transverse components of FF and data morten near the plane which are the main themes of the paper, we have done the calculations based on both scenarios, first focusing on the physics to fix the model parameters. Here we critically examine those scenarios comparatively. It is obvious that the multiband scenario superior than the single band scenario amano2 because the former includes the latter as a limiting case. A question is how effectively the single band scenario can describe those data or how the multiband description is inevitable for the Sr2RuO4 physics. As already demonstrated and also shown in Fig. 18, the overall features of those data can be reproduced by the single band model with =60 in the higher fields above T in the vs plane where there is a little trace for the existence of the band with =180 (see Fig. 18(a)). In this sense the single band picture is enough for this region. In contrast, however, it is necessary to retain the band contribution in addition to the major band contribution in the low field region below 0.5T (see Fig. 18(b)). The former contribution is hidden and not explicit where the crossover occurs around as indicated in Fig. 18(b). It is necessary and indispensable to take it into account for explaining the FF and data morten . This is a part of the reasons why our single band theory amano2 is successful to understand the mixed state properties of the present strongly uniaxial anisotropic superconductor. Moreover, depending upon the physical quantities of interest, the multiband effect is not so apparent even in the low field region. Namely, the torque curves are quite insensitive to the presence of the minor band and all the theoretical torque curves collapse into a universal curve by appropriate scaling as discussed before (see Fig. 17).
VI.2 main scenario vs main scenario
The question on which band the gap is large is much discussed in connection with the pairing mechanism to stabilize the chiral p-wave state by many authors zhito ; nomura ; kivelson ; simon . Here we take a different view to consider this question through the analysis of the FF, and torques. If the band is major, this survives in the high field region of the vs plane over the minor band. Then the SANS experiment should detect it, manifesting itself in , that is, as . However, both high fields and low filed data shown in Fig. 11 indicate or so, which is direct evidence that the band with is major. This conclusion is also supported by the ratio when kittaka-ratio because near this ratio directly reflects the intrinsic Fermi velocity anisotropy miranovic , or the coherent length anisotropy. Thus those experimental data obviously reveal that the band is major with certainty.
VI.3 Cooper pair tunneling vs direct attraction : Hidden first order
In general the two band contains the three pairing parameters () is the attractive interaction for the major (minor) band, and is the Cooper pair tunneling term or proximity induced term. Here we set =0 in this paper because there is no or little indication for , which causes the so-called hidden first order phenomena tsutsumi . Namely at inside certain physical quantities exhibit a sudden change as a function of , such as the Sommerfeld coefficient or the magnetization curve as observed in CeCu2Si2 kittakace , UBe13 shimizu and KFe2As2 kittaka122 . This means that in Sr2RuO4 and the minor band pairing is exclusively induced by the major band through .
VI.4 Expected low behaviors
Because of several technical reasons our main computations have been done at relatively high , namely , which are nevertheless successful in capturing the characteristic features in the FF, and torques in a qualitative level. To understand those data in a quantitative level it is necessary to go into lower which is demanding computationally. Here we anticipate possible outcomes if performing it. As shown in Fig. 7 we have mentioned that the low filed FF (=0.5) differs from that in =2.0, which belongs to the single band universality class. The FF in low angle is enormously enhanced by the assistance from the minor band which amounts almost 10 even at . In low calculation this enhancement of the FF should increase and the FF angle dependence becomes more similar to the data shown in Fig. 7 (b). This expectation is reasonable because at lower the induced paramagnetic moments are confined in the vortex core, making more contrast in the spatial field distribution and thus enhancing the FF amplitude. See also Fig. 15 where the paramagnetic susceptibility or paramagnetic moments of the minor band are almost exhausted at =0 to its normal value, meaning that is not confined in the core. Thus, the paramagnetic moments are spreading out the whole space uniformly.
VI.5 Other multiband superconductors with PPE
We can deepen our understandings of the present material by comparing similar multiband superconductors, CeCu2Si2 kittakace , UBe13 shimizu and KFe2As2 kittaka122 . The first two are heavy fermion materials known to have multiband with all full gaps belonging to the spin singlet category where is strongly suppressed and the hidden first order like anomalies at exist. Thus as mentioned is indispensable for those systems. According to the recent SANS experiment kuhn the typical multiband Fe pnictide KFe2As2 is similar to Sr2RuO4 in the point that the vortex anisotropy observed differs from the anisotropy. This can be also explained by PPE. Thus the present theoretical framework, which is quite general might be able to explain those systems.
VI.6 Gap structure: vertical line node vs horizontal line node
We have assigned the nodal structure that the dominant band is a full gap while the minor is vertical line nodes. In order to reproduce the square vortex lattice oriented to the (110) direction observed for which dominates the whole space measured in the vs phase forgan . The gap (or near) nodes should be in this direction in reciprocal space nakai , implying a like nodal structure, contrary to the claim by Deguchi et al deguchi who measure the specific heat by rotating the field direction and see the four-fold oscillation patterns whose minima are located for the (100) direction. They conclude that the band has a like nodal structure. However, this assignment is difficult to explain the square vortex lattice orientated along the (110) direction for . Even if we take into account the in-plane Fermi velocity anisotropy in the and bands whose minima are oriented along the (100) direction singh , thus preferring the square lattice oriented along the (100) direction as discussed previously agterberg . Thus the best way to avoid this difficulty is to simply consider that the band nodal structure is like. The specific heat oscillation experiment done above 120mK is still too high to see the sign changing of the oscillation pattern because the band is minor where the expected sign changing temperature theoretically Hiragi and experimentally an usually located at 0.1mK must be lowered.
This kind of the band-dependent nodal structure differs from the idea based on the symmetry protected nodal structure where the all plural bands are governed by the same gap symmetry. From this point of view, it is possible that the nodal structure may not be truly sign-changing symmetry, rather an extended s-wave type with the anisotropic gap whose minima are along the (110) direction.
Some authors hasegawa assert that the horizontal line nodes compatible to a chiral triplet state . From the present point of view, the Sommerfeld coefficient behavior for may not be consistent with this which gives a too larger at low field region than the experimental data deguchi shown in Fig. 4. In this connection we should mention that no one succeeded in explaining the behavior deguchi for . In particular, it is viewed that the initial rise of is often assigned to the DOS because the plateau of for this mid field region T seems to correspond to DOS (43 of the total), which was taken as supporting evidence of the major scenario. Since we cannot accept this view anymore, a full understudying of the behavior for remains mystery.
VI.7 Perspectives—-Future experiments; Knight shift and FFLO
There remain certainly important experiments to put forth the research front of this interesting material: NMR experiments have been extensively done MackenzieMaeno , showing the absence of any change of the Knight shift knight below . This is interpreted as freely rotatable d-vector in a spin triplet pairing, keeping always it perpendicular to an external field which is as small as mT, a big mystery because according to the recent ARPES ARPES the spin-orbit coupling which locks the d-vector to the crystalline lattice is an order of 200mV. Since the recent magnetization experiment kittaka is directly able to detect the spin susceptibility change at the first order transition which amounts to drop compared with the normal value. This is in sharp contrast with the Knight shift experiment by NMR which calls for reexamination of NMR experiments.
Here we propose the measurement to detect the FFLO state fulde ; larkin expected to exist along below 0.8K where the first order transition is observed. Recently anomalous enhancement is observed vesna when entering the FFLO state due to the appearance of the zero energy state at the domain walls where the FFLO order parameter is -shifted. There is a good chance to observe it if the second phase below really exists, which we believe so. A necessary condition is that is short enough so that the spin-lattice relaxation process is dominated through those zero energy states as in -(BEDT-TTF)2Cu(NCS)2 case vesna . In this connection we mention a recent SR experiment muSR that probes the peculiar vortex morphology at low fields of and related theory based on hidden criticality associated with multi-bandness milo .
VII Summary and conclusion
Based on the microscopic Eilenberger theory extended to a multiband case, we have studied the mixed state properties of a uniaxial anisotropic type II superconductor, focusing on the interplay between the Pauli paramagnetic effect and multiband effect. A two band model calculation is set up and applied to Sr2RuO4. We have succeeded in reproducing the data both of the form factors of SANS experiments Rastovski ; morten and magnetic torque experiment kittaka . That leads us to the conclusion that to understand the physics in Sr2RuO4 it is indispensable to consider both the Pauli paramagnetic effect and multiband effect simultaneously, which conspire to give rise to a variety of mysteries associated with the pairing symmetry determination in this material.
As agreed with the previous identification based on the single band analysis amano2 , the pairing symmetry in Sr2RuO4 is either singlet which is most likely or triplet with the d-vector locked in the plane which is less likely. The () band is major (minor) with the mass anisotropy 60 (180). Namely, the () band has a lager (smaller) gap. The gap structure is a full gap in the band while in the band it is like. This simple picture was difficult to reach because of the extreme two-dimensionality of this material which prevents conventional experimental access. Now the dedicated and refined experimental tools Rastovski ; kittaka ; yonezawa1 ; yonezawa2 which are able to align the magnetic field direction accurately within 1∘ enable us to uncover the physics of Sr2RuO4.
Acknowledgements.
The authors thank M. R. Eskildsen, S. Kuhn, and C. Rastovski for providing us unpublished SANS data and also M. Ichioka, M. Ishihara, and Y. Amano for discussing on the theoretical side, and S. Kittaka, A. Kasahara, T. Sakakibara, K. Ishida, Y. Maeno, S. Yonezawa and M. Takigawa for discussing on the experiment side. K. M. is supported by Grant-in-Aid for Scientific Research No. 26400360 and No. 25103716 from the Japan Society for the Promotion of Science.References
- (1) M. V. Miločević and A. Perali, Supercond. Sci. Technol., 28, 060201 (2015).
- (2) J. Nagamatsu, N. Nakagawa, T. Muranaka, Y. Zenitani, and J. Akimitsu, Nature, 410, 63 (2001).
- (3) J. Kortus, I. I. Mazin, K. D. Belashchenko, V. P. Antropov, and L. L. Boyer, Phys. Rev. Lett. 86, 4656 (2001).
- (4) T. Hirano, K. Takamori, M. Ichioka, and K. Machida, J. Phys. Soc. Jpn. 82, 063708 (2013).
- (5) R. Cubitt, M. R. Eskildsen, C. D. Dewhurst, J. Jun, S. M. Kazakov, and J. Karpinski, Phys. Rev. Lett. 91, 047002 (2003).
- (6) S. Kittaka, Y. Aoki, Y. Shimura, T. Sakakibara, S. Seiro, C. Geibel, F. Steglich, H. Ikeda, and K. Machida, Phys. Rev. Lett. 112, 067002 (2014).
- (7) Y. Shimizu, S. Kittaka, T. Sakakibara, Y. Haga, E. Yamamoto, H. Amitsuka, Y. Tsutsumi, and K. Machida, Phys. Rev. Lett. 114, 147002 (2015).
- (8) S. Kittaka, Y. Aoki, N. Kase, T. Sakakibara, T. Saito, H. Fukazawa, Y. Kohori, K. Kihou, Chul-Ho Lee, A. Iyo, H. Eisaki, K. Deguchi, N. K. Sato, Y. Tsutsumi, and K. Machida, J. Phys. Soc. Jpn. 83, 013704 (2014).
- (9) S. Kuhn and M. R. Eskildsen, private communication.
- (10) Y. Tsutsumi, K. Machida, and M. Ichioka, Phys. Rev. B 92, 020502 (R) (2015).
- (11) A. P. Mackenzie and Y. Maeno, Rev. Mod. Phys. 75, 657 (2003).
- (12) C. Rastovski, C. D. Dewhurst, W. J. Gannon, D. C. Peets, H. Takatsu, Y. Maeno, M. Ichioka, K. Machida, and M. R. Eskildsen, Phys. Rev. Lett. 111, 087003 (2013).
- (13) M. E. Zhitomirsky and T. M. Rice, Phys. Rev. Lett. 87, 057001 (2001).
- (14) T. Nomura and K. Yamada, J. Phys. Soc. Jpn., 69, 3678 (2000). T. Nomura and K. Yamada, J. Phys. Soc. Jpn., 71, 404 (2002). T. Nomura and K. Yamada, J. Phys. Soc. Jpn., 71, 1993 (2002).
- (15) S. Raghu, A. Kapitulnik, and S. A. Kivelson, Phys. Rev. Lett. 105, 136401 (2010).
- (16) T. Scaffidi, J. C. Romers and S. Simon, Phys. Rev. B 89, 220510 (R) (2014).
- (17) K. Machida and M. Ichioka, Phys. Rev. B 77, 184515 (2008).
- (18) Y. Amano, M. Ishihara, N. Nakai, K. Machida, and M. Ichioka, Phys. Rev. B 91, 144513 (2015).
- (19) G. Eilenberger, Z. Phys. 214, 195 (1968).
- (20) A. I. Larkin and Yu. N. Ovchinnikov in Nonequilibrium superconduscivity, edited by D. N. Langenberg and A. I. Larkin (Elsevier, Amsterdam 1984).
- (21) K. Usadel, Phys. Rev. Lett. 25, 507 (1970).
- (22) A. E. Koshelev and A. A. Golubov, Phys. Rev. Lett. 90, 177002 (2003).
- (23) M. Ichioka, K. Machida, N. Nakai, and P. Miranović, Phys. Rev. B 70, 144508 (2004).
- (24) A. B. Vorontsiv, M. G. Vavilov, and A. V. Chubukov, Phys. Rev. B 81, 174538 (2010).
- (25) R. M. Fernandes and J. Schmalian, Phys. Rev. B 82, 014521 (2010).
- (26) A. Moor, A. F. Volkov, and K. B. Efetov, Phys. Rev. B 83, 134524 (2011).
- (27) M. R. Eskidsen, private communication.
- (28) S. Kittaka, A. Kasahara, T. Sakakibara, D. Shibata, S. Yonezawa, Y. Maeno, K. Tenya, and K. Machida, Phys. Rev. B 89, 220402 (R) (2014).
- (29) M. Ishihara, Y. Amano, M. Ichioka, and K. Machida, Phys. Rev. B 87, 224509 (2013).
- (30) Y. Amano, M. Ishihara, M. Ichioka, N. Nakai, and K. Machida, Phys. Rev. B 90, 144514 (2014).
- (31) M. Ichioka, A. Hasegawa, and K. Machida, Phys. Rev. B 59, 8902 (1999). M. Ichioka, A. Hasegawa, and K. Machida, Phys. Rev. B 59, 184 (1999).
- (32) M. Ichioka and K. Machida, Phys. Rev. B 76, 064502 (2007); M. Ichioka, K. M. Suzuki, Y. Tsutsumi, and K. Machida, in Superconductivity - Theory and Applications, edited by A. M. Luiz (InTech, Croatia, 2011), Chap.10.
- (33) M. M. Doria, J. E. Gubernatis, and D. Rainer, Phys. Rev. B 41, 6335 (1990).
- (34) M. Hiragi, K.M. Suzuki, M. Ichioka, and K. Machida, J. Phys. Soc. Jpn. 79, 094709 (2010).
- (35) P. G. Kealey, D. Charalambous, E. M. Forgan, S. L. Lee, S. T. Johnson, P. Schleger, R. Cubitt, D. McK. Paul, C. M. Aegerter, S. Tajima, and A. Rykov, Phys. Rev. B 64, 174501 (2001).
- (36) K. Deguchi, Z. Q. Mao, and Y. Maeno, J. Phys. Soc. Jpn., 73, 1313 (2004).
- (37) H. Padamsee, J. E. Neighbor, and C. A. Shiffman, J. Low Temp. Phys., 12, 387 (1973). F. Bouquet, Y. Wang, and R. A. Fisher, Europhys. Lett. 56, 856 (2001).
- (38) S. Kittaka, T. Nakamura, Y. Aono, S. Yonezawa, K. Ishida, and Y. Maeno, Phys. Rev. B 80, 174514 (2009). S. Kittaka, T. Nakamura, Y. Aono, S. Yonezawa, K. Ishida, and Y. Maeno, J. Phys.: Conf. Ser. 150, 052112 (2009).
- (39) P. G. Kealey, T. M. Riseman, E. M. Forgan, L. M. Galvin, A. P. Mackenzie, S. L. Lee, D. McK. Paul, R. Cubitt, D. F. Agterberg, R. Heeb, Z. Q. Mao, and Y. Maeno Phys. Rev. Lett. 84, 6094 (2000).
- (40) V. G. Kogan, Phys. Rev. Lett. 89, 237005 (2002).
- (41) P. Miranović, K. Machida, and V. Kogan, J. Phys. Soc. Jpn. 72, 221 (2003).
- (42) N. Nakai, P. Miranović, M. Ichioka, and K. Machida, Phys. Rev. Lett. 89, 237004 (2002).
- (43) D. J. Singh, Phys. Rev.B 52, 1358 (1995).
- (44) R. Heeb, and D. F. Agterberg, Phys. Rev. B 59, 7076 (1999).
- (45) K. An, T. Sakakibara, R. Settai, Y. Onuki, M. Hiragi, M. Ichioka, and K. Machida Phys. Rev. Lett. 104, 037002 (2010)
- (46) Y. Hasegawa, K. Machida, and M. Ozaki, J. Phys. Soc. Jpn. 69, 336 (2000).
- (47) G. M. Androes and V. D. Knight, Phys. Rev. 121, 779 (1961).
- (48) C. G. Fatuzzo, M. Dantz, S. Fatale, P. Olalde-Velasco, N. E. Shaik, B. Dalla Piazza, S. Toth, J. Pelliciari, R. Fittipaldi, A. Vecchione, N. Kikugawa, J. S. Brooks, H. M. Rønnow, M. Grioni, Ch. Rüegg, T. Schmitt, J. Chang, arXiv:1503.01574.
- (49) P. Fulde and R. A. Ferrell, Phys. Rev. 135, A550 (1964).
- (50) A. I. Larkin and Y. N. Ovchinnikov, Zh. Eksp. Teor. Fiz. 47, 1136 (1964). [translation: Sov. Phys. JETP 20, 762 (1965)].
- (51) H. Mayaffre, S. Krämer, M. Horvatić, C. Berthier, K. Miyagawa, K. Kanoda, and V. F. Mitrović, Nature Phys. 10, 928 (2014).
- (52) S. Yonezawa, T. Kajikawa, and Y. Maeno, Phys. Rev. Lett. 110, 077003 (2013).
- (53) S. Yonezawa, T. Kajikawa, and Y. Maeno, J. Phys. Soc. Jpn. 83, 083706 (2014).
- (54) S. J. Ray, A. S. Gibbs, S. J. Bending, P. J. Curran, E. Babaev, C. Baines, A. P. Mackenzie, and S. L. Lee, 89, 094504 (2014).
- (55) L. Komendová, Yajiang Chen, A. A. Shanenko, M. V. Miločević, and F. M. Peeters, Phys. Rev. Lett., 108, 207002 (2012).