Status Report:
A Search for Sterile Neutrino at J-PARC MLF (E56, JSNS2)
July 8, 2015
M. Harada, S. Hasegawa, Y. Kasugai, S. Meigo, K. Sakai,
S. Sakamoto, K. Suzuya
JAEA, Tokai, JAPAN
E. Iwai, T. Maruyama111Spokesperson:
(takasumi.maruyama@kek.jp) ,
S. Monjushiro, K. Nishikawa, M. Taira
KEK, Tsukuba, JAPAN
M. Niiyama
Department of Physics, Kyoto University, JAPAN
S. Ajimura, T. Hiraiwa, T. Nakano, M. Nomachi, T. Shima
RCNP, Osaka University, JAPAN
T. J. C. Bezerra, E. Chauveau, H. Furuta, F. Suekane
Research Center for Neutrino Science, Tohoku University, JAPAN
I. Stancu
University of Alabama, Tuscaloosa, AL 35487, USA
M. Yeh
Brookhaven National Laboratory, Upton, NY 11973-5000, USA
H. Ray
University of Florida, Gainesville, FL 32611, USA
G. T. Garvey, C. Mauger, W. C. Louis, G. B. Mills, R. Van de Water
Los Alamos National Laboratory, Los Alamos, NM 87545, USA
J. Spitz
University of Michigan, Ann Arbor, MI 48109, USA
1 Introduction
On April 2015, the J-PARC E56 (JSNS2: J-PARC Sterile Neutrino Search using neutrinos from J-PARC Spallation Neutron Source) experiment officially obtained stage-1 approval from J-PARC. We have since started to perform liquid scintillator RD for improving energy resolution and fast neutron rejection. Also, we are studying Avalanche Photo-Diodes (SiPM) inside the liquid scintillator. In addition to the RD work, a background measurement for the proton beam bunch timing using a small liquid scintillator volume was planned, and the safety discussions for the measurement have been done. This report describes the status of the RD work and the background measurements, in addition to the milestones required before stage-2 approval.
2 Experimental milestones before stage-2 approval
There are two main points to show the J-PARC PAC before stage-2 approval.
(1) The concrete detector location should be considered including the physics
potential of the experiment. This was written in the minutes of the 19th
PAC [1].
For this purpose, we have to discuss this issue in close coordination
with the facility people, since the constraints from the facility are
important to consider alongside the physics ones.
(2) We assume a rejection factor of 100 for fast neutron
events induced
by cosmic rays. The technique using Cherenkov light at LSND
already achieved this factor, however we have to show the performance of the
liquid scintillator (and photo-detector) quantitatively. Both the Cherenkov
technique and the Pulse Shape Discrimination (PSD) technique are tested for this purpose.
For the former, we would like to have a special joint discussion with PAC members and MLF facility people (the FIFC is a candidate). The discussion includes safety issues as well as facility maintenance. We will show the status of the RD for the latter.
3 RD for the JSNS2 Detector
3.1 Motivation
As shown in the status report submitted to the PAC last November [2, 3, 4], all backgrounds in the candidate detector location are manageable for performing the JSNS2 experiment. One crucial assumption is that the detector should have a rejection factor of 100 for fast neutron events induced by cosmic rays. Table 1 shows a summary of the number of background and signal events in the JSNS2 (shown in reference [2]). Based on these assumptions, the background rate induced by cosmic rays is comparable to the other background rates.
| Contents | events | |
|---|---|---|
| = | 480 | |
| Signal | (Best fit values of MLF) | |
| 342 | ||
| (Best fit values of LSND) | ||
| from | 237 | |
| 16 | ||
| background | beam-associated fast n | 13 |
| Cosmic-induced fast n | 37 | |
| Accidental coincidence | 32 |
The factor of 100 fast neutron rejection capability was already achieved by the LSND experiment using Cherenkov light detection, since protons in the energy range of 20-60 MeV (recoiled by fast neutrons induced by cosmic rays) cannot emit Cherenkov light. However we have to show the performance of JSNS2 detector independently since the design is different from the LSND.
We are also trying to establish a PSD technique, because it uses independent information from Cherenkov light: The output signals’ pulse shape from liquid scintillator are different between protons recoiled by fast neutrons and positrons from Inverse Beta Decay (IBD). If we can use both information from Cherenkov and PSD, the rejection power could be even stronger than what has been assumed.
In the following subsections, we show the status of the RD using small prototype devices. For the Cherenkov test, there is a 10L prototype, and a 0.1L level prototype is used for the PSD test.
The possibility to use APD (SiPM) is also being considered, since the space of the detector is tightly restricted, thus SiPMs may be used for the veto region even though the photo-coverage is small. Therefore, its RD status is also described briefly.
3.2 PID Capability using Cherenkov Light in Liquid Scintillator
The JSNS2 experiment plans to use linear alkylbenzene (LAB) as the base of the liquid scintillator. However, we have started to follow the measurements in reference [6] using Mineral oil + 0.03g/l b-PBD at first, since the LSND study will be an excellent reference for subsequent measurements. A cylindrical prototype detector with dimensions of 130mm (diameter) 1000mm (height) was prepared for this test. Figure 1 shows the measurement setup. The cylindrical prototype is filled with water or diluted scintillator, and a black sheet is lining inside the detector to avoid reflections of light. The motivation of this experiment is to measure the timing difference between Cherenkov light and scintillation light mainly. The Cherenkov light has a faster emission timing than that of the scintillation light in general. Note that water does not emit scintillation light, therefore it provides a good cross check of the timing information.
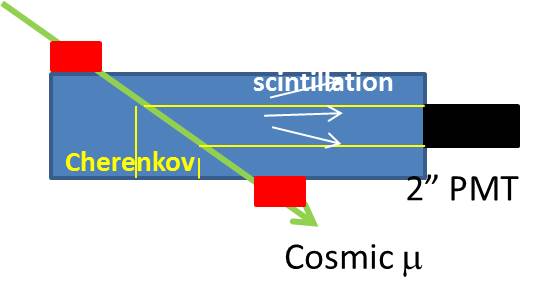
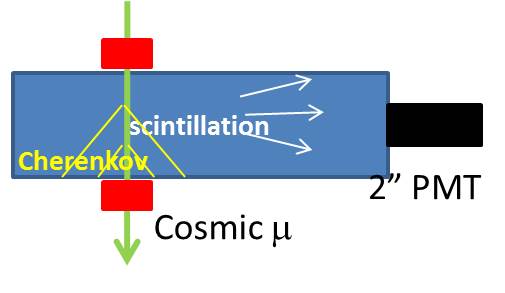
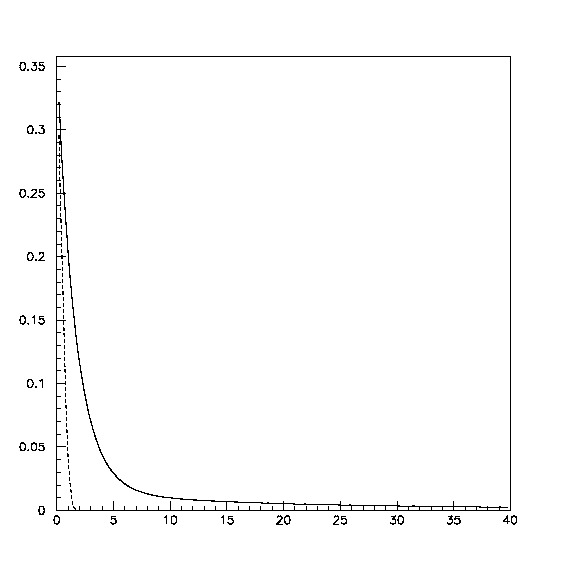
If the photo-detector receives the scintillation and Cherenkov light at the same time, the timing distribution should be like Fig. 2. The solid line shows the scintillation light while the dashed line corresponds to the Cherenkov light. Here we assume that the time distribution of the scintillation light emission is the sum of a exponential for the fast time component and a (1+t/)-2 empirical shape of the slow light, as written in the LSND NIM paper [6]222 The fast time constant is 1.65 ns, and the slow time constant is 22.58 ns. The mixture ratio is 57 and 43 for each component.. We also assume a time resolution of 0.5ns for the photo-detector (only for Cherenkov). Note that these time constants depend on the liquid scintillator being used.
3.2.1 Cross-check with filling Water
For the water case, there is no scintillation light, and we therefore did not see any light in the setup shown in the bottom of Fig. 1(b). On the other hand, we can see Cherenkov light with the setup shown in the top of Fig. 1(b).
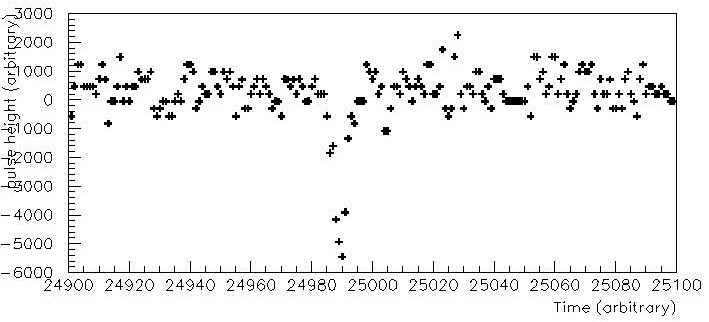
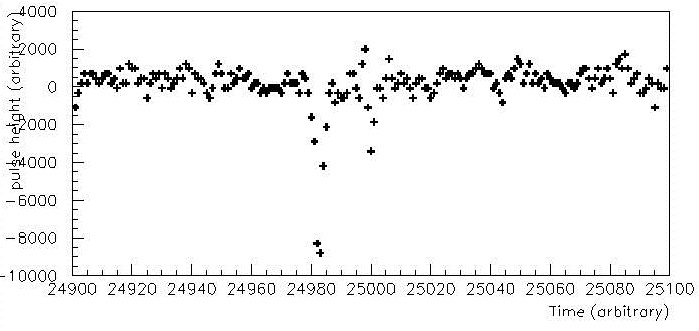
Figure 3 shows the typical waveform timing distributions in an oscilloscope. We will use the oscilloscope data for the analysis since the cosmic ray trigger rate is very low. The two plots show typical timing distributions of the coincidence from the scintillation counters (top) and Cherenkov light (bottom). Note that the coincidence signal from the scintillation counters was delayed due to electronics. Also, this relative timing was smeared by the PMTs jitter (1 ns), electronics (within 1 ns), and hit position of the cosmic rays ( ns). This measurement is important for understanding the effect of the jitters.
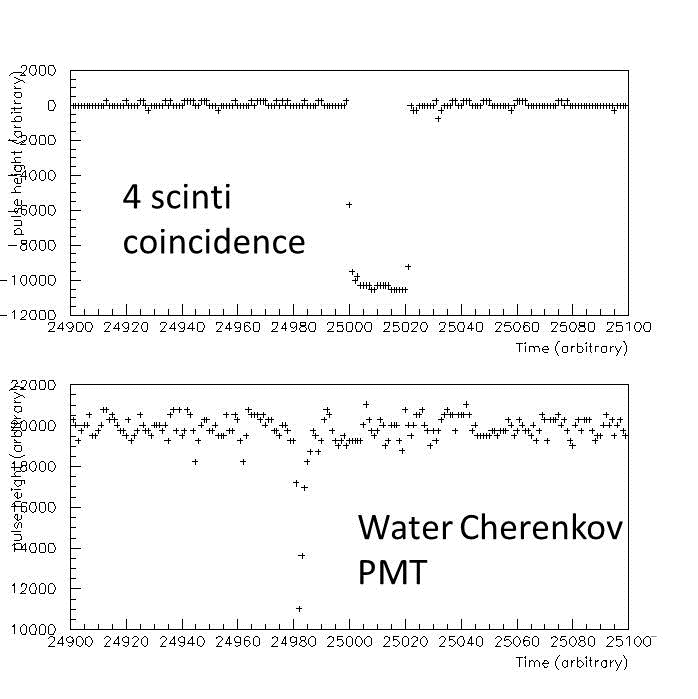
If the pulse height exceeds below -2000 counts beyond the ground line (e.g.: 20000 is the ground line, and the threshold is 18000 in the bottom plot of Fig. 3), it is regarded as signal. -2000 corresponds to a threshold of about 1/3 photo-electrons (p.e.), therefore the threshold is low enough to search for the signal hits.
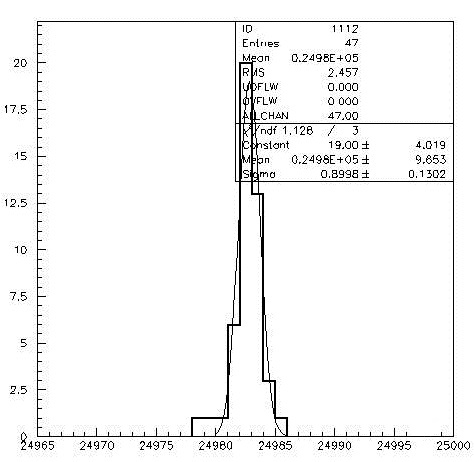
Figure 4 shows the relative timing of water Cherenkov signals with respect to the coincidence. The timing of the fastest point of each signal which exceeds 2000 counts is plotted in this figure. Out of 100 triggers, about half of them have signals beyond the threshold, and this rate is reasonable according to the MC simulation333 MC calculation shows that the Cherenkov light gives 0.50.8 p.e. / trigger. The uncertainty is due to the momentum and angle of cosmic rays. They are not included in the MC yet because the timing does not depend on those.. As shown in the plot, the total jitter of the water Cherenkov signal (or the relative timing resolution from systematic effects) is 1.8 ns.
3.2.2 Diluted Scintillator
Hereafter we show the measurements using a diluted scintillator, which contains mineral oil plus 0.03g/l of b-PBD. This diluted scintillator was used in the LSND experiment, and it can be used as the reference of the other measurements or for discussion of detector performance.
Setting for scintillation light only detection (Fig. 1(b))
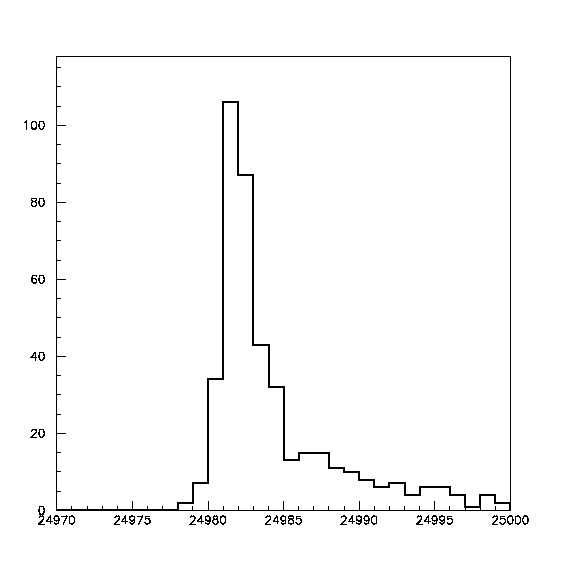
The scintillation light with the setting shown in Fig. 1(b) is discussed first. With this setting, there should be only scintillation light detection. Figure 5 shows the typical signals using the diluted scintillator. Events with a slow scintillator timing signal and multiple light signal are shown.
To analyse events with multiple hits, one hit is defined as follows.
-
•
Points less than -2000 counts are searched for.
-
•
If there are more than two points, it is judged whether they are in sequence in time or not. If they are in sequence, they are regarded as one hit.
-
•
The fastest point within one hit is recorded as the “timing of the hit”
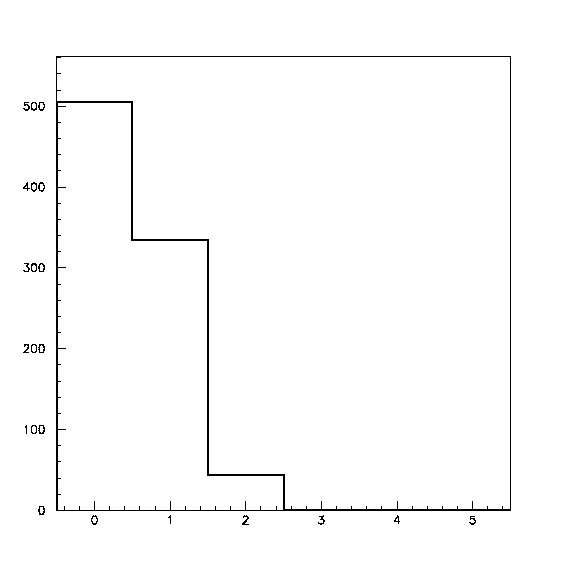
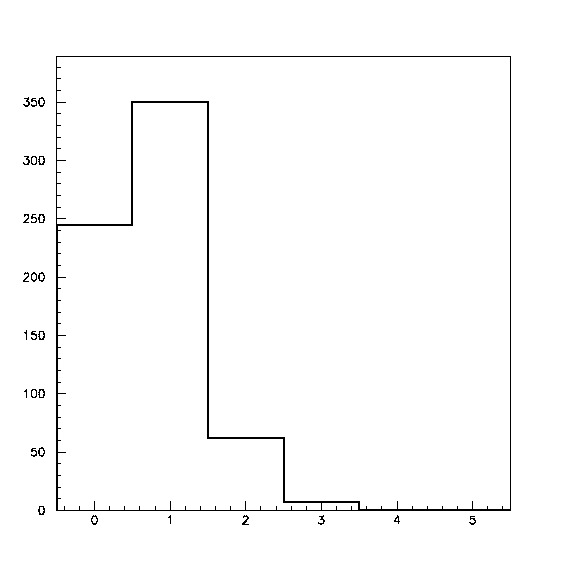
Figure 6 shows the number of hits per one event and the hit timing distribution. Clearly, the slow components from the scintillator can be seen.
Setting to detect scintillation plus Cherenkov light (Fig. 1(a))
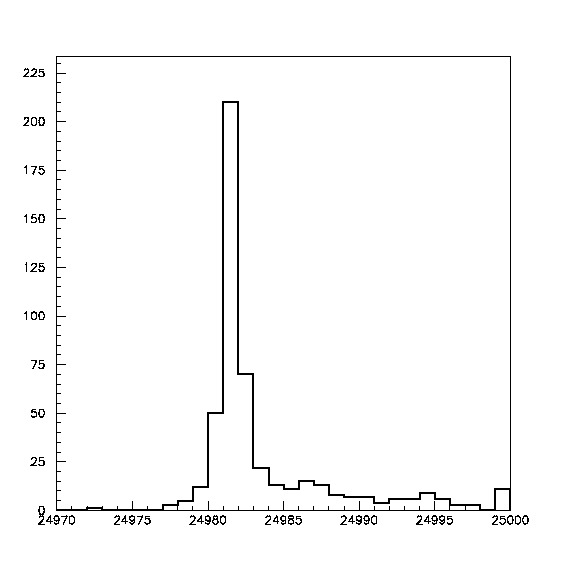
An analysis with the setting shown in Fig. 1(a) was performed as well. The procedure for this analysis is exactly the same as what was described before. Figure 7 shows the results on the number of hits and timing of the hits. As expected, both the number of hits (left) and the number of hits around the fast timing (right plot - same timing as the expected Cherenkov timing), increased.
Comparison between scintillation only and Cherenkov+scintillation light
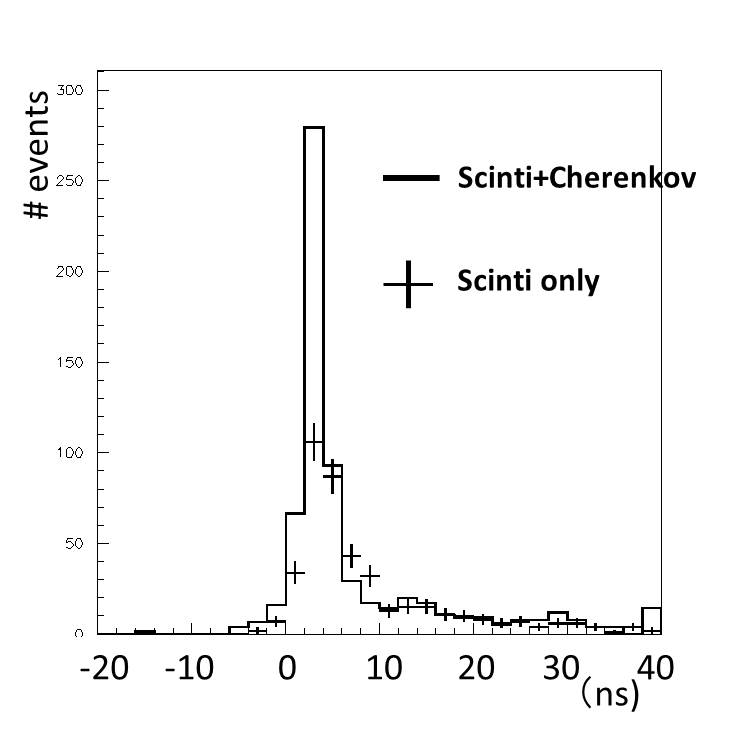
Figure 8 shows the timing comparison between the scintillation light only case and the Cherenkov+scintillation light case. The horizontal axis is changed to ns to understand it better (starting point is still arbitrary). Also both data sets are normalized using the number of triggers. Two things are easily understood: (A) Cherenkov timing is faster than scintillation light as expected. (B) The amount of the Cherenkov light is comparable to the scintillation light in this scintillator condition. For the future work for item (A), we have to compare this result with Fig. 2 quantitatively (with smearing 1.8 ns at least), since one may reduce total jitter. For the future work of item (B), to compare the amount of the light from Cherenkov and scintillation, a detailed MC simulation is necessary, especially for the Cherenkov part since cosmic rays have momentum and zenith angle distributions.
3.2.3 PID Summary
We checked the performance of a LSND type liquid scintillator directly. The Cherenkov light is useful information in this diluted scintillator condition as expected. However, this statement is still qualitative, and we need a more quantitative statement in combination with the MC simulation.
Three future directions should be examined with this RD. (1) variation of the concentration of the scintillator components for diluted scintillator, (2) similar study using linear alkylbenzene (LAB), and (3) test beam with protons. All will be done in order with priorities.
With these inputs, it is important to estimate the realistic PID capability using MC simulation with a real size detector. This will be done within about 1.5 years.
3.3 Pulse Shape Discrimination (PSD) of Liquid Scintillator
3.3.1 R&D of Gd loaded liquid scintillator(GdLS)
The Japanese group tried to load Gd to LAB based liquid scintillator following the Daya-Bay experiment’s paper [7]. The JSNS2 experiment will use this liquid type and the test with a small size detector will be done in Japan. In order to load Gd in LAB, it is necessary to use a Gd-carboxylate complex formed by a mixture of gadolinium chloride, neutralization solution with TMHA, and ammonium hydroxide. A sample of the Gd-carboxylate complex was made and used to produce the Daya Bay type liquid scintillator with 0.1 w% of Gd concentration.
In order to check whether Gd was successfully loaded in the LAB, the thermal neutron capture time was measured since there is a correlation between the neutron capture time and Gd concentration.
The measurement setup is shown in Fig. 9.
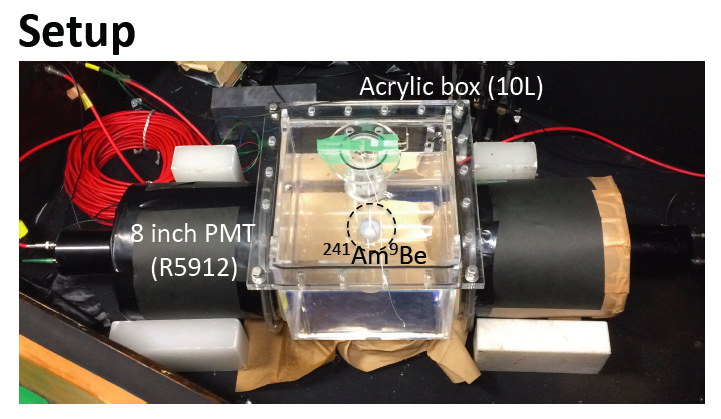
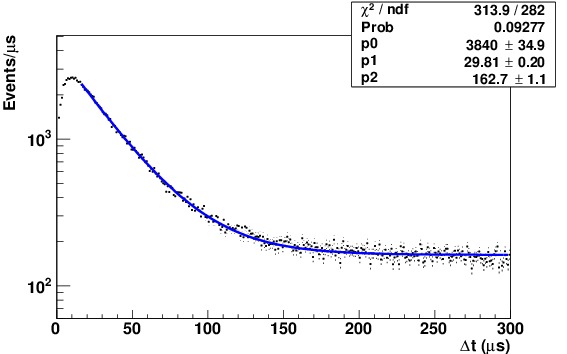
The volume of the sample is 10L contained in an acrylic box. The scintillation light is viewed by two 8 inches PMTs and the signals are taken with a flash ADC module (CAEN V1721, 500MS/s, 8bits). An 241Am9Be source, which emits both a 4.4 MeV gamma and neutron below 11 MeV, is set at the center of the acrylic box. The gamma and protons recoiled by the neutron are detected as the prompt signal, and gammas from thermal neutron capture on Gd are detected as delayed signal after about 30sec of mean time. Figure 10 shows the time difference (t) distribution between the prompt and delayed signals, which includes samples of accidental coincidences. Therefore, it was fit with a sum of an exponential and flat function. Then the thermal neutron capture time is estimated as 29.80.2 sec, which can be compared with the expected time of 28 sec. Considering the fit result, it was confirmed that about 0.09 w% of the Gd concentration was loaded in LAB.
3.3.2 R&D of GdLS with capability of n/ pulse shape discrimination (PSD)
Measurement of the PSD capability for Daya Bay type of GdLS
We measured the PSD capability for Daya Bay type scintillator(DBLS) without Gd (only LAB, PPO and bisMSB). The neutrino energy in JSNS2 is a few tens MeV. The PSD capability increases with the neutrino energy, so if the DBLS shows enough cosmic induced fast neutrons rejection power while maintaining high signal efficiency in the energy range around a few tens MeV, we can use DBLS without any PSD capability improvement.
Figure.11 shows the setup of the PSD capability measurement.
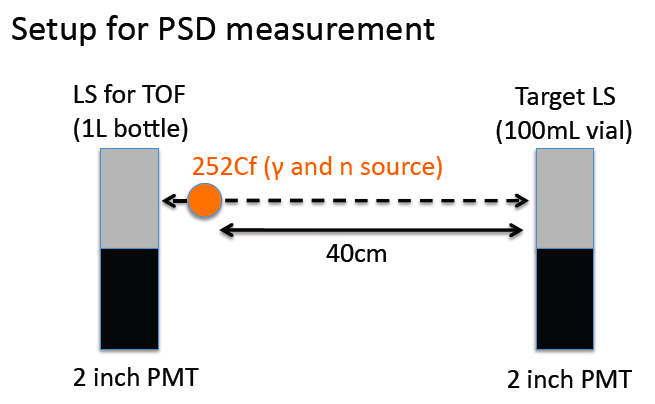
The target scintillator is contained in a 100 mL vial and another liquid scintillator volume, with 1 L, where the 252Cf source is attached. The 252Cf source emits both and neutron with an energy of few MeV, and the coincidence signals of the scintillators are detected for the PID. The distance between the target scintillator and the 252Cf source is 40cm. Using the hit time difference between both scintillators, the neutron events can be distinguished from the gamma events, because the time of flight(TOF) of the neutron is different from that of gammas, as shown in the vertical axis of Fig. 13.
Waveforms of both scintillators are taken with a flash ADC module (CAEN V1730, 500MS/s, 14bits). To evaluate the PSD capability, the ratio of the tail integrated charge of the waveform to the total integrated charge is used (TailQ/TotalQ variable). In this analysis, events around 500 photoelectrons are used for the evaluation of PSD capability since this number of photoelectrons corresponds to the mean energy of neutrons / s of the 252Cf source with consideration of the light acceptance of the 2 inches PMT attached to the vial vessel. On the other hand, this number of photoelectrons corresponds to 3.5 MeV in the JSNS2 experiment considering the acceptance difference of the detectors. Neutrino energy is a few tens MeV in the JSNS2 experiment, so this analysis gives a very conservative evaluation. To evaluate the PSD capability in the actual energy range, higher energy neutron and electron sources are necessary.
Figure 12 shows the correlation between the TailQ/TotalQ variable and the detected number of photoelectrons for the DBLS. In the plot, there are two bands along the horizontal axis, which show the separation between gammas and neutrons.

The left plot of Fig. 13 shows the correlation between the TOF and the TailQ/TotalQ variable around 500 photoelectrons in Fig. 12, and the right plot shows the 1D histograms of the TailQ/TotalQ distributions for gammas and neutrons.

Using the TOF cut (orange line in the left plot), the neutron events can be distinguished from the gamma events. Each TailQ/TotalQ distribution after applying the TOF cut was fit with a Gaussian function, and the rejection power of neutrons and the detection efficiency of neutrino events (gamma) can be estimated by using the fit results. Figure 14 shows the correlation between the detection efficiency of gammas and the neutron mis-ID fraction.

At a factor of 100 rejection power for neutrons (neutron Mis-ID fraction 0.01), the detection efficiency of gammas for the DBLS is 0.85. The high detection efficiency using the DBLS is shown around 3.5 MeV equivalent already, so an efficiency increase is expected in the energy range of a few tens MeV due to photo-statistics.
Future plan
It is important to measure the PSD capability in the actual JSNS2 energy range of a few tens MeV. Neutrons and electrons created by an accelerator can be considered for this test.
In addition to testing with a small size detector, it is essential to estimate the PSD capability of the real size detector using MC simulations. Because of the distortion of the hit time distribution (or sum of waveforms) due to scintillation light attenuation, the light reflection by the tank and mis-reconstruction of the vertex, a large detector has worse PSD capability.
We need to design a detector which can precisely measure the time
distribution of scintillation light emission event by event for high
PSD capability. We are considering the following crucial items;
(A) Develop a tank with less light reflection
(B) Flash ADC module with high sampling rate(500MS/s) and number of bits(10bits).
(C) Optimization of number of photoelectrons (light yield of the GdLS).
(D) Develop a good vertex reconstruction algorithm.
3.4 APD (SiPM)
The current design of the JSNS2 detector is based on technologies that have succeeded in other experiments. The geometric size of the JSNS2 detector, however, will be comparatively reduced to adapt to the MLF facility. With respect to the optical detection, large photomultipliers (10 inch) will be used as photon-detectors. In this case, large-sized PMT could affect the design of a sub-detector, such as a Veto counter. This influence becomes large in the compact detector system, such as with JSNS2. Therefore, we have started to study the possibility of using APD (avalanche photodiode) technology as a substitute of the photomultiplier. It is one possibility as a supplement to the JSNS2 detector design.
For the JSNS2 test, Hamamatsu photonics provided some engineering samples of MPPC (multi-pixel photon counter), APD production. We have started the verification of the MPPC in liquid scintillator for long-term usage. At present, three types of MPPC were tested (listed in Table. 2).
| Model | Package Type | Pixel | Window material |
|---|---|---|---|
| S-10362-11-025U | Metal | 1600 | Borosilicate glass |
| S-10362-33-050U | Ceramic | 400 | Silicon |
| S-10362-11-100U | SMD | 100 | Epoxy resin |
In the JSNS2 experiment, liquid scintillator(LAB) is chemically active. A MPPC may therefore be damaged by the liquid scintillator. We are studying potential damage to the window material due to the package type.
For the first test, we used the mineral oil in section 3.2, and continue to observe an influence on the window of MPPC in liquid scintillator. The silicon window of the ceramic package was deformed and become cloudy in a day.
In the future, we will evaluate the influence with a term of a month or year. We will check the deformation of the window and gain of the MPPCs. We have a plan for development of a MPPC in the liquid scintillator in collaboration with the manufacturer.
4 Background Measurement on the Proton Bunch Timing using 1.6L detector
As shown in the previous PAC [2], there is a significant neutral particle flux that is observed in the proton bunch timing window, while this background is manageable outside of this window for the JSNS2. An additional particle ID measurement (neutrons or s) for the particles on the proton bunch timing using a small size (1.6L) liquid scintillator detector was planned at the MLF 3rd floor. We assumed that all particles are neutrons in the previous status report, but, if there is some fraction, the number of backgrounds for the delayed signal will be smaller.
Unfortunately, there have been two large incidents (fire from muon site and mercury target cooling issue) at the MLF. Therefore, the measurement was not done yet, but the safety discussion was successfully done carefully between facility people and the experiment. Hopefully, this measurement will be done starting this autumn.
5 Summary and Plan
In this report, we show the status of our RD work, which is going well. However, the concrete detector performance with quantitative numbers with the realistic MC simulation should be shown before the stage-2 approval.
In addition to this RD work, a realistic detector location will be investigated in consideration of the the facility constraints.
6 Acknowledgements
We warmly thank the MLF people, especially, Dr. Futakawa, MLF Division leader, the neutron source group, muon group and the user facility group for the various kinds of supports. We also appreciate the support from grant-in-aid, J-PARC and KEK.
References
- [1] http://j-parc.jp/researcher/Hadron/en/pac_1412/PAC19thMinutes_final_draft.pdf
- [2] http://research.kek.jp/group/mlfnu/status_report_141118.pdf
- [3] M.Harada, et al, arXiv:1502.02255 [physics.ins-det]
-
[4]
S. Ajimura et al,
Prog. Theor. Exp. Phys. 2015 6, 063C01 (2015), doi:10.1093/ptep/ptv078 - [5] M.Harada, et al, arXiv:1310.1437 [physics.ins-det]
- [6] R. A. Reeder et al, Nucl. Instrum. Meth. A334, 353 (1993)
- [7] Y. Ding et al, Nucl. Instrum. Meth. A584, 238 (2008)