Classical T Tauri stars with VPHAS: I: H and -band accretion rates in the Lagoon Nebula M8
Abstract
We estimate the accretion rates of 235 Classical T Tauri star (CTTS) candidates in the Lagoon Nebula using ugriH photometry from the VPHAS+ survey. Our sample consists of stars displaying H-excess, the intensity of which is used to derive accretion rates. For a subset of 87 stars, the intensity of the -band excess is also used to estimate accretion rates. We find the mean variation in accretion rates measured using H and -band intensities to be 0.17 dex, agreeing with previous estimates (0.04-0.4 dex) but for a much larger sample. The spatial distribution of CTTS align with the location of protostars and molecular gas suggesting that they retain an imprint of the natal gas fragmentation process. Strong accretors are concentrated spatially, while weak accretors are more distributed. Our results do not support the sequential star forming processes suggested in the literature.
keywords:
accretion, accretion discs, stars: pre-main sequence, stars: variables: T Tauri, Herbig Ae/Be, open clusters and associations: individual: NGC 6530, Lagoon Nebula, M81 Introduction
Classical T-Tauri stars (CTTS) are low-mass pre-main sequence (PMS) stars thought to accrete mass from a circumstellar disc via a stellar magnetosphere. Mass accretion rates () are thought to decrease with time as the circumstellar disc material is depleted. Simple viscous disc evolution predicts the observed trend rather well (Sicilia-Aguilar et al. 2006; Barentsen et al. 2011; Manara et al. 2012). Observations also reveal that scales steeply to the square of the stellar mass (Muzerolle et al. 2003; Natta, Testi & Randich 2006; Sicilia-Aguilar et al. 2006; Rigliaco et al. 2011; Manara et al. 2012; Kalari & Vink 2015) in a variety of environments, however no such dependence is actually predicted by current theory (Hartmann et al. 2006). Observational estimates can provide an empirical base against which disc evolution models can be tested, and star formation histories of individual star-forming regions can be de-constructed (Barentsen et al. 2011; Venuti et al. 2014). Selection effects (Clarke & Pringle, 2006) and intrinsic variability (Scholz et al. 2005; Costigan et al. 2012, 2014) may however affect the observed relations, and for these reasons large, uniform statistical samples are essential to constrain theory.
Empirical values have been derived from intermediate-to-high resolution spectra (Muzerolle et al. 2003; Natta et al. 2006; Sicilia-Aguilar et al. 2006), -band (Rigliaco et al. 2011) or H photometry (Barentsen et al. 2011; De Marchi et al. 2010; Spezzi et al. 2012; Manara et al. 2012). Statistical studies of have generally been restricted to relatively nearby star-forming regions, such that the effects of either massive stars or the variation of the star-forming environment on PMS evolution remain poorly constrained. In particular, whether photoevaporation from OB stars in the local environment affects remains an open question (Williams & Cieza, 2011).
The advent of deep, high-resolution wide field narrow and multi-band surveys of the Galactic plane affords new opportunities to study star forming regions in greater details and to uncover significant new samples of CTTS in a variety of star-forming regions to address the problems raised in the preceding paragraphs. The VST Photometric H survey of the southern Galactic plane and bulge (VPHAS+) is an H imaging survey reaching down to 21 mag (Drew et al., 2014). rates can potentially be estimated photometrically from either the -band or H excess with known detection limits. It thus becomes possible to construct a sample of rates that is relatively complete for PMS masses down to 0.5 at 2 kpc, assuming moderate extinction ( 2). This enables a uniform data-set in a variety of notable star-forming regions, including the Carina Nebula, NGC 6611, and NGC 3603. Such work has already begun by Vink et al. (2008) in the Cygnus OB 2 massive star forming region, Barentsen et al. (2011) in the IC 1396 star-forming region, and Barentsen et al. (2013) in the open cluster NGC 2264 using data from the counterpart northern Galactic plane survey IPHAS (Drew et al., 2005).
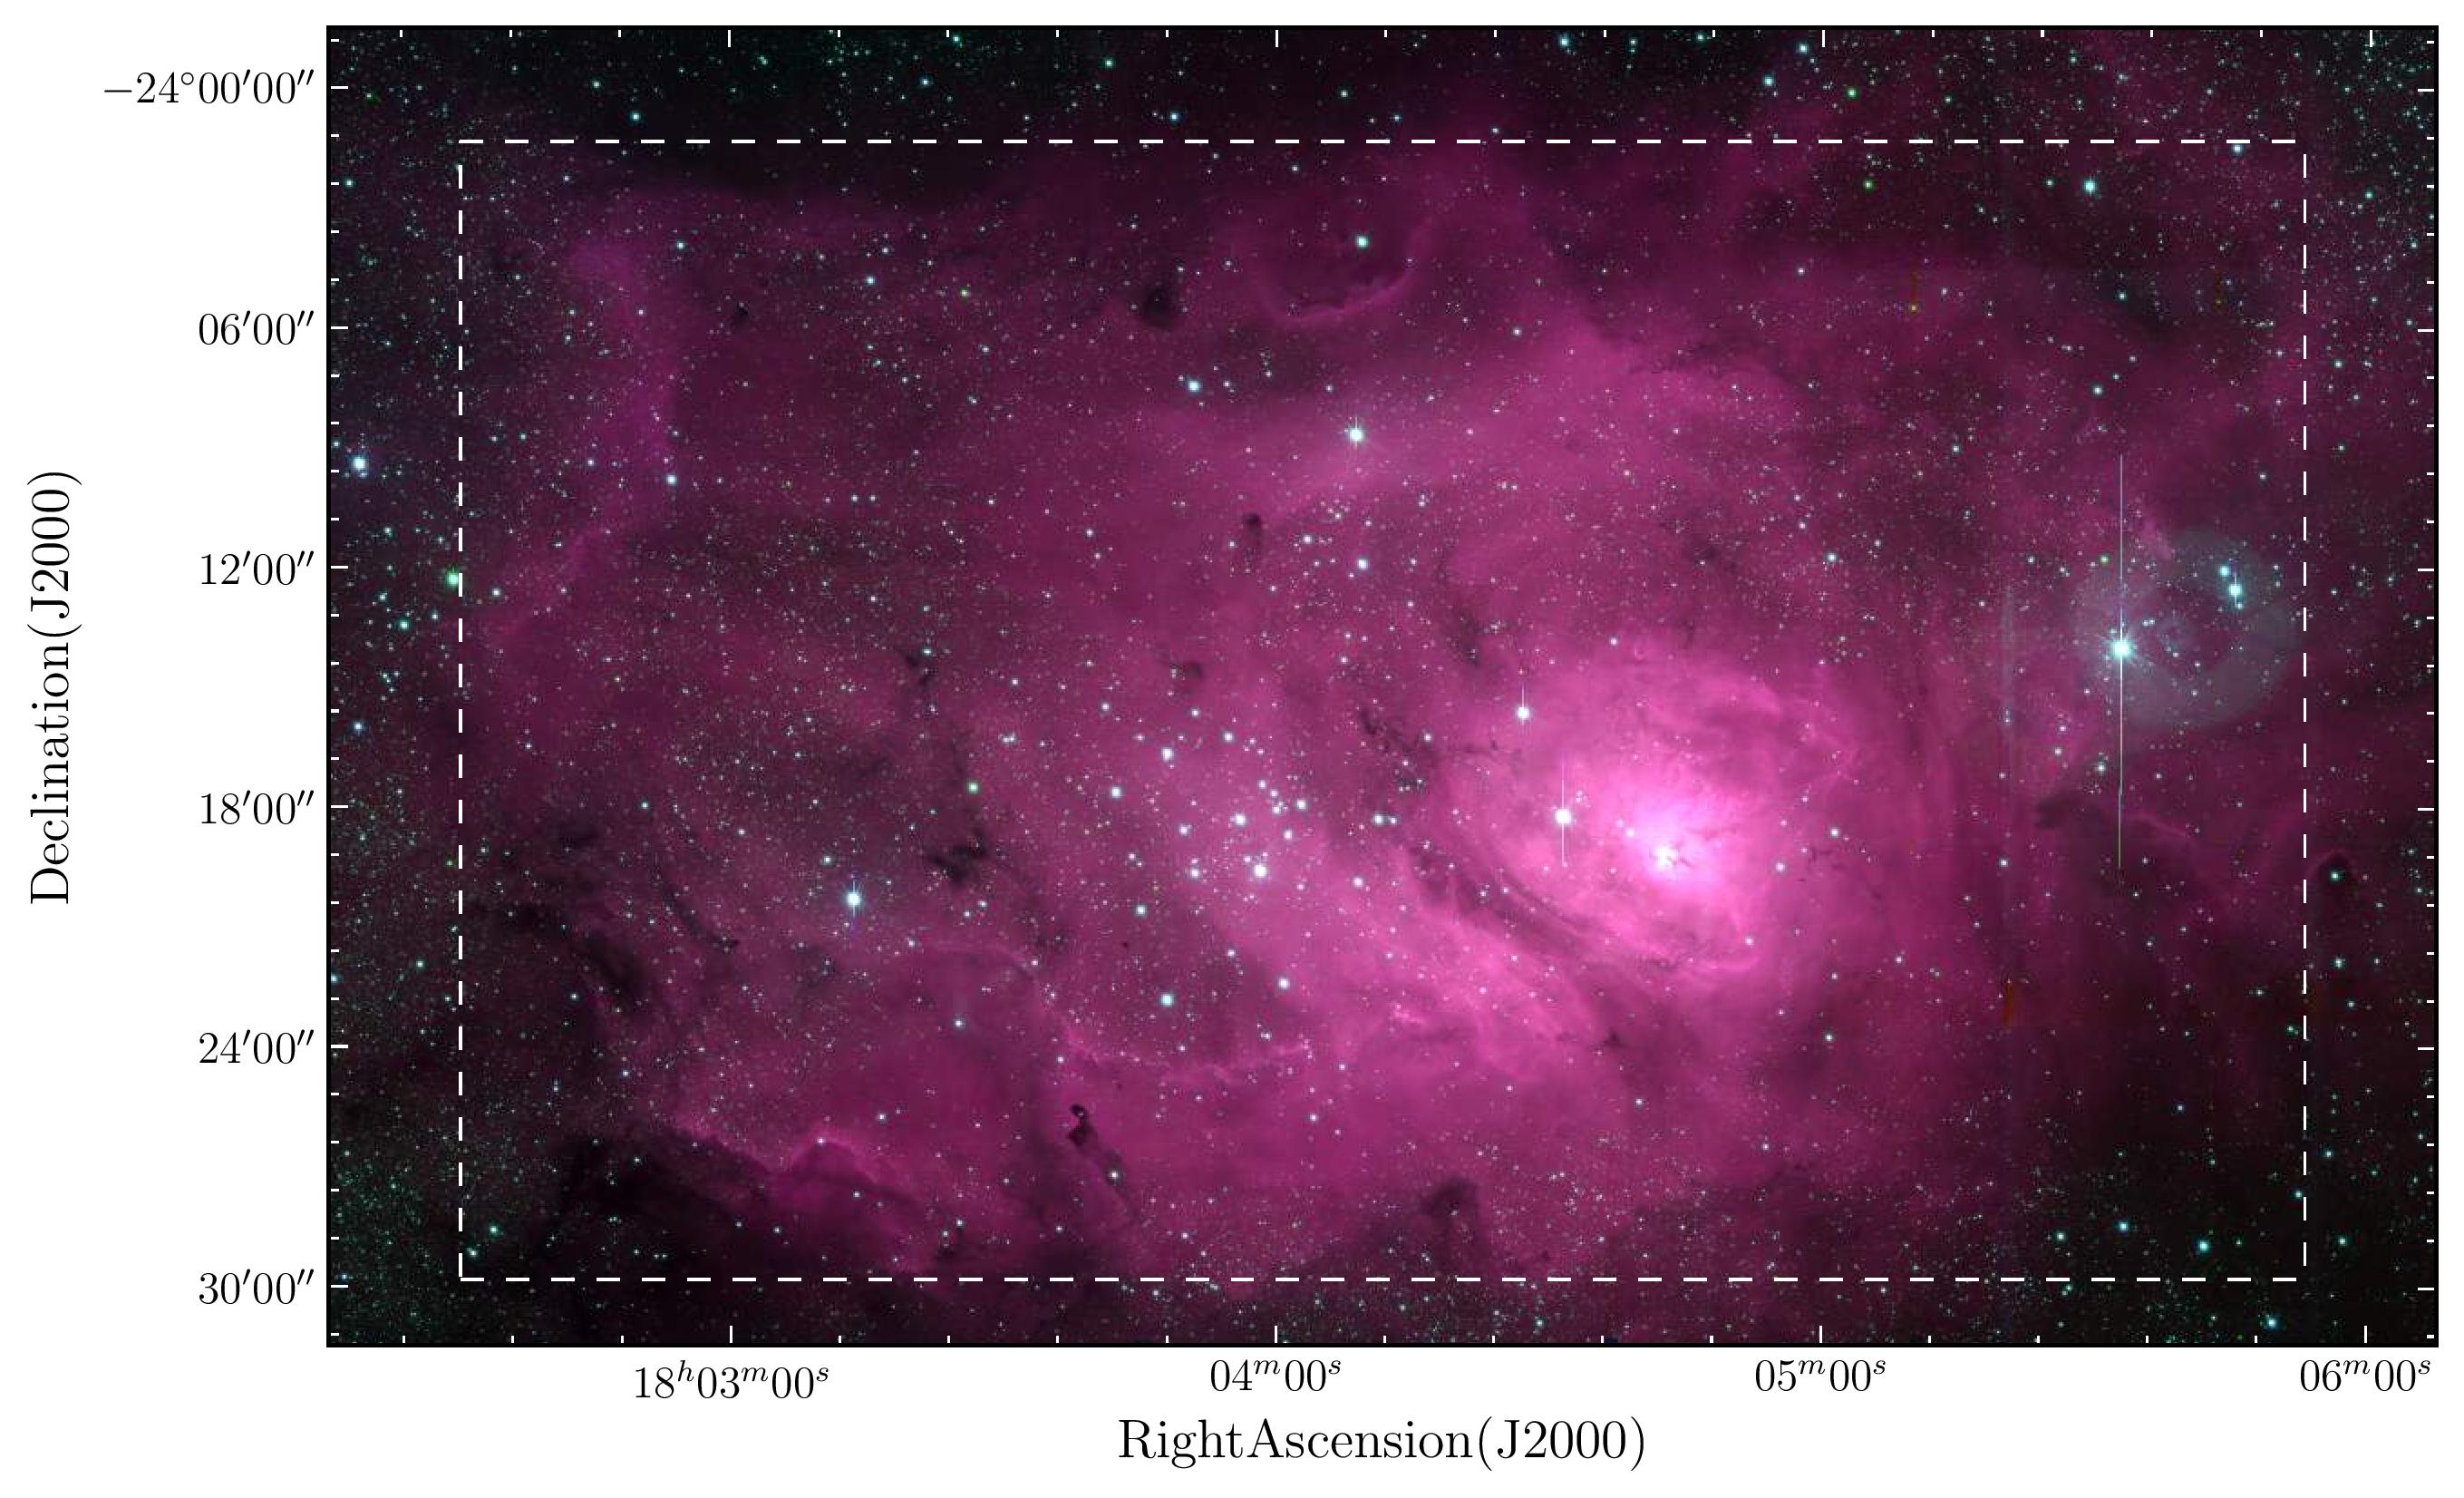
In this paper, we aim to measure for a significant fraction of CTTS candidates in the Lagoon Nebula (M8) identified using VPHAS+ survey photometry. M8 is a southern HII region located in the Sagittarius-Carina arm. It comprises the embedded open cluster NGC 6530 located to the east of the central dust lane, and the optically obscured Hourglass nebula cluster to its west (see Fig. 1). It contains at least sixty known PMS members (Sung, Chun & Bessell 2000; Prisinzano et al. 2005; Arias, Barbá & Morrell 2007; Tothill et al. 2008), but with very few estimates in literature (Gallardo, del Valle & Ruiz, 2012). The median age of PMS members in the region has been estimated 1 Myr using colour-magnitude diagrams (CMD; Sung et al. 2000; Prisinzano et al. 2005; Mayne et al. 2007; Arias et al. 2007), concurrent with both the dynamical age (Chen, de Grijs & Zhao 2007; van Altena & Jones 1972) and the main-sequence position of the confirmed O-type members (Tothill et al. 2008). It is comparatively younger than most regions for which a statistically significant number of estimates are known (e.g. see Fig. 8 in Spezzi et al. 2012) to enable a meaningful statistical analysis. However, it has been suggested that a previous burst of star formation occurred around 10 Myr ago by Lada et al. (1976) and van den Ancker et al. (1997). Lightfoot et al. (1984); Damiani et al. (2004); Prisinzano et al. (2005); Arias et al. (2007); Prisinzano et al. (2012) have reported sequential age gradients of the PMS members in region.
The mean reddening towards NGC 6530 measured using UBV colour diagrams (Sung et al., 2000), SED-fitting (van den Ancker et al., 1997; Arias et al., 2006) and isochrone fitting (Prisinzano et al. 2005; Mayne & Naylor 2008) is 0.35 mag. The highest measured in these studies is 0.5 mag for a few stars, and the foreground extinction 0.2 mag. Distance () determinations to NGC 6530 using isochrone fitting provide = 125050 pc (Prisinzano et al. 2005; Arias et al. 2007; Mayne & Naylor 2008). Previous measurements indicate as high as 1800 pc (van den Ancker et al. 1997; Sung et al. 2000). This discrepancy is thought to arise because larger determinations rely on fitting only O and early B type stars, rather than the complete blue edge of the distribution of stars in the upper main sequence on the CMD. Prisinzano et al. (2005) argue that any background stars lying behind the nebula must be significantly reddened, moving them away from the main sequence. Based on the above argument, Prisinzano et al. (2005) suggest that the blue edge of the distribution of stars in the CMD more accurately defines the zero-age main sequence at the distance to the Lagoon Nebula.
Most authors (Neckel & Chini, 1981; Sung et al., 2000; van den Ancker et al., 1997; Arias et al., 2002, 2006) have found the reddening to follow a normal reddening law, 3.1, but found that H 36, an O7 V star located in the Hourglass nebula with ranging from 4 - 8 (Johnson, 1967; Sung et al., 2000). This anomaly is explained by the presence of larger silicate grains surrounding H 36, suggesting selective evaporation in its immediate environment leading to an anomalous in the close vicinity (Hecht et al., 1982). Sung et al. (2000) used the colour-excess ratio and found a range between 3.0 - 3.6 for OB stars in the Lagoon Nebula with a mean of 3.1, but higher values for PMS stars which were effected by blue excess emission, and H36. We note that Prisinzano et al. (2012) used the longer baseline afforded by the ratio to find 5, inconsistent with standard reddening. However, many of the stars used to derive this reddening law were PMS stars that are most likely affected by excess blue and infrared emission. Prisinzano et al. (2012) note that because of this, they were unable to constrain with precision. We note that an anomalous reddening law of = 5 leads to a difference of 0.5, which is approximately the same as the spread in values.
At the mean reddening and distance to the Lagoon Nebula 0.3 - 2 PMS stars span a magnitude range 13 21, making VPHAS+ photometry suited to estimate their . The four confirmed O-type members plus some sixty B-type stars (Tothill et al., 2008) represent a step toward increasing the massive star content compared to similar works using IPHAS in the Northern Galactic plane (Barentsen et al. 2011; Barentsen et al. 2013).
In Section 2, VPHAS observations and source selection criteria are detailed. In Section 3, we identify CTTS candidates. We measure the accretion rates and stellar properties of the CTTS candidates in Sect. 4. The distribution of with respect to stellar mass is discussed in Section 5. The spatial distribution of CTTS, and their properties is presented in Section 6. Finally, our conclusions are presented in Section 7.
2 Data
VPHAS+ imaging is obtained by the OmegaCAM CCD imager mounted on the 2.6 metre VLT Survey Telescope (VST) on Cerro Paranal, Chile. The imager captures a square field of view at a resolution of 0.21 pixel-1. Each pointing is supplemented by at least one offset exposure to minimise CCD gaps. Imaging is carried out through broadband ugri filters and a purpose-built H filter. The central wavelength and bandpass of the H filter are 6588 and 107 Å respectively. Exposure times are 150, 30, 25, 25, and 120s respectively. VPHAS+ reaches a 5 depth at H = 20.5-21.0 mag and = 22.2 - 22.7 mag. Practical constraints have meant that the blue () and red (H) observations are carried out separately. An additional observation is carried out with every blue observation to serve as a linking reference.
Observations used in this paper are detailed in Table 1. Data from the survey are pipeline processed at the Cambridge Astronomical Survey Unit (CASU), where nightly photometric calibrations are performed. Astrometry of sources is refined by matching with the 2MASS catalogue (Cutri et al., 2003).
Overlaps between the observations were used to bring the red and blue data onto a common internal scale. The calibrations of band-merged catalogues were checked and refined using external data from the APASS all-sky catalogue (http://www.aavso.org/apass). We cross-matched bright sources (13 mag 15) morphologically classified as stellar in the VPHAS+ bands, and having random photometric error in each catalogue less than 0.1 mag. Around 200 sources were selected for comparison in each band. The median magnitude offsets found were (red) = 0.027, (blue) = 0.029, = 0.0106, = 0.044. = 0.23 mag was determined following the procedure described in Drew et al. (2014).
| Right Ascension | Declination | Filters | Obs. Date | Seeing |
|---|---|---|---|---|
| 18h02m06.32s | 241136.8 | H | 2012 June 10 | 0.6 |
| 18h01m23.47s | 240036.0 | H | 2012 June 10 | 0.6 |
| 18h06m18.95s | 241136.8 | H | 2012 June 27 | 0.7 |
| 18h05m36.10s | 240036.0 | H | 2012 June 27 | 0.7 |
| 18h02m06.32s | 241136.8 | 2012 Aug 14 | 0.8 | |
| 18h01m23.47s | 240036.0 | 2012 Aug 14 | 0.8 | |
| 18h06m18.95s | 241136.8 | 2012 Aug 15 | 0.9 | |
| 18h05m36.10s | 240036.0 | 2012 Aug 15 | 0.9 |
2.1 Source selection
The area of study is centred on RA 18h04m12s, Dec 241836 (J2000) and covers 50 30 (Fig. 1). This region encloses the Lagoon Nebula (Tothill et al. 2008). We apply the following criteria to select sources:
-
1.
13 mag in both the red and blue filter sets to avoid saturated sources;
-
2.
random photometric error must be less than 0.1 mag in ,(red and blue), and H to keep photometric and propagated uncertainties small;
-
3.
morphologically classified as stellar in and and either stellar or star-like in r (see Table 7 in González-Solares et al. 2008) to avoid extended objects.
-
4.
morphologically classified as either stellar, star-like or extended in H and -band photometry. The reasoning behind these criterion are given in the following paragraph.
-
5.
average pixel confidence value greater than 90 and 95 per cent in broadband and H respectively (see Drew et al. 2014). This is especially important in H to ensure the photometry remains unaffected by extra vignetting by the T bars separating the H filter segments.
To filter for background variations, the CASU nebuliser routine is performed on the VPHAS+ images as part of the data processing pipeline. The background is modelled using a sliding median filter over a scale of 15. Although rapidly spatially varying nebulosity on shorter spatial scales can lead to imprecise sky subtractions. This is especially pertinent when considering the variation of nebulosity on small scales as is the case in the regions surrounding the NGC 6530 cluster and the Hourglass nebula (see Fig. 1). Imperfect sky subtractions or imperfect flat-fielding in such cases can affect the point spread function of sources especially in H and -band photometry respectively. In such cases, the final morphological classification of H or -band sources assigned by the pipeline may be +1 (extended), reflecting the resulting mild degradation of the point spread function. So as not to reject too many detections of sources that are otherwise clearly point-like, we relax the morphological constraints and accept ‘extended’ H and measurements. Instead, we inspect the images of each selected H excess emission line source by eye. An unsharp mask filter was applied to the reduced and calibrated single-band mosaics to suppress large scale low frequency features such as diffuse background, and highlight the high frequency sharp nebulous features in particular those varying on scales less than the median background filter. On this, the standard photometric aperture (of 1), and the associated background annulus of each source were marked. Any sources with non-uniform filamentary structures or nebulosity within the background annulus were excluded from further study. It is noted that previous similar work within the Lagoon Nebula has faced similar difficulties, including the slit spectroscopic work of Arias et al. (2007) where the authors were unable to subtract accurately the background emission in select cases, and in the fibre spectroscopic work of Prisinzano et al. (2007; 2012) where the authors were unable to measure accurately H equivalent widths of stellar sources due to difficulty in isolating the background nebulosity from stellar emission. In particular, the bright and complex nebulosity around the Hourglass nebula (a 2.6 2.6 region centred on RA 18h03m41s, Dec 242218) varies on scales less than a few arcsecs, and makes it extremely difficult to isolate point-source H emission. Hence, all H sources within this region were excluded. Based on the single-slit observations of Arias et al. (2007), we estimate that up to eight known accreting PMS visible in the optical may have been omitted because of removing this region.
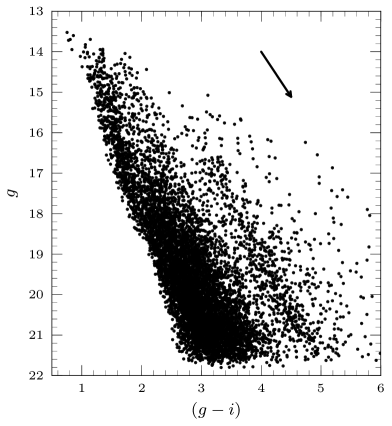
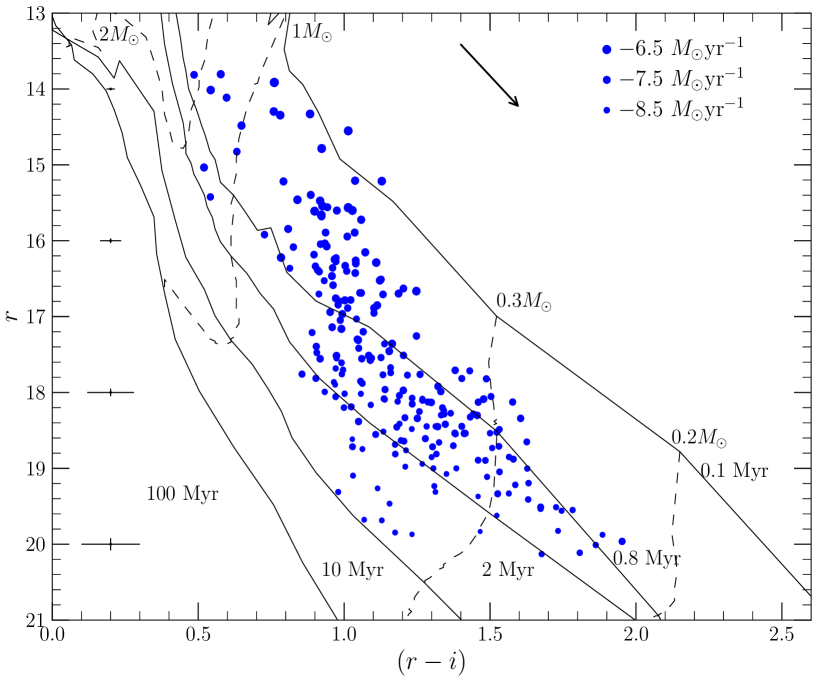
In the resulting sample, 12,384 sources have H photometry. A subset of 11,060 have -band photometry and 4,864 have -band photometry. The selected sources are shown in the () versus CMD in Fig. 2. The saturation limit of the VPHAS+ photometry ( 14 mag) means that an upper main sequence containing the bright OB stars of the Lagoon are saturated is not visible. The lack of faint background stars first remarked by Prisinzano et al. (2005) is also seen, and is interpreted as a blue envelope due to the molecular cloud preventing the detection of background stars at visible magnitudes (see Section 1). We also note a sequence of reddened late-type dwarf stars in the range (3.2 () 5) and (17 22) also found in the CMD of Sung et al. (2000) and Prisinzano et al. (2005).
3 Identifying Classical T Tauri candidates using photometric H equivalent width
The (H) colour is a measure of H line strength relative to the -band photospheric continuum. Main-sequence stars do not have H in emission. Modelling their (H) colour at each spectral type allows for a template against which any colour excess due to H emission can be measured from the observed (H) colour. The (H) colour excess (defined as (H)excess = (H)observed(H)model) can be used to compute the H equivalent width (EWHα) (see De Marchi et al. 2010).
We use the () colour as a proxy for the spectral type. This is a reasonable assumption for late spectral types (K - M6) which form the majority of our observed sample given the 1.5 mag spread in the () colour across this spectral range, and a mean () colour error due to the combination of random photometric noise and extinction uncertainty 0.15 mag. This results in the average error on the estimated spectral type caused by using the () colour as a proxy for spectral classification to be between 2-3 spectral subclasses. To calculate the main-sequence colours, Pickles (1998) spectra for O5-M6 spectral types were convolved with the appropriate filter band passes and CCD response.
In Fig. 3 the (H) vs. () diagram is plotted. The dashed line represents the interpolated model colours reddened by the mean reddening = 0.35 (see Sec. 1). At a given (), the (H)excess for each star is computed. The EWHα is given by:
| (1) |
as shown by De Marchi et al. (2010). W is the rectangular bandwidth of the H filter. The photometric EWHα for all stars having H magnitudes in our sample are measured. We validate our measured EWHα against spectroscopic measurements in Section 3.1.
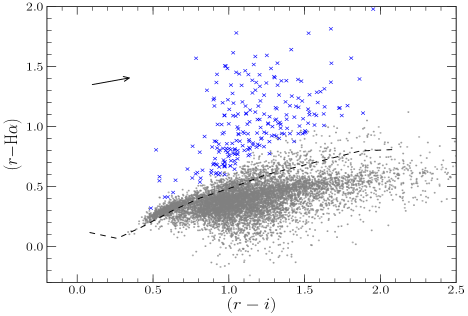
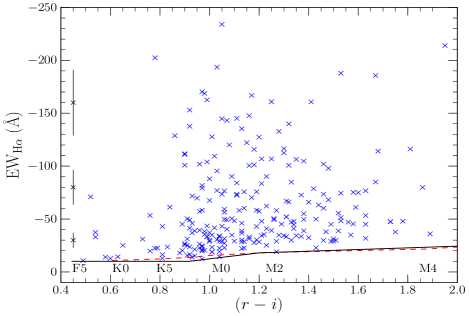
We homogeneously select CTTS from the sample of stars having measured EWHα using the spectral type-EWHα criteria of White & Basri (2003). We note that the median EWHα errors due to photometric and reddening uncertainties vary between 5 - 7 Å depending on spectral type, so we empirically adjust the selection criteria of White & Basri (2003) by the same amount. We consider CTTS as those having spectral type F5-K5 and EWHα Å, K5-K7.5 and EWHα Å and M2.5-M6 and EWHα Å. The results of our selection procedure are shown in Fig. 4. The selection criteria used are designed to exclude chromospherically active late type stars, whose maximum measured EWHα ranges from 11 Å for a M2V spectral type to 24 Å for an M6V spectral type (Barrado y Navascués & Martín, 2003). We select 235 candidate CTTS on this basis, which constitute the sample discussed in the rest of this paper. The photometric properties of the selected CTTS are given in Table 2.
| JNAME | RA | Dec | () | (H) | () | () | |
|---|---|---|---|---|---|---|---|
| (J2000) | (J2000) | (mag) | |||||
| 180232062415320 | 270.63358 | 24.25888 | 14.830.001 | 0.630.002 | 0.450.002 | ||
| 180233552414548 | 270.63977 | 24.24856 | 16.400.003 | 1.010.004 | 0.670.006 | ||
| 180233682418022 | 270.64032 | 24.30061 | 19.960.049 | 1.950.051 | 1.980.067 | ||
| 180235602413024 | 270.64832 | 24.21733 | 18.290.012 | 1.440.014 | 1.170.023 | 1.890.029 | 0.160.065 |
| 180237302416242 | 270.65543 | 24.27338 | 16.510.003 | 1.130.004 | 0.810.006 | ||
| 180238362419313 | 270.65985 | 24.32536 | 18.520.014 | 1.130.018 | 0.880.032 | 1.030.019 | 0.210.026 |
| 180238972414274 | 270.66238 | 24.24094 | 17.810.009 | 0.900.012 | 1.240.014 | ||
| 180239722419310 | 270.6655 | 24.32527 | 18.450.014 | 1.310.016 | 0.920.027 | 1.760.036 | 0.400.104 |
| 180240002419346 | 270.66666 | 24.32627 | 17.670.007 | 1.160.009 | 0.850.014 | 1.630.015 | 0.360.039 |
| 180240972412163 | 270.67072 | 24.20452 | 16.590.004 | 0.960.005 | 0.820.009 | 1.430.006 | 0.250.013 |
3.1 Comparison of photometric and spectroscopic EWHα
To test the accuracy of our photometrically determined EWHα, we compare with spectroscopically measured EWHα from Arias et al. (2007). Arias et al. (2007) obtained intermediate resolution spectra covering the H line from the Magellan telescope (Las Campanas Observatory, Chile) of 46 stars in the Lagoon Nebula. Stars were selected for observation on the basis of either H excess in H photometry from Sung et al. (2000), disc excess in near-infrared JHKs photometry, or extended or knotty morphological appearance in Hubble images. Out of the 46 stars observed by Arias et al. (2007), 37 were identified as H emission line stars. Twenty seven stars have VPHAS+ H photometry. None of the ten stars classified as H emission-line stars that are not detected in VPHAS+ H photometry have literature H photometry in ground-based imaging from Sung et al. (2000). Of the ten, six were selected on the basis of their morphological appearance in Hubble imaging by Arias et al. (2007) and cannot be resolved to point sources in VPHAS+ H imaging (ID. 3-8 inclusive in Table 2 and 3 of Arias et al. 2007; all located in the Hourglass nebula), or ground-based H imaging in Sung et al. (2000). Two are surrounded by intense nebulosity and cannot be resolved as point sources. Two sources were selected for observations by Arias et al. (2007) using near-infrared photometry and do not have resolvable optical counterparts (ID. 1, 9, 10, 11, in Table 2 and 3 of Arias et al. 2007; all located in the Hourglass Nebula). A further two stars having H photometry are saturated, and their photometric EWHα are possibly incorrect (ID. 15, 45 in Table 2-3 of Arias et al. 2007).
| ID | H | H | Sp. EWHα | EWHα | CTTS | Comment | ||
|---|---|---|---|---|---|---|---|---|
| A07/S00 | (mag) | (mag) | (Å) | (Å) | ||||
| 12/174 | 16.27 | 1.05 | 16.90 | 15.1 0.1 | 73.5 12 | N | No lit. H, near HG | |
| Does not meet photometric criteria | ||||||||
| 13/1841 | 15.66 | 1.44 | 16.53 | 2.88 | 126 9 | 138.3 30 | Y | |
| 15/2401 | 10.63 | 0.54 | 11.72 | 4.23 | 24.1 0.4 | 46.8 2 | N | Saturated, HAeBe star |
| 17/2921 | 16.25 | 0.95 | 16.84 | 4.06 | 52 3 | 58.3 11 | Y | |
| 18/388 | 15.07 | 0.57 | 16.70 | 3.8 0.2 | 12.8 2 | Y | No lit. H | |
| 19/3901 | 15.22 | 0.54 | 15.58 | 3.75 | 16 0.6 | 33.5 5 | Y | |
| 21/4181 | 14.81 | 0.6 | 16.5 | 3.98 | 5.6 0.03 | 13.4 1 | Y | |
| 22/422 | 14.78 | 0.82 | 15.53 | 27.8 0.5 | 35.8 3 | Y | No lit. H | |
| 24/4401 | 14.1 | 0.44 | 15.99 | 4.14 | 0.65 0.03 | 0.75 1 | N | Does not meet EWHα–Sp. type criteria |
| 252 | 16.47 | 0.46 | 8.1 0.3 | N | No lit. H, no H emission detected | |||
| 26/482 | 13.95 | 0.50 | 15.45 | 4.22 | 9.3 0.2 | 8.6 1 | N | Does not meet EWHα–Sp. type criteria |
| 27/4861 | 16.79 | 1.14 | 16.9 | 3.26 | 75 4 | 82 17 | Y | |
| 29/4951 | 15.89 | 0.72 | 16.73 | 3.80 | 29 1 | 22.5 4 | Y | |
| 30/5081 | 16.44 | 1.54 | 16.73 | 3.73 | 30.3 0.7 | 155.7 33 | Y | Marked as eruptive variable star |
| in Kukarkin & Kholopov (1982). | ||||||||
| 31/531 | 16.29 | 0.59 | 16.03 | 4.18 | 14.96 0.04 | 13.10 3 | Y | |
| 32/5401 | 15.56 | 0.61 | 16.17 | 4.16 | 6.7 0.4 | 10.1 2.5 | Y | |
| 33/5471 | 14.33 | 0.6 | 14.93 | 4.16 | 2.26 0.07 | 17.4 2 | Y | |
| 34/5521 | 14.55 | 0.71 | 15.39 | 3.80 | 12.8 0.3 | 49.7 7 | Y | |
| 35/6661 | 15.68 | 0.68 | 16.53 | 3.90 | 35.4 0.3 | 20.5 2 | Y | |
| 36/681 | 13.37 | 0.39 | 15.0 | 4.59 | 0.7 0.07 | N | No H emission detected | |
| 40/7261 | 16.07 | 0.8 | 16.88 | 3.91 | 48 2 | 45.9 3 | Y | |
| 412 | 13.20 | 0.35 | 3.18 0.06 | 2.09 1 | N | No lit. H | ||
| Does not meet EWHα-Sp. type criteria | ||||||||
| 42/7821 | 15.47 | 0.87 | 16.25 | 3.55 | 54.0 2 | 50 4 | Y | |
| 43/8101 | 16.29 | 2 | 16.25 | 3.96 | 20.8 0.3 | 22.3 2 | Y | |
| 44/8621 | 15.34 | 0.96 | 16.90 | 3.26 | 22.3 0.4 | 41.8 4 | N | Does not meet photometric criteria |
| Located in M8 E rim | ||||||||
| Outlier in EWHα vs. (H) | ||||||||
| diagram in Arias et al. (2007; Fig. 5) | ||||||||
| 45/8791 | 10.74 | 0.93 | 11.94 | 3.15 | 80 1 | 101.8 10 | N | Saturated, HAeBe star |
| 462 | 15.07 | 0.54 | 2.85 0.2 | 19.1 3 | N | No lit. H | ||
| Does not meet photometric criteria |
1Object selected as PMS stars with strong H emission in Sung et al. (2000); 2Object not detected in Sung et al. (2000)
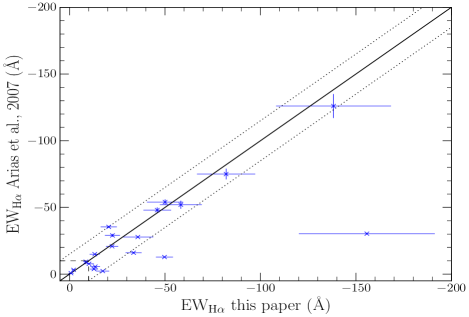
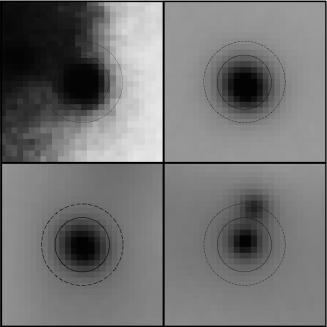
We list the spectroscopic and photometric EWHα of the remaining stars in Table 3. We stress that this comparison includes all stars having H photometry for completeness. Sources that are not selected as CTTS either because they do not meet the EWHα–spectral type selection criteria, or photometric quality checks are marked. The sample of selected CTTS does not include stars that have not met these criteria. We plot the spectroscopic and photometric EWHα of the stars meeting the quality criteria in Fig. 5. We find a good correlation between the spectroscopic and photometric EWHα for all objects with a median scatter 8 Å, approximately the error on the photometric EWHα due to the assumption of uniform extinction and random photometric noise. The errors dominate the scatter for objects meeting the quality criteria and with EWHα 10 Å, which is the minimum threshold used in this study, because small photometric or reddening uncertainties will produce relatively large errors in EWHα for stars with weak-H emission, as they lie close to the main sequence. Three CTTS show discrepant EWHα ( 2). It has been observed that the EWHα of a small fraction of accretors in a given sample can vary between 7 to 100 Å on time-scales greater than a year (Costigan et al. 2012) due to natural variations in the accretion process. This may be apt in the case of A07 30/ S00 508 (see Table 2) as it has been marked as an eruptive variable (GCVS V1780 Sgr) in Kukarkin & Kholopov (1982). Therefore, we suggest that the difference between the spectroscopic and photometric EWHα is most likely due to intrinsic accretion variability. To demonstrate that the photometric quality checks ensure that nebulous emission does not affect the measured EWHα of the selected CTTS significantly, we checked the H images of stars whose spectroscopic and photometric EWHα differ 2, showing their object and background annuli overlaid (see Section 2.1) to ascertain the absence of rapidly spatially varying nebulosity in the background annulus (Fig. 6) on scales smaller than can be corrected for. For comparison a star which is affected by such nebulosity is also displayed. Finally, although steps have been taken to ensure that the results are not affected by nebulosity, we accept that due to the difficulty of separating the strong sky nebulosity from stellar emission especially in H photometry, some residual may be present as is also the case in spectroscopic work in the region (Arias et al. 2007; Prisinzano et al. 2007; 2012). Due to the small number statistics of comparable spectroscopic EWHα, it is not possible to make a statistical statement. We therefore welcome further comparisons of the photometric EWHα with spectroscopic measurements, particularly from future large surveys such as the GAIA-ESO Survey (GES; Prisinzano et al. in prep.)
3.2 Comparison with literature H emission line star lists
We estimate the recovery rate of CTTS candidates identified using our method, and thereby the validity of our sample for a statistical analysis by comparing with all available literature optical studies of H emission line stars in the region (Sung et al. 2000; Prisinzano et al. 2007; Arias et al. 2007; Prisinzano et al. 2012). Sung et al. (2000) observed the central NGC 6530 region (a 20 square centred on RA 18h04m09s, Dec 242103) in UBVRIH in a study limited to 17 mag. They identified 37 stars from the (H )vs. () diagram as stars having (H) excess 0.36, which they classified as accreting PMS stars (CTTS).
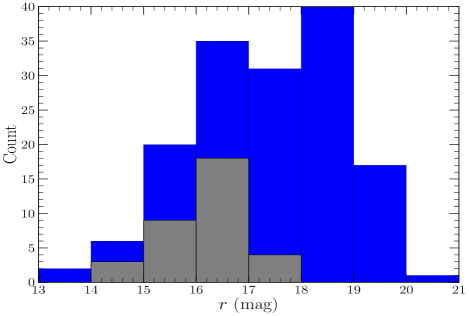
All 37 stars identified as CTTS candidates by Sung et al. (2000) have VPHAS+ photometry, although four sources are saturated and their photometric EWHα may be inaccurate. The remaining stars have photometric EWHα 8 Å indicating that they are reliably identified as emission-line stars using VPHAS+ photometry. Additionally, in the region of the sky observed by Sung et al. (2000) we identify 125 new CTTS candidates. This is roughly three times as many as identified by Sung et al. (2000). A comparison of the magnitude distribution of the two samples is plotted in Fig. 7. We converted Sung et al. (2000) magnitudes to VPHAS+ -band using the colour equations of Jester et al. (2005). A significant fraction of VPHAS+ identified CTTS candidates are located at 17 mag, beyond the limiting magnitude of Sung et al. (2000). We roughly double the number of Sung et al. (2000) CTTS candidates at 16 mag, as we can separate them from main sequence stars on the basis of their EWHα, without needing to rely on large (H) excesses.
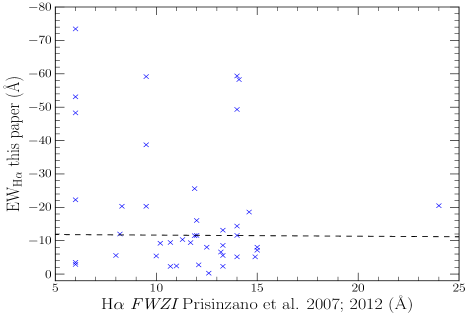
Prisinzano et al. (2007) presented H fibre spectra of 95 stars in the Lagoon Nebula, but experienced difficulty in separating the stellar H component from any nebular contamination. They do not measure stellar EWHα to classify accreting PMS stars, instead employing the Full Width Zero Intensity (FWZI) of the H line to do so. They argue that broad emission due to accretion can be separated from any narrow nebular contamination using the FWZI parameter. Prisinzano et al. (2007) classify 31 of the 95 stars for which they present H spectra as CTTS (Fig. 8) purely based on the FWZI value if the H line is in emission. 30 are identified as having H in emission in our sample, although slightly less than half are below the spectral type-EWHα selection criteria we apply to identify CTTS. We find no correlation between the H FWZI and EWHα. Prisinzano et al. (2012) used new H multi-slit observations to add a further 16 accreting stars to the sample of Prisinzano et al. (2007), which are also shown in Fig. 8. All of these stars have H in emission, but around a third of the sample fall below the spectral type-EWHα selection criteria. In short, our method can reliably identify H emission in all stars that have been previously classified as H emission-line stars using spectra. We stress that although the FWZI of the H line is a good identifier of accretion, but may not be an accurate measure of the accretion rate in CTTS (White & Basri 2003; Costigan et al. 2014).
The comparison of our sample with literature H emission line star lists suggest that all known CTTS sources within the VPHAS+ dynamic range can be reliably recovered. We identify a total of 235 CTTS candidates over our area of study, which contains at least 170 new accreting sources that represent 200 per cent increase in known CTTS stars within the region. The area covered by this study is significantly larger (around 3.5 times) than previous photometric searches for PMS stars in the Lagoon Nebula (see Tothill et al. 2008 for a summary). We conclude that the uniform expansive sky coverage, and photometric depth afforded by the VPHAS+ survey can homogeneously identify a substantial number of CTTS candidates; and the photometric method estimates the EWHα accurately in comparison with intermediate-resolution spectroscopy.
4 Results
In the current accretion paradigm, it is assumed that the stellar magnetosphere truncates the circumstellar disc at an inner radius (Hartmann 1994; Muzerolle, Calvet & Hartmann 1998). Gas flows along the magnetic field lines at this truncation radius, releasing energy when impacting on the star. It is generally accepted that the accretion energy goes towards heating and ionising the gas, and that the accretion luminosity () can be measured from the reradiated emission line luminosity (Calvet & Gullbring 1998; Hartmann 2008). The can then be estimated from the free-fall equation:
| (2) |
and are the stellar mass and radius respectively. is the truncation radius.
In this Section, we estimate the stellar and accretion properties of our candidate CTTS based on the magnetosphere accretion paradigm. In Section 4.1 we estimate their stellar masses and ages. We estimate their based on their EWHα in Section 4.2 and -band excess in Section 4.3. We discuss their near-infrared properties in Section 4.4. The caveats, completeness and contamination of our sample are discussed in Sections 4.5-4.8.
4.1 Stellar properties
4.1.1 Mass and age
The mass () and age () of each star is estimated by interpolating its position in the observed versus CMD with respect to PMS tracks and isochrones (Fig. 9). Siess, Dufour & Forestini (2000) solar metallicity single star isochrones and tracks were employed as they cover the mass and age range of our sample. The isochrones were reddened assuming the mean reddening = 0.35 following a reddening law = 3.1 (see Section 1). The systematic differences that would arise on adopting different stellar models are discussed in Section 4.6.1. The tracks and isochrones were converted from the luminosity- temperature plane to the colour-magnitude plane using the colour equations of Jester et al. (2005).
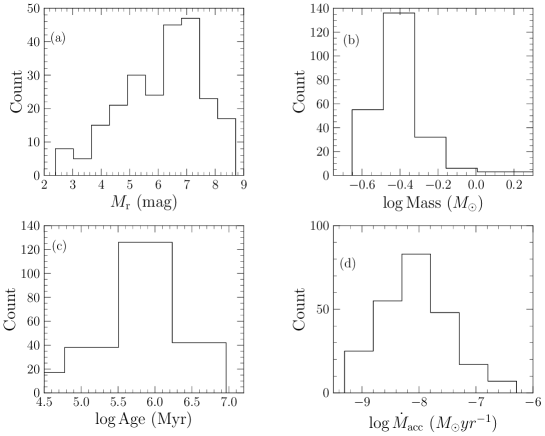
Fig. 10(a) shows the luminosity function of our sample. The interpolated mass distribution of our candidate CTTS is plotted in Fig. 10(b). All our candidate CTTS have masses between 0.2 - 2.2 . The mass distribution shows the expected increase towards lower masses, peaking at 0.35 . The mass cut-off and steady decline in sub-solar mass below 0.3 is expected because of the limiting magnitude.
The ages of stars in our sample range between 0 - 9 Myr, with 95 per cent of stars having an age less than 2 Myr (Fig. 10 b). Few stars fall beyond the 30000 yr isochrone. For these stars, age estimates represent an upper limit. The median age of our sample is 0.85 0.6 Myr. This agrees with the main-sequence lifetime of the early-type stars found in the region (Tothill et al., 2008). In particular, 9Sgr (O4 V; Walborn 1973) and H36 (O7V; van Altena & Jones 1972) are two prominent O-type members still lying on the zero-age main sequence (ZAMS), and are expected to evolve off the ZAMS after 1-3 Myr. Chen et al. (2007) measured an intrinsic velocity dispersion of 8 km s-1. Assuming this as an expansion velocity, Tothill (2008) calculated a dynamical age of 1 Myr. Furthermore, the age of the PMS stars that have X-ray emission (Damiani et al. 2004) or H emission (Sung et al. 2000; Arias et al. 2007) are estimated to be around 1 Myr.
We caution the reader that higher mean age estimates ( 2 Myr) for the general population of stars in the Lagoon Nebula have been measured in the literature. In particular, Walker (1957) and van Alten & Jones (1972) suggest an age estimate 3 Myr, although both of these studies only fit a ZAMS and use a distance modulus of around 11.5 mag. Recent works by Mayne et al. (2007) and Mayne & Naylor (2008) use the CMD diagram to build a relative age ladder, and obtain an age of 2 Myr. Also, van den Ancker et al. (1997) find a highly probable member with an age of 15 Myr and suggest a prolonged period of star formation taking place within the Lagoon Nebula. The evidence for this remains unclear. The study by Prisinzano et al. (2005) discussed the possibility of an age spread, by comparing their optical sample with the X-ray identified PMS stars of Damiani et al. (2004). They find a median age of 2 Myr using their optical sample, with the older stars preferentially located to the northeast, and younger stars located to the south and west. In our sample, higher or lower ages may be estimated for a few stars because the assumption of uniform distance or extinction may be inappropriate, or because they are non-members and not representative of the age of the sample. Since our study is limited to an assumption of uniform extinction and no strict membership tests barring the EWHα criteria, we cannot differentiate between ages that are incorrect due to these effects or genuinely older. Therefore, we cannot confirm or rule out the presence of a true age spread, and further data on cluster membership is required to explore this possibility.
Finally, we stress that the precise ages of individual stars derived using isochrones may be uncertain, as most of our stars are around one million years old. At this point in a star’s evolution, age determinations using stellar isochrones are imprecise because the age is thought to be still dependant on the accretion history and stellar birthline corrections. However, the median age of the CTTS population ( 1 Myr) is relatively accurate given large number statistics, and the fact our result agrees well with age estimations based on the expansion velocity (Chen et al. 2007) main-sequence lifetime of OB stars, and literature age estimations of the pre-main sequence population (Sung et al. 2000; Damiani et al. 2004; Arias et al. 2007).
4.2 Accretion properties
4.2.1 H line luminosity
The H line flux () is calculated by subtracting the stellar continuum flux () from the total flux in the H band (). The total H flux () is given by the unreddened H magnitude () according to the relation,
| (3) |
is the unreddened H magnitude. is the band-integrated reference flux. For the VPHAS+ filter, =1.84 ergs . is a sum of the continuum () and line flux ().
| (4) |
Following from equation 1, equation 4 can be written as
| (5) |
The line luminosity is given by :
| (6) |
Here the distance = 1250 50 pc. Contamination from N[II] 6548, 6584 is excluded by assuming it causes 2.4 per cent of the H intensity (De Marchi et al., 2010).
4.2.2 Accretion luminosity ()
Measurements of from UV continuum spectral modelling in the literature (Sicilia-Aguilar, Henning & Hartmann 2010; Herczeg & Hillenbrand 2008; Dahm 2008; Hartigan & Kenyon 2003) were plotted against by Barentsen et al. (2011). A power law relationship, was found, having an index = 1.13, consistent with the accretion models of Muzerolle et al. (1998). Based on results of Barentsen et al. (2011), we assume:
| (7) |
and are measured in units of solar luminosity, . The root mean scatter = 0.54. The scatter in the observed relationship is likely caused by a combination of circumstellar absorption, uncertain extinction and line emission caused by processes other than accretion.
4.2.3 Mass accretion rate
are estimated from Equation 2. We adopt = 5 2 from (Gullbring et al. 1998; Vink et al. 2005). The resultant distribution of mass accretion rates are plotted in Fig. 10(d). The median is 10-8.1 . Our results are given in Table 4.
4.3 Comparison between -band and H mass accretion rates
91 candidate CTTS have photometry from the blue data set meeting our selection criteria. Four stars do not show any measurable -excess in the () vs. () diagram, and have EWHα 20 Å. We discuss them in more detail in Section 4.8. For the remaining stars, we measure from the excess ultraviolet emission (Gullbring et al., 1998).
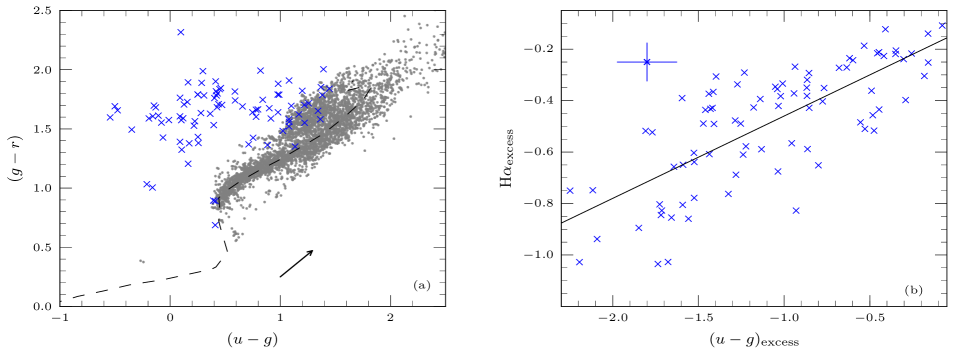
Similar to the method described in Section 3, the colour is used to estimate spectral type, while the colour is the measure of UV-excess due to the accretion process. The UV-excess stars are shown in Fig. 11(a). The excess flux in the -band () is:
| (8) |
is the -band integrated reference flux. and are the observed dereddened magnitudes, and is the corresponding model colour from Castelli & Kurucz (2004). The excess flux is used to estimate the using the empirical relation (Gullbring et al., 1998);
| (9) |
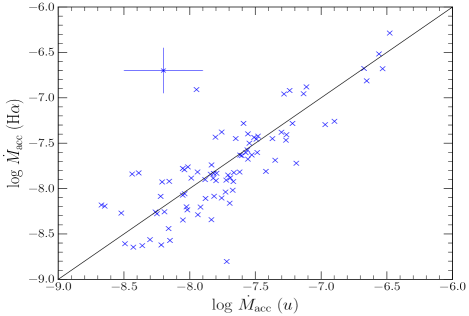
is the -band excess luminosity. and are in units of solar luminosity . Mass accretion rates are calculated using Eq. 2, with results given alongside H derived in Table 4. The are compared with the H in Fig. 11(b), and thus determined are compared with the ones determined from the H-line luminosity in Fig. 12.
The and H, two independent (except for the assumed extinction value) measures of accretion correlate well. We find the best fit relation to follow H = 0.3 0.14 (Fig. 11b). There are only six low accretion rate objects (log 8.5) detected in the u-band, that are detected in H (Fig. 10d). This is due to the faint magnitude limit in 19 mag, thereby excluding the low-mass stars detected in H. The logarithm of the mass accretion rates determined from the H-line luminosity and -band excess luminosity have a mean variation (R.M.S. scatter) of 0.17 dex. There exist a minority of CTTS candidates (four) which have differences in log 0.8 dex. Since the observations are non-contemporaneous, the should display intrinsic variabilities over long time-scales with maximum variations in log expected to be 0.52 dex (Costigan et al., 2012).
This result indicates no significant statistical effect of accretion variability on the sample as a whole. However, accurate band photometry of low-mass stars is comparatively more challenging to obtain. Therefore H photometry is better suited to provide statistically significant samples of .
| JNAME | EW | Mass | Log Age | ||
|---|---|---|---|---|---|
| (Å) | () | yr | () | () | |
| 180232062415320 | 14.342.66 | 1.00.00 | 5.60.08 | 7.70.6 | |
| 180233552414548 | 18.903.27 | 0.40.01 | 4.70.19 | 7.90.6 | |
| 180233682418022 | 213.9636.9 | 0.20.20 | 5.52.54 | 8.00.6 | |
| 180235602413024 | 63.1610.8 | 0.30.05 | 5.40.69 | 8.10.6 | 7.80.7 |
| 180237302416242 | 28.395.15 | 0.40.01 | 4.60.20 | 7.60.6 | |
| 180238362419313 | 36.714.95 | 0.40.06 | 6.20.85 | 8.80.6 | 7.70.7 |
| 180238972414274 | 110.9921.0 | 0.50.04 | 6.30.54 | 8.10.6 | |
| 180239722419310 | 33.254.58 | 0.30.06 | 5.60.77 | 8.60.6 | 8.20.7 |
| 180240002419346 | 31.365.14 | 0.40.03 | 4.70.43 | 8.30.6 | 7.90.7 |
| 180240972412163 | 39.457.23 | 0.50.01 | 5.70.23 | 7.70.6 | 7.20.7 |
4.4 Infrared properties
A simple sanity check on the validity of the identified CTTS can be made by studying their near-infrared properties. This is because CTTS display near-infrared excesses when compared to a purely stellar template due to the presence of dust in their inner circumstellar discs (Cohen & Kuhi, 1979).
Near-infrared JHK photometry in the Lagoon Nebula from the UKIRT Infrared Deep Sky Survey (UKIDSS) Galactic Plane survey (Lucas et al. 2008) was cross-matched with the positions of the CTTS in our sample. Only cross-matches having random error 0.1 mag in JHK, and classified as having a stellar profile in the UKIDSS catalogue were selected. UKIDSS reaches a depth of 5 at 19 mag, which translates to roughly a star of spectral type M6 in the Lagoon Nebula, suggesting that most of the stars in our sample should be identifiable in the UKIDSS survey. 224 (95 per cent) stars in our sample were found to have UKIDSS cross-matches.
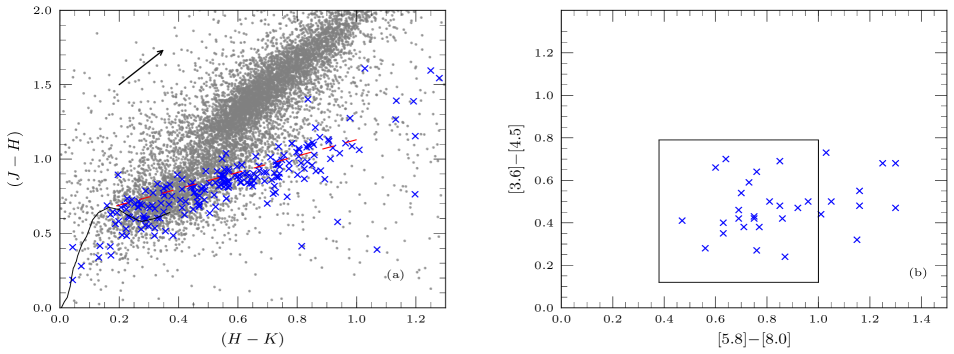
In Fig. 13(a), the () vs. () colour-colour diagram of stars located in the Lagoon nebula is plotted. Also shown are near-infrared counterparts of cross-matched candidate CTTS. The dashed line is the CTTS locus of Meyer, Calvet & Hillenbrand (1997) which predicts the excess emission using disc accretion models having log between 6 to . The solid line is the main sequence locus from Bessell, Castelli & Plez (1998). Most stars ( 85 per cent) having near-infrared colours in our sample lie on the CTTS locus, suggesting on the basis of the near-infrared diagram alone that they are CTTS. This confirms our sample as consisting primarily of CTTS undergoing accretion. Around 35 stars lie near the main sequence locus, indicating that they are either weak-line T Tauri stars, or have no excess infrared emission suggestive of a circumstellar disc. Three of the stars lying below the main sequence spur are the stars that showed no -excess. We discuss them further in Section 4.8.
We also cross-matched our sample with mid-infrared Spitzer data (Kumar & Anandarao, 2010). 32 cross-matches were found. In Fig. 13(b), the 3.6 4.5 vs. 5.8 8 colour-colour diagram is plotted. The solid box represents the typical colours for PMS stars having mean = (D’Alessio et al., 2001). Most of the cross-matched CTTS candidates in our sample lie in this box, providing an additional sanity check on the results. Six stars lie at a 5.8 -8 colour much brighter than maximum expected colour. Their accretion rates are approximately a magnitude higher than the model at .
4.5 Random errors
The random errors affecting the determined parameters are (i) random photometric noise (ii) scatter in the extinctions of individual stars compared to the adopted uniform value (iii) scatter in the distances of individual stars compared to the adopted uniform value (iv) scatter in the - relation (Eq. 7).
The errors due to random photometric noise are propagated through the results. The true extinction for some stars may vary from the assumed uniform extinction. To calculate the errors arising due to the assumption of uniform extinction, we assume = 0.2 from Section 1. The true distance for some stars may vary from the assumed distance. To account for the error due to the uncertainty in the distance, we assume a = 50 pc. 50 pc is the width of the region at the assumed distance. The RMS scatter of 0.54 in the - relation was used to calculate errors arising due to the deviation from this relationship for individual objects.
The mean errors () determined are listed in Table 5. We find that our EWHα is accurate within 7 Å while taking into account random photometric and extinction uncertainties. The stellar mass and age are constrained to 0.08 and 0.6 Myr respectively accounting for random photometric, extinction and distance uncertainties. The error on is dominated by the scatter in the - relation.
| Parameter | Median | Range | |
|---|---|---|---|
| EWHα (Å) | 47.0 | 11 to 234 | 7.0 |
| Mass () | 0.4 | 0.2 to 2.2 | 0.07 |
| Age (Myr) | 0.85 | 0.1 to 9 | 0.6 |
| log () | 8.1 | 6.3 to 9.4 | 0.6 |
4.6 Caveats
We discuss the differences in our results arising from adopting different stellar evolutionary models, and the effect of setting the binary fraction to zero.
4.6.1 Stellar evolutionary models
The mass and radius used to calculate the mass accretion rates, and the age of the CTTS are determined from interpolating their position in the CMD relative to stellar model tracks and isochrones. Apart from differences due to individual uncertainties in a star’s photometry or extinction, the model tracks and isochrones also differ between various authors. This is because of differences in the input physics, in particular the treatment of the birthline, accretion history and the deuterium burning phase. Moreover, the conversion of luminosity to magnitude based on bolometric corrections, and the colour-temperature conversions are highly non-linear, especially for late-type stars, leading to slight differences.
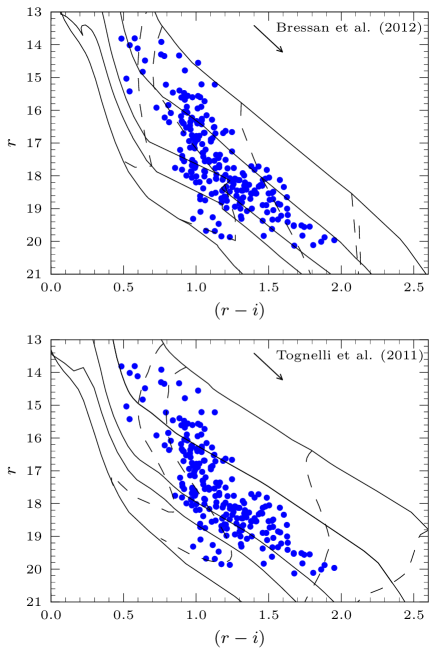
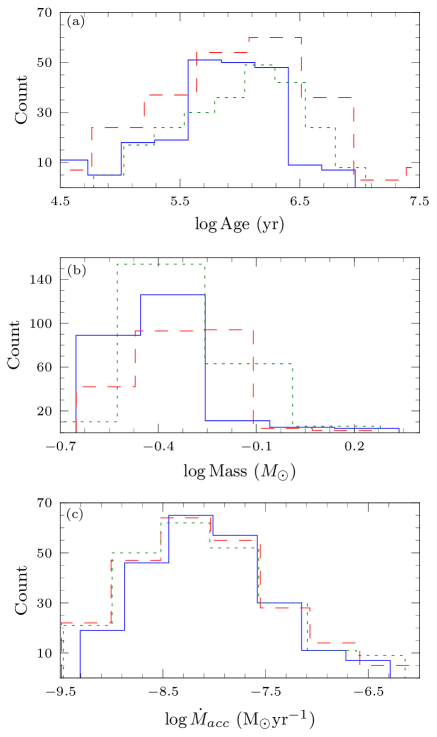
To estimate the uncertainties in the measured properties due to differences between model isochrones and tracks we compare the stellar masses, and ages derived from the Siess et al. (2000) stellar models with the PMS models of Tognelli, Prada Moroni & Degl’Innocenti (2011) and Bressan et al. (2012). In Fig. 14, we plot the vs. () CMD of CTTS overlaid with each of the stellar models. We also plot the histograms (Fig. 15) showing the estimated distributions of stellar masses and ages interpolated from each of the models compared to the distributions estimated from the Siess et al. (2000) models.
We find that the median age of our sample determined using Tognelli et al. (2011) isochrones is 1 Myr and Bressan et al. (2012) isochrones 0.9 Myr. The distribution of stellar ages derived using the Siess et al. (2000) and Tognelli et al. (2011) isochrones are similar, but there is a larger number of CTTS having ages 2 Myr according to the Bressan et al. (2012) isochrones, i.e. evidence for an age spread. This result is similar to that of Sung et al. (2000), where the authors found age spreads ranging between 2 to 5 Myr using different stellar isochrones. We also point out that the spacing between isochrones decreases from 0.5 mag in colour for ages 0.1 - 2 Myr to less than 0.5 mag between 2 - 10 Myr. Small differences in the conversion from the theoretical to the observational plane of the Hertzsprung-Russell diagram may lead to differences in the precision of the interpolated ages. The turnover of the masses determined using the Siess et al. (2000) tracks ( = 0.35 ) is slightly lower than those of Tognelli et al. (2011) and Bressan et al. (2012) at 0.4 . In the distribution of Bressan et al. (2012) masses, there is a long tail towards the higher masses. Sung et al. (2000) also report differences in the estimated masses of Lagoon Nebula PMS stars when using different stellar tracks. Finally, we plot the distribution of calculated using the stellar masses and radii estimated from the different stellar models (Fig. 15c). We find that our median log determined using Bressan et al. (2012) and Tognelli et al. (2011) are smaller by 0.05 dex compared to the Siess et al. (2000) median of log = 8.1 . There is a tail of lower sources found using the Tognelli et al. (2011) and Bressan et al. (2012) models, absent in the distribution of Siess et al. (2000) . The estimates are less sensitive to the stellar models.
Finally, we note that a significant fraction of stars with stellar masses 0.6 (or 16.8) in Fig. 9 have comparatively younger ages ( 0.8 Myr) than stars having 0.2 0.6 , the bulk of whose ages lie between 0.8 - 2 Myr according to the Siess et al. (2000) isochrones. The location of these stars is similar when compared to the Tognelli et al. (2011) and Bressan et al. (2012) PMS models (Fig. 15). It is possible that a bulk of these stars could be foreground reddened late-type stars. However, all stars having -band photometry (53 per cent of the total sample) have demonstrable -band excesses, and 86 per cent lie near the CTTS locus in the near-infrared colour-colour diagram. Evidence of multiple accretion signatures suggests that the number of contaminants in this sample is low. Another observational effect is that in the adopted EWHα-spectral type selection criterion, stars spanning F5-M2 spectral types are selected as CTTS if they have EWHα between 10-12 Å. More massive stars have greater luminosities at similar EWHα leading to systematically higher H luminosities and thereby accretion rates at higher masses. But, in Section 5 our detection limits calculated based on the EWHα-spectral type selection criterion and stellar parameters from a 1 Myr isochrone indicate that the lack of low accretion rates at 0.6 is not likely to be due to the EWHα-spectral type criterion. When compared to other CMD of the Lagoon Nebula across a similar mass range, we note a very similar split sequence in age at 0.6 in the theoretical colour-magnitude diagram of Sung et al. (2000; Fig. 9a in that Paper), and a not as prominent effect at 0.8 in the CMD of Prisinzano et al. (2005; Fig. 7 in that paper). Isochrones fitted to open cluster may yield good fits to one section of the CMD, but may systematically deviate from the observed sequence in another section in some cases (Bonatto, Bica & Girardi 2004; Mayne et al. 2007). Lastly, it is possible that the comparatively more massive stars may have been formed later than the less massive stars, and the observed difference in ages is real. Further information on membership is required to differentiate the two effects.
4.6.2 Bias due to unresolved binaries
Due to the unknown dependence of accretion properties on binarity, it is not possible to design a correction for the brightening effect of unresolved/unidentified binaries. We do not apply any corrections due to this effect.
The angular resolution of our observations (0.5) implies a resolution of 625 AU at the distance to the Lagoon Nebula. Our observations are unable to rule out the presence of binaries having separations less than this distance. The effect of undetected binaries in our sample may be understood if we consider the change in the properties of the star if it is physically an equal mass binary system. There is no colour change, while all its magnitudes are 0.75 mag brighter. This effect is similar to shifting the model tracks to account for differences between different stellar evolutionary models.
However, estimating the number of possible binary contaminants in our sample is difficult as previous studies of T Tauri binaries have been inconclusive. Bouwman et al. (2006) suggest that close binaries may lose their discs significantly faster based on mid-infrared observations, meaning that most disc bearing CTTS are not generally found in close binaries. Daemgen et al. (2013) resolved the components of 19 T Tauri binaries in Chameleon I. The authors found that estimates only for the closest binaries ( 25 AU) were significantly affected.
4.7 Completeness of our CTTS sample
The completeness limit of the photometry is estimated from the peak magnitude of the luminosity function. We find that peak magnitudes are approximately 19.8, 18.8 and 19.4 mag in , , and H respectively. Using the reddening and distance corrections of Section 4.1, this translates to a limit of about 0.3 in the versus () CMD. This limit can be seen in the histogram of derived masses (Fig. 10b).
In reality, the completeness of the final sample of CTTS is also affected by the EWHα selection criterion. The EWHα selection criterion is designed to exclude interloping chromospherically active late-type stars. As a result, the EWHα selection threshold is larger than the lower limit of EWHα in CTTS (see Sec. 3 and White & Basri 2003). To estimate the number of CTTS missed due to our adopted selection threshold, we must first estimate the total number of Lagoon Nebula members in the mass range we observe, and then estimate how many of them are accreting, i.e. CTTS.
The total number of stars in the mass range we observe (0.2 - 2.2 ) can be estimated from the initial mass function, provided the slope, maximum stellar mass and total cluster mass of region is known. We adopt the results of Prisinzano et al. (2005), where the authors find a power law index of 1.220.17, and a total cluster mass of 930 . The maximum known stellar mass in the region is 20 (Weidner & Kroupa, 2006). Based on these results, we estimate that 560, 260, and 40 Lagoon nebula members are present in the 0.2-0.4 , 0.4-1 , 1-2 mass ranges respectively. Prisinzano et al. (2007) find that around 40 per cent of member stars in the Lagoon Nebula are actively accreting at a given time, i.e. are expected to be identifiable as CTTS. Combining these results with the estimated number of members, we can estimate the total number of CTTS in the Lagoon Nebula. Comparing this estimated number with our sample, we find that our sample is complete up to 60, 90 and 50 per cent in the 0.2-0.4 , 0.4-1 , 1-2 ranges respectively.
4.8 Contaminants in our CTTS sample
The positions of the H identified sample of CTTS in the near-infrared and () vs. () colour diagrams concur with the expected positions of CTTS. The measured from H agrees well with those measured using -band photometry. No stars in our sample have positions beyond the 10 Myr isochrones, with an overwhelming majority falling around the 1 Myr isochrone suggesting that background/foreground contamination in our sample is small. This fact, along with the multiple signatures of disc accretion are highly suggestive that the vast majority of our candidate CTTS are genuinely accreting. Moreover, the EWHα criterion is designed to exclude the expected interlopers such as late type stars whose EWHα is due to chromospheric activity. However, we do not explicitly select for cluster membership (using for example proper motions). There are only four stars (out of 91) that are accreting in the () vs. (H) diagram and not accreting in the () vs. () diagram. Neglecting that such a change is due to accretion variability it is possible that these stars may be foreground unreddened late-type stars. Due to the nebulosity, background stars are not expected to be found (see Section 1).
If we assume that the fraction of H emission stars not showing any -band excess are field stars, then our contamination rate is 5 per cent. The fact that these stars may not be accreting is strengthened by the fact that most of these stars do not show atypical near-infrared excess. Note that there is no preferential spatial location for these stars. On the other hand, if we take the number of stars falling at the MS locus in the near-infrared to be contaminants, then our contamination rate 15 per cent. However, a few stars that posses discs and are still accreting may not show infrared excesses due to variations in inclination angles (Meyer et al. 1997), or because they might be accreting from a debris disc. Moreover, it is difficult to differentiate CTTS using near-infrared colours alone, as the median () colour disc excess from the UKIDSS survey in the near-infrared is only slightly larger than atypical main sequence colours (Lucas et al. 2008). In reality, our contamination rate is most likely somewhere in between 5 - 15 per cent, and the total number of contaminants is expected to be around 10-30 per cent.
Our estimations suggest that our sample is clean, and complete to a sufficient degree to estimate the statistical properties of the PMS stars within the Lagoon Nebula.
5 as a function of stellar mass
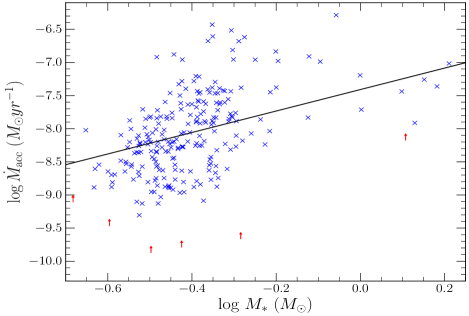
The rate is plotted as a function of in Fig. 16. We employed survival analysis linear regression using ASURV (Lavalley et al., 1992) to account for the lower detection limits in fitting a power law function over the entire mass range. The lower limit of non-detections is calculated adopting the EWHα selection criterion for all points on an 1 Myr isochrone. We found the best-fit power law index = 2.14 0.3. Not including the lower limits lead to slightly steeper slope. This strong dependence is well documented in a few star forming regions over a wide range of masses (0.1-3 ; see Muzerolle et al. 2003; Natta et al. 2006). The median 1.8-2.2 (Hartmann et al., 2006), although much steeper (Fang et al., 2009) or shallower values (Barentsen et al., 2011) have also been found.
It is important to consider the observational selection effects that may affect the observed relation (Clarke & Pringle, 2006; Da Rio et al., 2014). The lack of T Tauri candidates at the lower mass end in Fig. 16 is due to the data reaching the detection limit, but we should be able to detect more CTTS at 0.5 with lower . Stars with 0.5 are typically a magnitude brighter than the faint limit. Their paucity cannot be explained by the observational selection limits. Similarly, it has been suggested that the upper envelope of accretion rates at any given mass is claimed to be due to the difficulty of detecting stars with (Clarke & Pringle, 2006). However, such continuum stars constitute only a small fraction of the known population of PMS stars (Hartmann 2008). A small fraction of high across the mass range will bias the observed relations, but cannot explain it. Therefore, observational limits can bias the observed relation, but cannot easily explain it.
Overall, there exists a spread greater than an order of magnitude in accretion rates at any given mass in Fig. 16. In Fig. 12, the accretion rates of 87 CTTS from the u and H excess emission have a mean difference 0.17 dex, much smaller than the spread in accretion rates. There are more likely other intrinsic factors besides stellar mass controlling accretion rates. Due to the ages of individual stars being uncertain, we do not examine the variation of as a function of individual stellar ages.
6 Spatial distribution of CTTS candidates
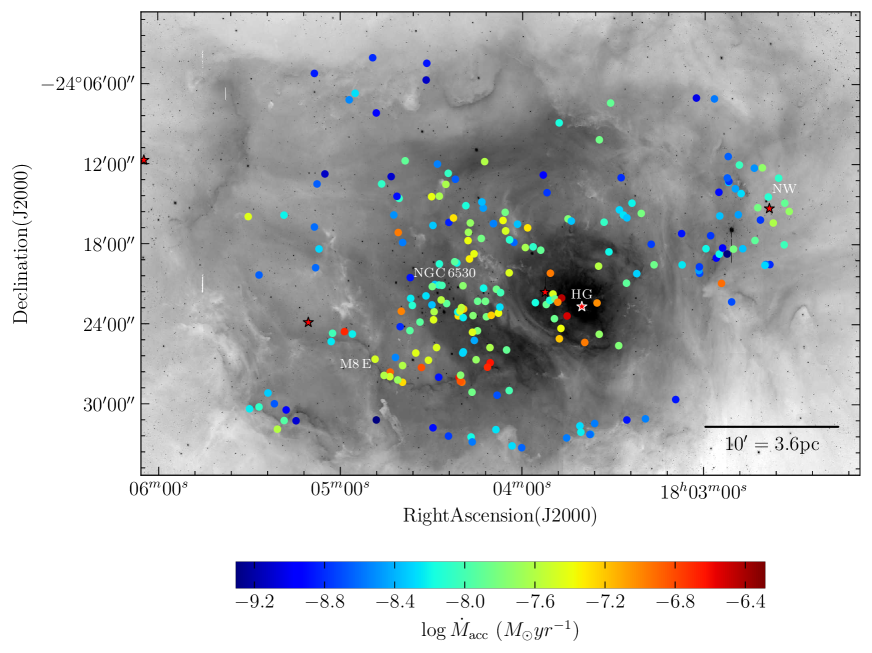
Fig. 17 shows the spatial distribution of CTTS candidates. Known O-type stars in the field are also shown. CTTS candidates are concentrated in multiple sub-clusters (having density 10 stars pc-2) in four regions:
-
1.
in the southern bright rim M8 E. Tothill et al. (2002) identified several gas clumps within this region. A Herbig-Haro object has also been reportedly found by Arias et al. (2006). The O6 Ve star HD 165052, which is a confirmed member of the Lagoon nebula (Tothill et al., 2002) lies at the eastern edge of the rim.
-
2.
the embedded central cluster NGC 6530, which has a significant number of CTTS located to its immediate north.
-
3.
the Hourglass nebula region (marked as HG in 17), and a region to its north east. It contains at least two O-type members, the O4 V star 9 Sgr, and the O7 V star H 36 which are thought to be the chiefly responsible for ionising the Lagoon and Hourglass nebula respectively. 9 Sgr has 10 CTTS identified within a 1 pc radius. The number of CTTS surrounding H 36 is thought to be similar (see Arias et al. 2006), but cannot be confirmed in our study due to the difficulty in subtracting the highly variable background around H 36. Both White et al. (1997) and Tothill et al. (2002) report a significant amount of molecular gas (10-30 ) still shielding H 36, forming a compact H II region inside the molecular cloud.
-
4.
a north-western region (marked as NW in 17) at the edge of the visible nebulosity, surrounding the O9 star HD 164536, which is not a confirmed member. This region has received comparably little interest in previous studies of the Lagoon Nebula, owing to the brighter core, where star formation appears to be most active.
A small fraction ( 6 %) of relatively more isolated stars are situated along the edges of the Lagoon Nebula, wherein some cases the nearest CTTS candidate is located at distances 1 pc. The overall morphology of our sample is indicative of a continuum ranging from dense clustering to comparative isolation. This is similar to results in nearby star-forming regions (Allen et al., 2007). Our spatial over densities of CTTS candidates are very similar to those found by Kuhn et al. (2014).
6.1 Distribution of accretion rates
It is interesting to see whether the spatial morphology of CTTS candidates is reflected in the distribution of accretion rates, and if any inference of how star formation has proceeded can be drawn from it. Lada et al. (1976) proposed star formation proceeded east to west through time beginning in NGC 6530 which triggered star formation in the Hourglass nebula. Lightfoot et al. (1984) put forth a similar scenario, where star formation was triggered by the NGC 6530 cluster in the Hourglass nebula region, and cite the presence of peripheral O stars in the Lagoon nebula as evidence for a younger population. Alternatively, Damiani et al. (2004); Prisinzano et al. (2005) and Prisinzano et al. (2012) suggested that star formation progressed from the north to the south, and the north-eastern CTTS were formed initially and have currently shredded their molecular gas, and star formation proceeded towards the west and south-west. Arias et al. (2007) reported that the ages of CTTS decreased from the north to the south. Tothill et al. (2008) consider these results, and suggest that star formation may have proceeded outwards from the core, evidenced by age gradients found by Damiani et al. (2004) and Arias et al. (2007), and the young sources around the dense molecular cloud cores at the edges of the nebula.
To investigate such scenarios, a 2D histogram of accretion rates covering the entire mass range, and restricted to the 0.35 0.6 are shown in Fig. 18. The colour is representative of the median accretion rate of all the stars situated in a 0.5 pc2 box. The diffuse H contours, which outline the nebular emission are also shown. The distribution of the accretion rates is considered to be due to the star formation history of the Lagoon nebula. Younger stars with higher accretion rates are thought to be located closer to their birth locations, while older accreting CTTS may have had time to dynamically evolve and move away from their natal molecular cloud which is thought to be reflected by larger spacing between them, and lower accretion rates. However, the accretion rate also depends steeply on stellar mass (see Fig. 16), which is why we corroborate our map covering the entire observed stellar mass range with one restricted to 0.35 - 0.6 CTTS, which includes 135 candidates. Based on the best-fit from Fig. 16, stellar mass affects the by 0.4 dex in this range, so any larger variations of are likely reflective of dependences on stellar ages. Therefore, the distribution of accretion rates can be an indicator of the star formation history within the region, and also reflective of any intrinsic age spread.
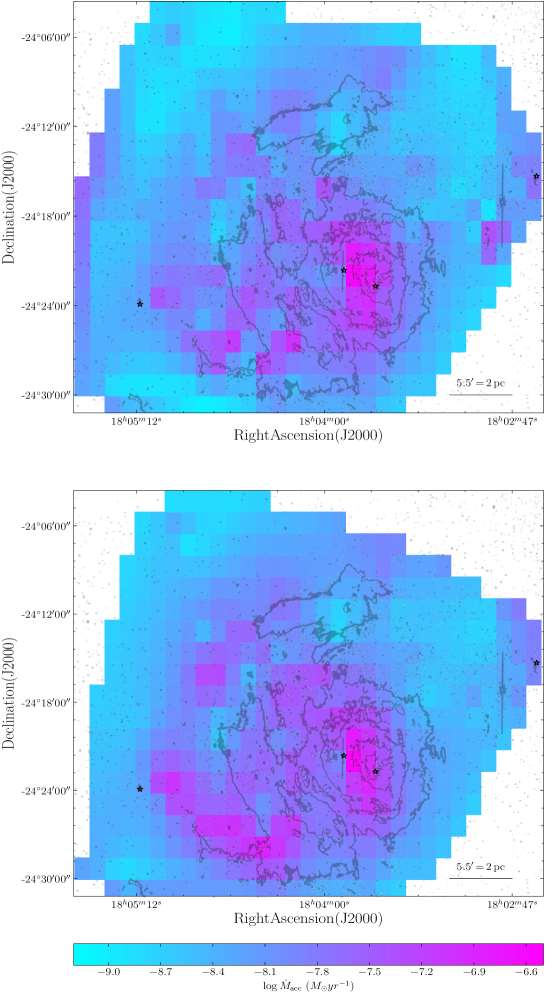
In Fig. 18, we find that the median accretion rates are highest in the M8 E and Hourglass region (7.2 yr-1), and decrease non-uniformly towards the edges of the nebula. The accretion rate of the central embedded cluster NGC 6530 is between 7.5 to 8.2 yr-1, and the north-western region fractionally lower ranging between 7.8 to 8.2 yr-1.
Our results do not corroborate completely with any single sequential star formation scenario proposed in the literature. If, we consider star formation to have proceeded east to west as described by Lada et al. (1976), why are the median accretion rates in the south-eastern rim so high? Also, the region is known to contain at least one Herbig-Haro object (see Tothill et al. 2008), and dense CO clumps suggesting youth, if not younger then at least similar to the age of the Hourglass nebula region. Alternatively, if accretion proceeded north to south as suggested by Prisinzano et al. (2005; 2012), the median accretion rate of the north-western region is comparable to the central NGC 6530 cluster located to its south. The north-western region has not been as comprehensively studied as the central Nebula, but Kumar & Anandarao (2010) identify six Class I objects using Spitzer infrared observations near the O-type star HD 164536, and comparable to the number density of Class I objects found in the NGC 6530 cluster. This gives weight to Fig. 18 that accretion in the north-eastern edge of the Lagoon Nebula is proceeding at rates fractionally lower to the central cluster. Alternatively, if star formation proceeded outwards from the core of NGC 6530 as suggested by Tothill et al. (2008) why are older stars found towards the northern, and eastern edges, but not in the southern and western edges? It is possible that low CTTS in regions of comparatively higher values of extinction are not detected in the study, which could lead to observed spatial dependencies. But the overall spread in measured extinction values within the region is small ( 0.5 mag, see Section 1). In our mass restricted map, we find similar dependencies even though the imposed limit of 0.35 places any star with extinction 2 mag within our detection limits. Both these considerations suggest that differential extinction is unlikely to bias our results significantly. Our results lead us to suggest that a simple sequential star formation process may be too simplistic to apply throughout the Lagoon Nebula, although there is evidence that some regions of the Lagoon nebula may be older than others. Such a conclusion was discussed briefly in Getman et al. (2014) in their multi-region study conducted using archive infrared and X-ray data. Instead, the distribution of accretion rates may be reflective of the clumped nature of the collapsing natal molecular cloud and the proximity of ionising stars. The reasons for cloud collapse (or triggering) of star formation may be to due to multiple factors, and therefore not explained by a single scenario.
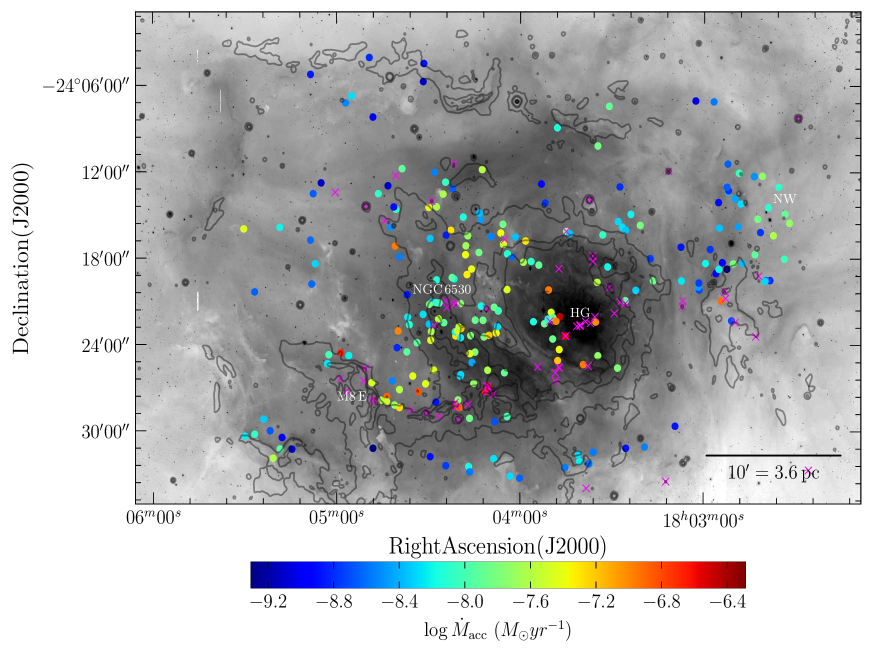
6.2 Mapping of CTTS and protostellar populations
The observed spatial distributions of young stellar objects (YSO) in star forming regions are a relic of the star formation process, and also indicative of their dynamical evolution from the protostellar to the pre-main sequence phase. Recent surveys of nearby star-forming regions (for example, see Winston et al. 2007; Megeath, Li & Nordlund 2009) have found young Class I protostars densely packed and tracing their natal molecular clouds, while relatively older pre-main sequence stars are found to be comparatively more spread out. Such morphologies place useful constraints on current star formation theories (Megeath et al. 2009; Moeckel & Bonnell 2009; Higuchi et al. 2013), and can also be useful diagnostics of the evolutionary stage of PMS stars.
The sample of Class I objects is drawn from a Spitzer study of the region by Kumar & Anandarao (2010). Briefly, the authors of that paper used observations in the Spitzer 3.6, 4.5, 5.8 and 8 bands to classify PMS objects according to their spectral slope. They identified 65 Class I objects on this basis. The distribution of our VPHAS+ CTTS sample, and Class I sources from Kumar & Anandarao (2010) are over-plotted on contours of Spitzer 8 emission in Fig. 19. The region surrounding the Hourglass nebula is saturated in the Spitzer image. Contours display a central egg shaped morphology, with elongated filamentary structures found across the northern, southern and western edges. Class I objects are found within the filamentary gas structures indicated by the contours. CTTS are found along the edges of the contour lines, and appear to hug the gas structures, with extended distributions in halos surrounding the Class I objects.
The distribution of the nearest neighbours of Class I objects has a median projected distance of 0.18 pc. The CTTS median nearest neighbour separation is 0.24 pc. There are no defined peaks, but an exponential decrease after a gradual peak. On performing a Kolmogorov-Smirnov (K-S) test, we find the probability that Class I and Class II objects are derived from the same random distribution to be 10 %, i.e. non-negligible (p-value = 0.09). We also generate a random distribution of 10,000 stars, where no underlying distribution is assumed and we calculate their nearest neighbour separations. Comparing the YSO distribution with the sample of random stars, the p-value in both cases is 0.01 %. The K-S tests suggest that the Class I objects and CTTS are similar. Both cannot be drawn from a randomly distributed population of stars, suggesting significant clustering. We caution that our numbers may be biased as both the CTTS and Class I samples are selected from data which are affected in the Hourglass nebula, thus possibly not identifying important sources within this region.
Adopting the mean molecular cloud properties of the south eastern gas clumps derived by Tothill et al. (2002), where the mean molecular density is 4.46 104 cm-3, and mean gas temperature around 25 K we find the Jeans length (Jeans, 1928) to be 0.15 pc. The median observed spacing of Class I objects is roughly similar to the Jeans length. Similar results were found in nearby star-forming regions by (Young et al. 2006; Winston et al. 2007; Enoch et al. 2009). However, a number of Class I objects are found within the median spacing. This has lead Winston et al. (2007) to suggest the possibility of Bondi-Hoyle or competitive accretion in protostars in such regions due to the possibility of overlapping envelopes.
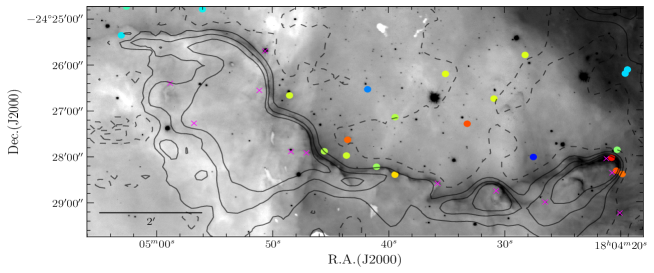
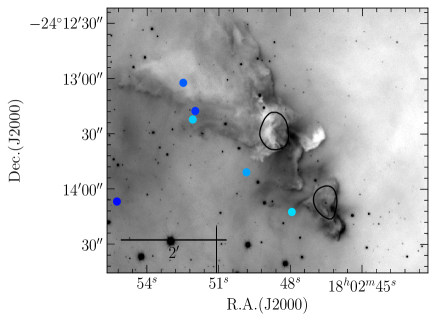
Another important morphology to consider here is the location of the YSO with respect to the ionising stars. In Fig. 20, 850 SCUBA contours spanning the southern filamentary arc (Tothill et al. 2002) are overlaid on the H image. Protostars are located within the molecular gas clumps, while CTTS are situated at the edges. The region is being ionised by the O4 V star 9 Sgr, and possibly the H 36 07 V star located inside the compact HII region to the north west of the region. The position of the Class I objects and CTTS is suggestive of a decreasing age gradient north to south with respect to the central cluster NGC 6530 and the Hourglass nebula.
We identify an elephant’s trunk like structure in the north west (Fig. 21). CTTS are located at the outer edges of the structure. The structure may be being ionised by the O type star HD 164536 situated around 1 pc to its south west, causing the bright rims on the western side of the structure. Most of the molecular gas in the structure has been evaporated, as suggested by the low intensity of Spitzer contours. Compared to the M8 E feature, the CTTS here are located on the other side of the bright rim being ionised, which is a curious morphology. No Class I sources have been identified within the region by Kumar & Anandarao (2010). CTTS all have an age between 1.6 and 2.3 Myr. The median radial velocity of members within the region (0.6 pc Myr-1; Prisinzano et al. 2007), suggests that stars are located close to where they formed. The difference in the morphology of Class I YSO and CTTS between these two regions suggests that there is a lack of evidence to apply a global star formation scenario throughout the Lagoon nebula.
6.3 Accretion properties with respect to O stars
PMS accretion is subject to the influence on its environment by nearby ionising stars. Ionising radiation from O-type stars is thought to disperse nearby molecular gas, and remove circumstellar material from PMS accretion discs disrupting star formation. There has been evidence for the photoevaporation process decreasing the disc fraction of PMS stars within a few parsecs (Guarcello et al. 2010; Roccatagliata et al. 2011). Alternatively, ionising fronts of O-stars are thought to trigger star formation by collapsing molecular clouds (see Elmegreen 2000; Sicilia-Aguilar et al. 2010; Barentsen et al. 2011; Karr, Manoj & Ohashi 2009; Snider et al. 2009).
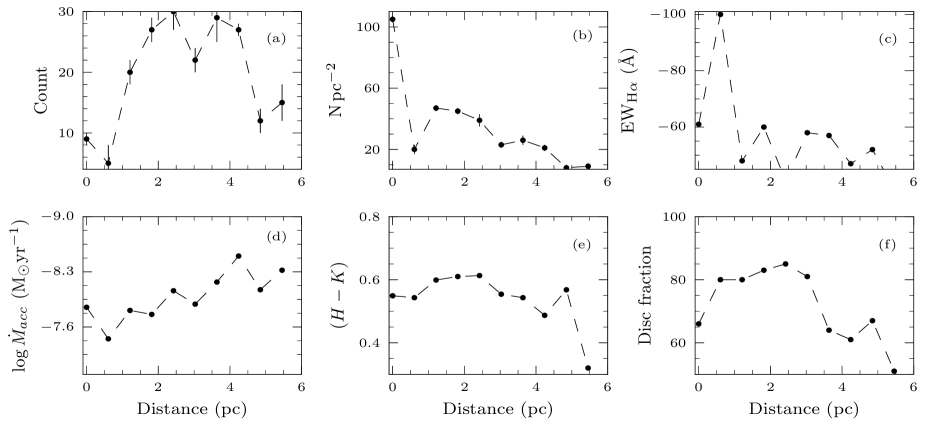
To study the effects of O-type stars on the PMS population in the Lagoon nebula, we analyse the radial distributions of the CTTS number density, accretion and disc properties with respect to their distance from the known O-type members in Figs. 22 and 23. Two O-type stars are considered, namely the O4 V type star 9 Sgr, which is thought to be ionizing the central part of the Lagoon Nebula, and responsible for clearing gas in the rift within the NGC 6530 cluster (Tothill et al. 2008), and the O7 V type star H 36 which is thought to be the main ionizing force in the Hourglass nebula (Arias et al. 2007).
Fig. 22 indicates that the number density of CTTS within 1 pc of 9 Sgr is considerably higher, with the Spearmans = 0.72. The median EWHα and log are also considerably different from the mean within 1 pc of 9 Sgr (where is 0.68 and -0.84 respectively), and follow a steady distribution 2 within the median thereafter. We find little change in the median () value with radial distance from 9 Sgr except at distances 5 pc, at the edge of the nebula. The CTTS disc fraction (defined as the ratio of CTTS falling within the near-infrared excess region of (Lada et al., 2000) to the whole CTTS population within the region) follows a similar trend, with the disc fraction somewhat smaller within 1 pc but steady thereafter until beyond 5 pc.
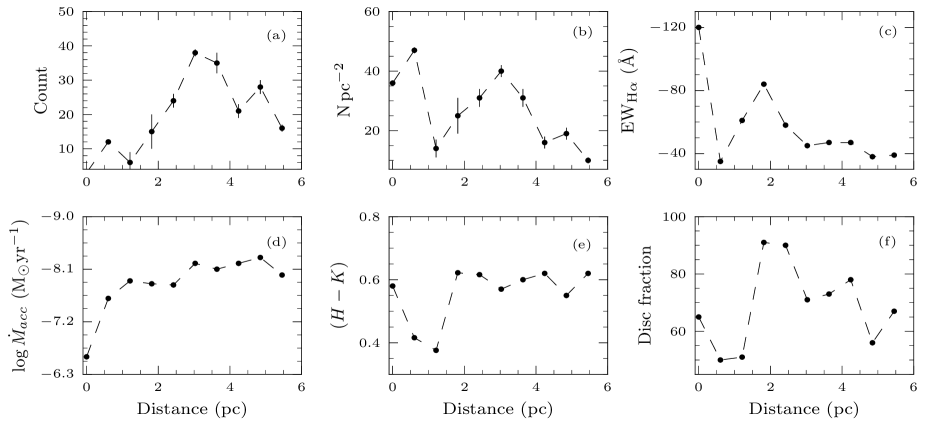
We find that the number density is fractionally higher within 1 pc of H 36 (Fig. 23), although this region is affected by incorrect H background sky subtractions (see Section 2). If the number of known CTTS (from Arias et al. 2007) within the excluded region is considered, the number density increases to 72 %. We find the median median EWHα and log are higher within 1 pc. The disc fraction within 1 pc is significantly smaller, although we caution that our observations are biased in this region (see Section 2.1). Arias et al. (2006) used near-infrared observations to find that the fraction of disc-bearing members to non-members is around 70 % within this region, suggesting that it is close to the median in the Lagoon Nebula.
Overall, we find that the gradients of CTTS accretion properties with respect to the O-type stars are not indicative of triggered star formation. We find evidence for disc photoevaporation within 1 pc of 9 Sgr and H 36, although we caution that taking into account censored observations, this may not be the case around H 36. Finally, we find that the number density, median EWHα and log are comparatively higher within 1 pc of both 9 Sgr and H 36. This may be explained by the fact that the youngest stars are situated close to the O-type stars, as shown by Fig 18.
7 Summary
We identify 235 Classical T Tauri candidate stars in the Lagoon Nebula and measured their accretion rates. The majority of our sample demonstrate multiple indicators of disc accretion: H emission, -excess, and near-infrared excesses. The conclusions drawn from our study are:
-
1.
A majority of the CTTS in the Lagoon Nebula have isochronal ages around 1 Myr. This is consistent with the main-sequence lifetimes of O-type star members, the dynamical evolutionary stage, and the lifetime of the HII region.
-
2.
The accretion rates determined from H line luminosity and UV-excess luminosity from 87 stars show no statistically significant differences. The mean amplitude variation 0.17 dex.
-
3.
We find best-fit power law relation .
-
4.
The distribution of CTTS is a continuum ranging from dense clustering to relative isolation. Class I objects are comparatively more clustered than CTTS.
-
5.
The youngest accretors are concentrated around the Hourglass nebula and M8 E region. Accretion rates decrease towards the edges of the nebula, except in the northwest.
-
6.
We find no evidence supporting a global star formation scenario within the Lagoon nebula. We suggest that star formation may be influenced by environmental effects on smaller scales.
Overall, we demonstrate the application of VPHAS+ data to identify and measure accretion rates of CTTS candidates using uniform selection criteria and known detection limits. Future astrometric and spectroscopic observations such as those undertaken by the GAIA and GES survey will obtain further information about a significant number of our CTTS sample, complementing our VPHAS+ study.
Acknowledgements
Based on observations collected at the European Southern Observatory Very Large Telescope in programme 177.D-3023(C). V.M.K. and J.S.V. acknowledge funding from DCAL-NI and the UK Science and Technology Facilities Council. V.M.K. thanks the anonymous referee, and Drs. R. Oudmaijer and G. Ramsay for providing helpful and constructive comments.
References
- Allen et al. (2007) Allen L., Megeath S. T., et al. 2007 Protostars and Planets V, The Structure and Evolution of Young Stellar Clusters. pp 361–376
- Arias et al. (2006) Arias J. I., Barbá R. H., Maíz Apellániz J., Morrell N. I., Rubio M., 2006, MNRAS, 366, 739
- Arias et al. (2007) Arias J. I., Barbá R. H., Morrell N. I., 2007, MNRAS, 374, 1253
- Arias et al. (2002) Arias J. I., Morrell N. I., Barbá R. H., Bosch G. L., Grosso M., Corcoran M., 2002, MNRAS, 333, 202
- Barentsen et al. (2011) Barentsen G., Vink J. S., Drew J. E., Greimel R., Wright N. J., Drake J. J., Martin E. L., Valdivielso L., Corradi R. L. M., 2011, MNRAS, 415, 103
- Barentsen et al. (2013) Barentsen G., Vink J. S., Drew J. E., Sale S. E., 2013, MNRAS, 429, 1981
- Barrado y Navascués & Martín (2003) Barrado y Navascués D., Martín E. L., 2003, AJ, 126, 2997
- Bessell et al. (1998) Bessell M. S., Castelli F., Plez B., 1998, A&A, 333, 231
- Bonatto et al. (2004) Bonatto C., Bica E., Girardi L., 2004, A&A, 415, 571
- Bouwman et al. (2006) Bouwman J., Lawson W. A., Dominik C., Feigelson E. D., Henning T., Tielens A. G. G. M., Waters L. B. F. M., 2006, ApJL, 653, L57
- Bressan et al. (2012) Bressan A., Marigo P., Girardi L., Salasnich B., Dal Cero C., Rubele S., Nanni A., 2012, MNRAS, 427, 127
- Calvet & Gullbring (1998) Calvet N., Gullbring E., 1998, ApJ, 509, 802
- Castelli & Kurucz (2004) Castelli F., Kurucz R. L., 2004, preprints (arXiv:0405.087)
- Chen et al. (2007) Chen L., de Grijs R., Zhao J. L., 2007, AJ, 134, 1368
- Clarke & Pringle (2006) Clarke C. J., Pringle J. E., 2006, MNRAS, 370, L10
- Cohen & Kuhi (1979) Cohen M., Kuhi L. V., 1979, ApJS, 41, 743
- Costigan et al. (2012) Costigan G., Scholz A., Stelzer B., Ray T., Vink J. S., Mohanty S., 2012, MNRAS, 427, 1344
- Costigan et al. (2014) Costigan G., Vink J. S., Scholz A., Ray T., Testi L., 2014, MNRAS, 440, 3444
- Cutri et al. (2003) Cutri R. M., Skrutskie M. F., van Dyk S., Beichman C. A., Carpenter J. M., Chester T., Cambresy et al. 2003, Explanatory Supplement to the 2MASS All-Sky Data Release.. Washington, DC: NASA
- Da Rio et al. (2014) Da Rio N., Jeffries R. D., Manara C. F., Robberto M., 2014, MNRAS, 439, 3308
- Daemgen et al. (2013) Daemgen S., Petr-Gotzens M. G., Correia S., Teixeira P. S., Brandner W., Kley W., Zinnecker H., 2013, A&A, 554, A43
- Dahm (2008) Dahm S. E., 2008, AJ, 136, 521
- D’Alessio et al. (2001) D’Alessio P., Calvet N., Hartmann L., 2001, ApJ, 553, 321
- Damiani et al. (2004) Damiani F., Flaccomio E., Micela G., Sciortino S., Harnden Jr. F. R., Murray S. S., 2004, ApJ, 608, 781
- De Marchi et al. (2010) De Marchi G., Panagia N., Romaniello M., 2010, ApJ, 715, 1
- Drew et al. (2014) Drew J. E., Gonzalez-Solares E., Greimel R., Irwin M. J., Küpcü Yoldas A., Lewis J., Barentsen G., Eislöffel J., et al.. 2014, MNRAS, 440, 2036
- Drew et al. (2005) Drew J. E., Greimel R., Irwin M. J., Aungwerojwit A., Barlow M. J., Corradi R. L. M., Drake J. J., et al. 2005, MNRAS, 362, 753
- Elmegreen (2000) Elmegreen B. G., 2000, ApJ, 530, 277
- Enoch et al. (2009) Enoch M. L., Corder S., Dunham M. M., Duchêne G., 2009, ApJ, 707, 103
- Fang et al. (2009) Fang M., van Boekel R., Wang W., Carmona A., Sicilia-Aguilar A., Henning T., 2009, A&A, 504, 461
- Gallardo et al. (2012) Gallardo J., del Valle L., Ruiz M. T., 2012, AJ, 143, 18
- Getman et al. (2014) Getman K. V., Feigelson E. D., Kuhn M. A., Broos P. S., Townsley L. K., Naylor T., Povich M. S., Luhman K. L., Garmire G. P., 2014, ApJ, 787, 108
- González-Solares et al. (2008) González-Solares E. A., Walton N. A., Greimel R., Drew J. E., Irwin M. J., 2008, MNRAS, 388, 89
- Guarcello et al. (2010) Guarcello M. G., Damiani F., Micela G., Peres G., Prisinzano L., Sciortino S., 2010, A&A, 521, A18
- Gullbring et al. (1998) Gullbring E., Hartmann L., Briceno C., Calvet N., 1998, ApJ, 492, 323
- Hartigan & Kenyon (2003) Hartigan P., Kenyon S. J., 2003, ApJ, 583, 334
- Hartmann (1994) Hartmann L., 1994, LPI Contributions, 844, 11
- Hartmann (2008) Hartmann L., 2008, Accretion Processes in Star Formation. Cambridge University Press, Cambridge, UK
- Hartmann et al. (2006) Hartmann L., D’Alessio P., Calvet N., Muzerolle J., 2006, ApJ, 648, 484
- Hecht et al. (1982) Hecht J., Helfer H. L., Wolf J., Pipher J. L., Donn B., 1982, ApJL, 263, L39
- Herczeg & Hillenbrand (2008) Herczeg G. J., Hillenbrand L. A., 2008, ApJ, 681, 594
- Higuchi et al. (2013) Higuchi A. E., Kurono Y., Naoi T., Saito M., Mauersberger R., Kawabe R., 2013, ApJ, 765, 101
- Jeans (1928) Jeans J. H., 1928, Astronomy and cosmogony. Cambridge University Press, Cambridge, UK
- Jester et al. (2005) Jester S., Schneider D. P., Richards G. T., Green R. F., Schmidt M., Hall P. B., Strauss M. A., Vanden Berk D. E., Stoughton C., Gunn J. E., Brinkmann J., Kent S. M., Smith J. A., Tucker D. L., Yanny B., 2005, AJ, 130, 873
- Johnson (1967) Johnson H. L., 1967, ApJ, 147, 912
- Kalari & Vink (2015) Kalari V. M., Vink J. S., 2015, ApJ, 800, 113
- Karr et al. (2009) Karr J. L., Manoj P., Ohashi N., 2009, ApJ, 697, 133
- Kuhn et al. (2014) Kuhn M. A., Feigelson E. D., Getman K. V., Baddeley A. J., Broos P. S., Sills A., Bate M. R., Povich M. S., Luhman K. L., Busk H. A., Naylor T., King R. R., 2014, ApJ, 787, 107
- Kukarkin & Kholopov (1982) Kukarkin B. V., Kholopov P. N., 1982, New catalogue of suspected variable stars. Nauka, Moscow
- Kumar & Anandarao (2010) Kumar D. L., Anandarao B. G., 2010, MNRAS, 407, 1170
- Lada et al. (1976) Lada C. J., Gottlieb C. A., Gottlieb E. W., Gull T. R., 1976, ApJ, 203, 159
- Lada et al. (2000) Lada C. J., Muench A. A., Haisch Jr. K. E., Lada E. A., Alves J. F., Tollestrup E. V., Willner S. P., 2000, AJ, 120, 3162
- Lavalley et al. (1992) Lavalley M., Isobe T., Feigelson E., 1992, in Worrall D. M., Biemesderfer C., Barnes J., eds, Astronomical Data Analysis Software and Systems I Vol. 25 of ASP Conf. Ser., ASURV: Astronomy Survival Analysis Package. p. 245
- Lightfoot et al. (1984) Lightfoot J. F., Deighton D. W., Furniss I., Glencross W. M., Hirst C. J., Jennings R. E., Poulter G., 1984, MNRAS, 208, 197
- Lucas et al. (2008) Lucas P. W., Hoare M. G., Longmore A., Schröder A. C., Davis C. J., Adamson A., Bandyopadhyay R. M., de Grijs R., Smith M. e. a., 2008, MNRAS, 391, 136
- Manara et al. (2012) Manara C. F., Robberto M., Da Rio N., Lodato G., Hillenbrand L. A., Stassun K. G., Soderblom D. R., 2012, ApJ, 755, 154
- Mayne & Naylor (2008) Mayne N. J., Naylor T., 2008, MNRAS, 386, 261
- Mayne et al. (2007) Mayne N. J., Naylor T., Littlefair S. P., Saunders E. S., Jeffries R. D., 2007, MNRAS, 375, 1220
- Megeath et al. (2009) Megeath S. T., Li Z.-Y., Nordlund A., 2009, The formation of distributed and clustered stars in molecular clouds. Cambridge University Press, Cambridge, UK, p. 228
- Meyer et al. (1997) Meyer M. R., Calvet N., Hillenbrand L. A., 1997, AJ, 114, 288
- Moeckel & Bonnell (2009) Moeckel N., Bonnell I. A., 2009, MNRAS, 400, 657
- Muzerolle et al. (1998) Muzerolle J., Calvet N., Hartmann L., 1998, ApJ, 492, 743
- Muzerolle et al. (2003) Muzerolle J., Hillenbrand L., Calvet N., Briceño C., Hartmann L., 2003, ApJ, 592, 266
- Natta et al. (2006) Natta A., Testi L., Randich S., 2006, A&A, 452, 245
- Neckel & Chini (1981) Neckel T., Chini R., 1981, A&AS, 45, 451
- Pickles (1998) Pickles A. J., 1998, PASP, 110, 863
- Prisinzano et al. (2007) Prisinzano L., Damiani F., Micela G., Pillitteri I., 2007, A&A, 462, 123
- Prisinzano et al. (2005) Prisinzano L., Damiani F., Micela G., Sciortino S., 2005, A&A, 430, 941
- Prisinzano et al. (2012) Prisinzano L., Micela G., Sciortino S., Affer L., Damiani F., 2012, A&A, 546, A9
- Rigliaco et al. (2011) Rigliaco E., Natta A., Randich S., Testi L., Biazzo K., 2011, A&A, 525, A47
- Roccatagliata et al. (2011) Roccatagliata V., Bouwman J., Henning T., Gennaro M., Feigelson E., Kim J. S., Sicilia-Aguilar A., Lawson W. A., 2011, ApJ, 733, 113
- Scholz et al. (2005) Scholz A., Jayawardhana R., Eislöffel J., Froebrich D., 2005, Astronomische Nachrichten, 326, 895
- Sicilia-Aguilar et al. (2006) Sicilia-Aguilar A., Hartmann L. W., Fürész G., Henning T., Dullemond C., Brandner W., 2006, AJ, 132, 2135
- Sicilia-Aguilar et al. (2010) Sicilia-Aguilar A., Henning T., Hartmann L. W., 2010, ApJ, 710, 597
- Siess et al. (2000) Siess L., Dufour E., Forestini M., 2000, A&A, 358, 593
- Snider et al. (2009) Snider K. D., Hester J. J., Desch S. J., Healy K. R., Bally J., 2009, ApJ, 700, 506
- Spezzi et al. (2012) Spezzi L., de Marchi G., Panagia N., Sicilia-Aguilar A., Ercolano B., 2012, MNRAS, 421, 78
- Sung et al. (2000) Sung H., Chun M.-Y., Bessell M. S., 2000, AJ, 120, 333
- Tognelli et al. (2011) Tognelli E., Prada Moroni P. G., Degl’Innocenti S., 2011, A&A, 533, A109
- Tothill et al. (2008) Tothill N. F. H., Gagné M., Stecklum B., Kenworthy M. A., 2008, in Reipurth B., ed., Handbook of Star Forming Regions, Vol II The Lagoon Nebula and its Vicinity. p. 533
- Tothill et al. (2002) Tothill N. F. H., White G. J., Matthews H. E., McCutcheon W. H., McCaughrean M. J., Kenworthy M. A., 2002, ApJ, 580, 285
- van Altena & Jones (1972) van Altena W. F., Jones B. F., 1972, A&A, 20, 425
- van den Ancker et al. (1997) van den Ancker M. E., The P. S., Feinstein A., Vazquez R. A., de Winter D., Perez M. R., 1997, A&AS, 123, 63
- Venuti et al. (2014) Venuti L., Bouvier J., Flaccomio E., Alencar S. H. P., Irwin J., Stauffer J. R., Cody A. M., Teixeira P. S., Sousa A. P., Micela G., Cuillandre J.-C., Peres G., 2014, A&A, 570, A82
- Vink et al. (2005) Vink J. S., Drew J. E., Harries T. J., Oudmaijer R. D., Unruh Y., 2005, MNRAS, 359, 1049
- Vink et al. (2008) Vink J. S., Drew J. E., Steeghs D., Wright N. J., Martin E. L., Gänsicke B. T., Greimel R., Drake J., 2008, MNRAS, 387, 308
- Walborn (1973) Walborn N. R., 1973, AJ, 78, 1067
- Weidner & Kroupa (2006) Weidner C., Kroupa P., 2006, MNRAS, 365, 1333
- White et al. (1997) White G. J., Tothill N. F. H., Matthews H. E., McCutcheon W. H., Huldtgren M., McCaughrean M. J., 1997, A&A, 323, 529
- White & Basri (2003) White R. J., Basri G., 2003, ApJ, 582, 1109
- Williams & Cieza (2011) Williams J. P., Cieza L. A., 2011, ARA&A, 49, 67
- Winston et al. (2007) Winston E., Megeath S. T., Wolk S. J., Muzerolle J., Gutermuth R., Hora J. L., Allen L. E., Spitzbart B., Myers P., Fazio G. G., 2007, ApJ, 669, 493
- Young et al. (2006) Young E. T., Teixeira P. S., Lada C. J., Muzerolle J., Persson S. E., Murphy D. C., Siegler N., Marengo M., Krause O., Mainzer A. K., 2006, ApJ, 642, 972