Direct evidence for strong crossover of collective excitations and positive sound dispersion in the supercritical state
Abstract
Supercritical state has been viewed as an intermediate state between gases and liquids with largely unknown physical properties. Here, we address the important ability of supercritical fluids to sustain collective excitations. We directly study propagating modes on the basis of correlation functions calculated from extensive molecular dynamics simulations, and find that the supercritical system sustains propagating solid-like transverse modes below the Frenkel line but becomes devoid of transverse modes above the line where it supports longitudinal modes only. Important thermodynamic implications of this finding are discussed. We directly detect positive sound dispersion (PSD) below the Frenkel line where transverse modes are operative, quantitatively explain its magnitude on the basis of transverse and longitudinal velocities. PSD disappears above the Frenkel line which therefore demarcates the supercritical phase diagram into two areas where PSD does and does not operate.
Most important thermodynamic and dynamical properties of an interacting system are related to collective excitations. This has been widely ascertained in solids and, to a smaller degree, in liquids march1 ; balu ; hansenmcd . In contrast, there is nearly no discussion and understanding of what kind of collective modes propagate in the supercritical state of matter, how they evolve with temperature and what are the physical consequences. This is related to the lack of understanding of the supercritical state itself sup1 ; sup2 . In existing view, no difference can be made between gases and liquids above the critical point. At the same time, it was long suspected that the supercritical state can show elements of gas and liquid behavior depending on pressure and temperature. We have recently addressed this point frprl ; frpre ; ufn and proposed that a distinction between gas-like and liquid-like states can be formulated in a rigorous sense. We have put forward the concept of the Frenkel line (FL) demarcating the gas-like and liquid-like behavior at arbitrarily high pressure and temperature above the critical point. Crossing the line results in the qualitative change of particle dynamics: particle motion is purely diffusive above the line as in a gas, and combines diffusive and oscillatory motion below the line as in a liquid. Mathematically, the FL can be defined by the disappearance of the minima of the velocity auto-correlation function on temperature increase (or pressure decrease), corresponding to the gas-like monotonic decay frprl .
At first glance, the above qualitative change of supercritical system behavior is dynamical only. Yet crossing the Frenkel line should also have an important thermodynamic consequence, through the pronounced crossover of collective excitations. Indeed, the crossover from oscillatory-diffusive to purely diffusive dynamics corresponds to frpre , where is liquid relaxation time and is the minimal period of vibration of transverse waves. Combining this with the proposal that a liquid sustains propagating transverse waves with frequency above , the FL corresponds to the complete loss of two transverse modes at all available frequencies. The crossover at the FL corresponds to specific heat , which includes the contribution of the energy of one longitudinal mode, , and kinetic terms of two transverse modes of each phonon1 , where is the number of particles. The state where is expected to be accompanied by the crossover of to the state with only one longitudinal mode remaining, the prediction supported by the numerical results phonon2 . Consistent with the above discussion, the disappearance of the minima of the velocity auto-correlation function (VAF) coincides with frprl . This strongly suggests that the dynamical crossover at the FL is intimately related to an important change of thermodynamical properties of the supercritical system related to the crossover of collective excitations.
In view of the current interest in the supercritical state and importance of collective excitations, it is essential to follow their evolution directly across the FL and discuss physical implications. This is the primary goal of this paper. For the first time, we directly study collective excitations in the supercritical state on the basis of correlation functions calculated from molecular dynamics simulations and discuss important implications for key thermodynamic properties such as energy and heat capacity. We then turn to interesting dynamical phenomena such as PSD. We directly detect PSD below the FL where transverse modes operate but not above the FL, and provide a quantitative description of the effect.
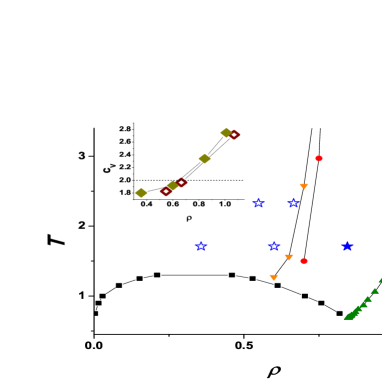
We have performed MD simulations of the commonly used Lennard-Jones (LJ) system with parameters K and Å corresponding to Argon. We have used particles in the cubic box with periodic boundaries. The system was equilibrated for time steps, followed by production steps. Nose-Hoover and constant-energy ensembles were used for equilibration and production runs, respectively. The time step was in LJ units. We have simulated several temperature and pressure points in the supercritical state below and above the FL. Accordingly, we have simulated three densities at : , and (here and below, and are in LJ units) and four densities at : , , and . The point (, ) is very close to the Frenkel line while the points (, ) and (, ) are above and below the FL, respectively. The location of points under investigation is shown in Fig. 1. We refer to two regimes of liquid dynamics above and below the FL as “non-rigid” gas-like fluid and “rigid” liquid, reflecting the system ability to sustain solid-like transverse modes.
To directly address the evolution of collective modes, we have studied the dispersion of longitudinal and transverse modes and have calculated the correlation functions and , where is the velocity current hansenmcd . Dispersion curves of longitudinal and transverse excitations are obtained from the location of maxima of Fourier transforms and respectively. The spectra for at three densities studied are shown in Figs. 2 (a)-(c), together with the dispersion curves of both longitudinal and transverse excitations.
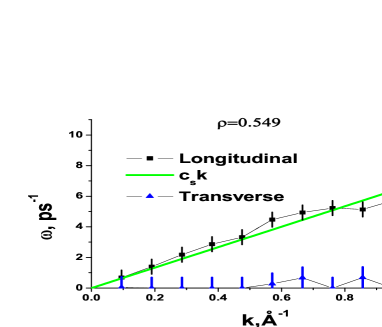
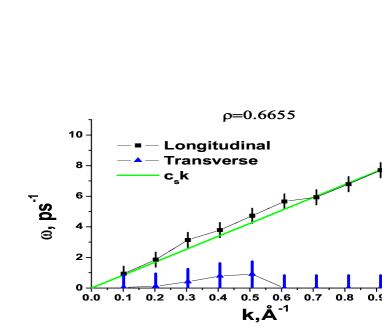
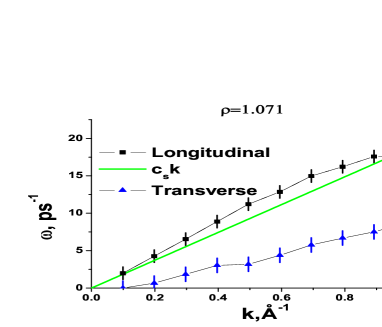
We observe that in the non-rigid gas-like fluid at , the dispersion curve is close to the Debye approximation , where is the adiabatic speed of sound. Small upward deviation from the linear dependence (positive sound dispersion, PSD) is observed, but is within the simulation error bars (the errors that include the calculation of the correlation functions and and taking their Fourier transforms). We also observe that the transverse excitations are absent at this density within the error. The same behavior is seen at very close to the FL. A notable difference in behavior appears at which corresponds to the rigid liquid below the FL: we clearly observe PSD in case of longitudinal modes and a distinct transverse branch for the transverse ones.
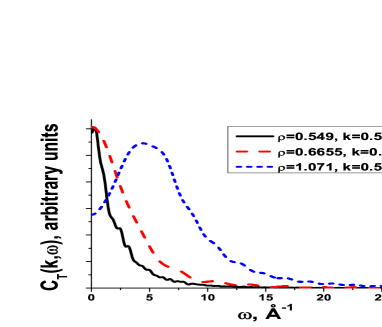
In order to emphasize the qualitative change of the spectrum of transverse excitations on crossing the FL, we show examples of functions for all three densities at approximately the same value of (Fig. 3). We observe that no peak is found in the current correlation function at and , while the clear peak is seen at signifying the propagating transverse mode with frequency ps-1.
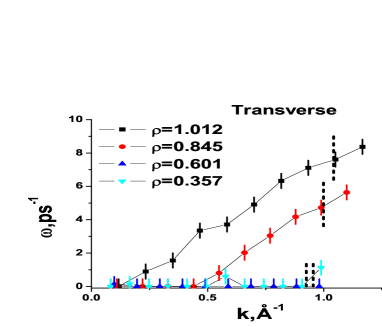
The same picture of evolution of transverse modes emerges from the simulation at the different temperature, . According to Fig. 4, no transverse excitations are found above the FL at and . At higher densities below the FL, the transverse excitations are clearly seen: at and , they start from and from the origin, respectively.
Our results of direct calculation of transverse modes have two important implications for understanding the thermodynamic behavior of the supercritical state. First, the theoretical calculation implies that the disappearance of transverse waves gives phonon1 as discussed above. Combined with the directly calculated evolution of transverse waves and their disappearance at the FL, this implies that of the supercritical system is at the FL. This value is consistent with the calculated from our MD simulations at the FL, as was the case in the previous work frprl . Second, the disappearance of transverse modes at the FL implies that the evolution of the supercritical system above the FL is governed by the remaining longitudinal mode only, with the particle mean free path defining the minimal wavelength possible. This is a mechanism different from that governing the system vibration energy below the FL. Therefore, we expect to find the crossover of at the FL between two different behaviors. Such a crossover was seen in the previous MD simulations phonon2 .
In addition to thermodynamic implications above, the disappearance of transverse waves at the FL has an important consequence for the phenomenon of PSD mentioned above. The physical origin of the PSD has remained controversial, including understanding relative contributions of the above Frenkel mechanism and other effects such as disorder. Experimentally, PSD has been well-studied in viscous liquids where the system starts sustaining rigidity at MHz frequencies (see, e.g., Ref. jeong ). Here, PSD is seen at fairly large wavelengths at which the liquid can be considered as a homogeneous medium. It is generally agreed jeong that in this range of frequencies, PSD originates from the Frenkel mechanism: at high frequency where liquid shear response and shear modulus become non-zero, the propagation velocity crosses over from its hydrodynamic value to the solid-like elastic value , where and are bulk and shear moduli, respectively. At smaller wavelengths approaching the length of medium and short-range order, the wave feels structural inhomogeneities, and disorder of liquids and glasses starts to affect the dispersion relationship. PSD, with the relative magnitude of few percent, was observed in a model harmonic glass and attributed to the “instantaneous relaxation” due to fast decay and dissipation of short-wavelength phonons in a disordered system fast1 . Later work demonstrated that starting from mesoscopic wavelengths, the effective speed of the longitudinal sound can both increase and decrease fast2 ; dec1 ; dec2 . Different mechanisms and contributions to PSD were subsequently discussed ruocco ; fast3 . The instantaneous relaxation is likely to be significant close to the zone boundary ruzi , although large PSD in silica glass may be related to the effect of mixing with the low-lying optic modes. In water, PSD was discussed on the basis of coupling between the longitudinal and transverse excitations, and it was found that the onset of transverse excitations coincides with the inverse of liquid relaxation time water-fast ; cunsolo , as predicted by Frenkel.
Our finding of the presence and absence of transverse modes below and above the FL has two important implications for understanding the phenomenon of PSD. First, we see in Fig. 2 that significant PSD does not exist at small density and where no transverse modes propagate, but emerges in the state where transverse modes kick in at higher density. This is exactly the behavior predicted by the Frenkel mechanism above.
Second and perhaps more importantly, we can quantitatively address the magnitude of the PSD in the supercritical state. A well-known result for solids is that longitudinal and transverse velocities can be computed as and correspondingly where is the shear modulus and is the bulk one. The same expressions can be applied to liquids which sustain shear stress at high frequency in the solid-like regime dyre . Combining the expressions for , and , we write
| (1) |
Using our MD data, we have taken and from the dispersion curves at points where the observed PSD is maximal and where is in the quasi-linear regime before starting to curve at large . We have used two points on the phase diagram: and . The velocities were taken at Å-1 for the former and Å-1 for the latter point. Using the observed , we have calculated using Eq. (1). Comparing the actual observed with the calculated one in Table 1, we find that the Frenkel mechanism describes the PSD well.
| (obs.) | (calc.) | ||||
|---|---|---|---|---|---|
| [m/s] | [m/s] | [m/s] | [m/s] | ||
| LJ1 | 1860 | 750 | 2110 | 2060 | |
| LJ2 | 1590 | 735 | 1870 | 1805 | |
| Fe | 3800 | 1870 | 4370 | 4370 | |
| Cu | 3460 | 1510 | 3890 | 3875 | |
| Zn | 2780 | 1620 | 3330 | 3350 | |
| Sn | 2440 | 1220 | 2890 | 2820 |
We have complemented Table 1 by the data for , and from recent experiments for Fe, Cu, Zn and Sn sn ; hoso3 . As before, we have used points where the observed PSD is maximal and where is in the quasi-linear regime. For Fe, Cu, Zn, we consider the following points: nm-1, (first point on the transverse branch), nm-1 (second point on the branch) and nm-1 (second point on the branch). For Sn, large PSD is seen at about nm-1 at the second point on the longitudinal branch. To find at this , we extrapolated the higher-lying transverse points to lower while keeping them parallel to the simulation points, yielding m/s. Similar to LJ systems, we observe perfect quantitative agreement between calculated and observed in Table 1.
Coupled with the direct evidence of transverse modes below the FL, the quantitative agreement between predicted and observed implies that the Frenkel mechanism of PSD quantitatively accounts for both simulated and experimental data in the wide range of spanning at least a half of the first pseudo-Brillouin zone.
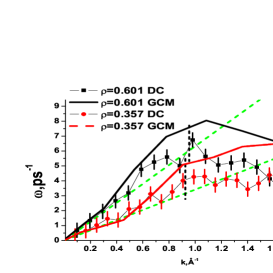
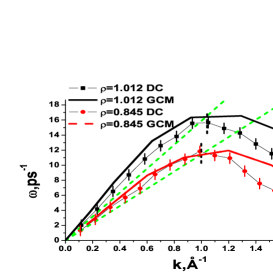
Our observation regarding propagating modes is related to the important point of their detection. Theoretically, solid-like modes were predicted by simply observing that the system behaves like a solid above the frequency frenkel . Therefore, we have detected propagating waves by direct analysis of the current correlation function, the procedure similar to that employed in the experiments. A notably different result can be found if a scheme extrapolating the hydrodynamic into the solid-like regime is employed instead. To compare the direct results with one such scheme, the generalized collective modes (GCM) approach bryk-pre , we plot the dispersion curves at the same temperature and density conditions as in the GCM study (see Fig. 7 in Ref. bryk-lj ) in Fig. 5. We observe that the GCM extrapolation gives reasonable results for small only but not for larger : the GCM systematically overestimates the excitations frequency in both rigid and non-rigid regimes. As a result, the unphysical PSD in the non-rigid fluid is observed in the GCM calculation. A known disadvantage of the generalized hydrodynamics is related to the phenomenological and empirical nature of the method pilgrim2 ; mon-na , the general problem that involves more specific issues in the case of the GCM scheme. The choice of variables in the GCM method is largely ad-hoc. Next, the GCM method is internally inconsistent and violates the sum rules because the sum rules can only be exactly fulfilled if an infinite number of exponentials is used (see also summ-rule ). Finally, the GCM extrapolation incorrectly describes the important region of large including the crossover to the single-particle regime (see, for example, eq. 21 in ruocco ). This is apparent in Figure 5 showing failure of the GCM method at large .
In summary, we have addressed the propagation of collective excitations in the supercritical state, and directly detected their strong crossover. We have found that the supercritical system sustains propagating solid-like transverse mode below the Frenkel line but becomes devoid of transverse modes above the line where it supports longitudinal mode only. Our results quantitatively explain the phenomenon of PSD originating from transverse modes in the supercritical state below the Frenkel line. We have directly ascertained that the line demarcates the supercritical phase diagram into two regions where PSD does and does not operate.
Acknowledgements.
Yu. F. thanks the Russian Scientific Center at Kurchatov Institute and Joint Supercomputing Center of Russian Academy of Science for computational facilities. Yu. F., E. Ts., V. R. and V. B. are grateful to the Russian Science Foundation (Grant No 14-22-00093).References
- (1) N. H. March and M. P. Tosi, Atomic Dynamics in Liquids, (Dover Publications, 1991).
- (2) U. Balucani and M. Zoppi, Dynamics of the Liquid State (Oxford University Press, 1995).
- (3) J. P. Hansen and I. R. McDonald, Theory of Simple Liquids (Elsevier, 2013).
- (4) E. Kiran, P. G. Debenedetti and C. J. Peters, Supercritical Fluids: Fundamentals and Applications, NATO Science Series E: Applied Sciences 366 (Kluwer Academic Publishers, Boston, 2000).
- (5) J. McHardy and S. P. Sawan, Supercritical Fluid Cleaning: Fundamentals, Technology and Applications (Westwood, Noyes Publications, 1998).
- (6) V. V. Brazhkin et al, Phys. Rev. Lett. 111, 145901 (2013).
- (7) V. V. Brazhkin et al, Phys. Rev. E 85, 031203 (2012).
- (8) V.V. Brazhkin et al, Phys. Usp. 55, 1061 (2012).
- (9) K. Trachenko, Phys. Rev. B 78, 104201 (2008).
- (10) D. Bolmatov, V.V. Brazhkin and K. Trachenko, Nature Commun. 4, 2331 (2013)
- (11) T. Scopigno, G. Ruocco G and F. Sette, Rev. Mod. Phys. 77, 881 (2005).
- (12) Y. H. Jeong, S. R. Nagel and S. Bhattacharya, Phys. Rev. A 34, 602 (1986).
- (13) G. Ruocco et al, Phys. Rev. Lett. 84, 5788 (2000).
- (14) G. Monaco and S. Mossa, PNAS 106, 16907 (2009).
- (15) G. Baldi, V. M. Giordano, G. Monaco and B. Ruta, Phys. Rev. Lett. 104, 195501 (2010).
- (16) G. Monaco and V. M. Giordano, PNAS, 106, 3659 (2009).
- (17) G. Ruocco and F. Sette, Condens. Matt. Phys. 11, 29 (2008).
- (18) B. Ruzicka et al, Phys. Rev. B 69, 100201 (2004).
- (19) E. Pontecorvo et al 71, Phys. Rev. E, 011501 (2005).
- (20) A. Cunsolo et al, Phys. Rev. B 85, 174305 (2012).
- (21) J. C. Dyre, Rev. Mod. Phys. 78, 953 (2006).
- (22) http://webbook.nist.gov/chemistry
- (23) S. Hosokawa et al, J. Phys.: Condens. Matt. 25, 112101 (2013).
- (24) S. Hosokawa et al, J. Phys.: Condens. Matt. 27, 194104 (2015).
- (25) J. Frenkel, Kinetic Theory of Liquids, edited by R. H. Fowler, P. Kapitza, and N. F. Mott (Oxford University Press, Oxford, 1947).
- (26) T. Bryk and I. Mryglod, Phys. Rev. E 63, 051202 (2001).
- (27) T. Bryk et al, J. Chem. Phys. 133, 024502 (2010).
- (28) W. C. Pilgrim and C. Morkel, J. Phys.: Condens. Matter. 18, R585 (2006).
- (29) V. M. Giordano and G. Monaco, PNAS 107, 21985 (2010).
- (30) M. H. Lee, Phys. Rev. Lett. 51, 1227 (1983).