Data-driven modelling of the
inositol trisphosphate receptor (IP3R) and its role in
calcium induced calcium release (CICR)
1. Introduction
A number of models have been published that relate different physiological processes involving glial cells to calcium dynamics. De Pittà et al. [22] give an overview of current problems in the modelling of astrocytes. One area of continuing interest is the propagation of signals between astrocytes via intercellular calcium waves. Höfer et al. [42] investigated the spreading of signals between astrocytes via calcium waves based on a model by Sneyd et al. [76]. Bennett et al. [8, 7] developed a more detailed model of calcium waves that combines underlying calcium dynamics with ATP release by purinergic receptors in order to demonstrate that calcium waves depend on ATP release rather than on IP3 diffusion through gap junctions as in the model by Höfer et al. [42]. Edwards and Gibson [27] later published a model that included both modes of signal propagation and concluded that both were necessary to account for data collected from the retina. Recently, the study of calcium waves has been extended from one- or two-dimensional to three-dimensional spatial domains [45]. Macdonald and Silva [50] model wave propagation on an astrocyte network derived from experimental data. The Bennett et al. model was used for investigating spreading depression, a wave of electrical silence that propagates through the cortex and depolarises neurons and glial cells [9].
A fundamental problem in calcium dynamics in general is the question how multiple signals can be encoded by the dynamics of a single quantity, the concentration of calcium. De Pittà et al. [24, 20, 23] investigated how a stimulus could be encoded via the frequency or the amplitude or both frequency and amplitude which demonstrates that two different signals can be represented independently in an individual calcium signal. Dupont et al. [26] showed in a detailed model how the signal received by a particular glutamate receptor is encoded via calcium oscillations.
Lavrentovich and Hemkin [46], Zeng et al. [87], Riera et al. [62], Riera et al. [63] investigated spontaneous calcium oscillations in astrocytes and Li et al. [47] explored their role in spreading depression.
Also the coupling of astrocyte network with the neural network has been investigated. At the single-cell level, De Pittà et al. [21] modelled the interaction of an astrocyte with a synapse. Allegrini et al. [1], Postnov et al. [59] study the influence of a network of astrocytes on a neural network.
Most recently, Barrack et al. [5, 6] explored the role of calcium signalling in neural development. By coupling calcium dynamics with a model of the cell cycle they examine how glial progenitors differentiate to neurons triggered by a calcium signal.
This review of the modelling literature on glial cells clearly demonstrates that the importance of calcium dynamics is well recognised—the majority of studies in the literature accounts for calcium signalling and often models are used to find a link of physiological processes with calcium signalling. In many cell types including glial cells the inositol trisphosphate receptor (IP3R) plays a crucial role in inducing oscillatory Ca2+ signals. In the presence of IP3, opening of IP3R channels leads to Ca2+ release from the endoplasmic reticulum (ER), an intracellular compartment with a very high Ca2+ concentration a few orders of magnitude higher than that of the cytoplasm. The IP3R is activated by Ca2+ so that such a release event dramatically increases the open probability of the IP3R which induces further release of Ca2+(henceforth called calcium-induced-calcium-release, or CICR) until a high Ca2+ concentration in the channel environment eventually inhibits the IP3R.
The Li-Rinzel model [48], an approximation of the classical De Young-Keizer model [25], is by far the most commonly used representation of the IP3R in models of glial cells. Only Allegrini et al. [1] and Lavrentovich and Hemkin [46] chose different models based on Atri et al. [3] or Tu et al. [82], respectively. Dupont et al. [26] use the model by Swillens et al. [79] that explicitly accounts for the effect of interactions in a cluster of IP3R channels. Early models of the IP3R were designed to account for the bell-shaped Ca2+ dependency of the open probability of the channel described by Bezprozvanny et al. [10]. Since then the dynamics of IP3R in response to varying concentrations of IP3, Ca2+ and ATP has been characterised much more comprehensively as well as the differences between the different isoforms of the IP3R (among the models mentioned above, in fact, only Tu et al. [82] accounts for the fact that astrocytes predominantly express type II IP3R).
The scope of current data-driven models of ion channels has advanced beyond representing the average open probability . Recent models capture the stochastic opening or closing of single IP3Rs in aggregated Markov models i.e. instead of only modelling the stationary behaviour of the channel they represent the dynamics of the IP3R (Section 3.4). Accurate representation of IP3R dynamics depends on various sources of experimental data (Sections 3.1-3.2) as well as appropriate statistical methods for fitting Markov models to these data (Section 3.5). Statistical methods automate the process of estimating parameters for a given Markov model. Thus, the main challenge of data-driven ion channel modelling is to define the structure of a Markov model which allows the integration of various sources of experimental data. We illustrate this process with two recent examples of models for the IP3R (Sections 3.6 and 3.7).
Once a model for a single channel has been developed, data from small clusters of channels can be used to determine how well the behaviour of a cluster is represented by an ensemble of single-channel models (Section 4.1). Studying the influence of an IP3R model on calcium dynamics allows us to evaluate the relative importance of different aspects of single-channel dynamics. Cao et al. [14] showed that the essential features of calcium dynamics in airway smooth muscle could be preserved after iteratively simplifying the IP3R model by Siekmann et al. [73] to a two-state model that only accounted for the switching between the inactive “park” and the active “drive” mode. In Section 4.2 it is shown that this also applies to the puff distribution. This demonstrates that modal gating is the most important regulatory mechanism of the IP3R. It also emphasises that data-driven modelling of ion channels does not necessarily have to lead to detailed models based on complicated model structures but rather can be used so that relevant data is selected to represent ion channels at the appropriate level of complexity for a given application.
2. Mathematical models of calcium dynamics/CICR
The purpose of a mathematical model of CICR is to explain the emergence of complex intracellular calcium dynamics such as oscillations as the result of interdependent calcium fluxes. This comprises both fluxes into and out of the cell as well as the exchange between the cytosol and intracellular stores (Figure 1).
The dynamics of cytosolic () and stored calcium () resulting from these fluxes can be represented by a system of differential equations:
| (1) | ||||
| (2) |
Here, is calcium influx from the extracellular space via calcium channels located in the cell membrane, accounts for calcium removed from the cell by the plasma membrane pump. and represent calcium release from the endoplasmic reticulum (ER) through the IP3R and the RyR, respectively, and stands for reuptake of calcium into the ER by the SERCA pump. The conversion factor , the ratio of the cytoplasmic volume to the ER volume, is necessary because calcium concentrations are calculated with respect to the different volumes of these two compartments. The model (1), (2) provides a description of Ca2+ concentrations across the whole cell. This means that we cannot account for spatial effects due to heterogeneities of the spatial distribution of IP3R, SERCA and other relevant components of the system. By using a deterministic model we further assume that the various Ca2+ fluxes can be described as deterministic after averaging over a large number of channels and transporters. In Section 4 we will consider a stochastic model over a small spatial domain for a cluster of interacting IP3Rs.
In a whole-cell model of calcium dynamics such as (1), (2), a representation of the IP3R must, in principle, just provide a functional expression for
| (3) |
the ligand-dependent flux through IP3R channels present in a cell. Because the calcium concentration is time-dependent, varies over time. In the early days of modelling of the IP3R, phenomenological models were used for representing the IP3R flux. A good example is the model by Atri et al. [3]:
| (4) |
where , and is the number of open channels. The model by De Young and Keizer [25] is derived from more detailed assumptions on chemical interactions of the channel with its ligands. In Section 3.6 we present a more recent model [84] that is representative for this approach. The Hill function-type terms in (4) enabled Atri et al. to interpret their model in terms of a physical process but the main motivation of the model was to obtain a fit of the calcium-dependent whole-cell flux to data collected by Parys et al. [58]. From a purely mathematical point of view, phenomenological models seem to be the ideal approach for investigating the role of IP3R in calcium dynamics—restriction to minimal models that generate the desired behaviour ensures that model behaviour can be analysed to a great extent. This allows us to test hypotheses on IP3R regulation in an elegant way.
But the capability of simple mathematical expressions for the macroscopic flux to perform the appropriate functional role in calcium dynamics is only a relatively indirect test for IP3R models. By following a phenomenological approach we mostly ignore data that gives more direct information on the IP3R, such as, for example, the molecular structure of the channel protein which can be obtained from crystallography and time series of opening and closing of a single channel from patch-clamp recordings. Taking into account these data may allow us to restrict the set of theoretically possible mathematical expressions and, in this way, also the set of possible mechanism.
3. Data-driven modelling of single IP3Rs
Because most biophysical data relate to single channels, data-driven modelling involves an important conceptual step—instead of directly specifying the whole-cell flux , we first construct a model for the flux through a single channel. Whereas for the macroscopic flux which is averaged spatially over many channels distributed across the whole cell the deterministic model (3) is appropriate, representing the flux through a single channel requires a stochastic model. In a second step, is then derived by appropriately averaging over the stochastic fluxes through individual channels.
In Sections 3.1 and 3.2 we describe two sources of data that are commonly used for the construction of ion channel models. Ca2+ release data from small clusters of IP3R, so-called calcium puffs (Section 3.3), can be used for validating models of single channels. In Section 3.4 aggregated continuous-time Markov models, the mathematical framework common to all models based on single-channel data, is introduced. A short review of statistical approaches for fitting Markov models to single-channel data is given in Section 3.5. In Sections 3.6 and 3.7 examples of two recent models of the IP3R are given in order to illustrate different modelling approaches. Earlier models have been reviewed by [38] and Sneyd and Falcke [77]. Model comparisons [78, 40] generally show that models not parameterised by fitting to experimental data may not do a very good job at reproducing the statistical properties of ion channel kinetics.
3.1. Molecular structure
The mathematical structure of many ion channel models is designed to mimic the chemical structure of the channel protein. The motivation for this approach is to link molecular structure of the ion channel to its function.
In vertebrates there exist three different genes encoding three different types of the IP3R. In mammals, type I IP3R is ubiquitously expressed but most cells express more than one isoform. The predominant isoform in astrocytes is type II IP3R [69, 43]. For each isoform there are several splice variants.
Imaging the three-dimensional structure of the complete IP3R and RyR channel proteins is challenging and only recently have accurate 3D visualisations of complete IP3Rs using electron cryomicroscopy (cryo-EM) become available [49]. Parts of the channel can be imaged at higher resolution by crystallography and be superimposed on cryo-EM images [29]. These studies have revealed that IP3R channels are tetramers i.e. formed by binding of four IP3R proteins. These tetramers may consist of different IP3R subtypes but experimental studies have so-far concentrated on investigating homotetramers formed by four copies of the same subtype (but see Alzayady et al. [2]). The classical model by De Young and Keizer [25] took into account this information by building a model from identical subunits that all had to be in an open state for the channel to open (although the de Young-Keizer model assumed three instead of four subunits).
Analysis of the amino acid sequence by mutation experiments have assigned functional roles to various segments, for example, the IP3 binding core (IBC) which contains an IP3 binding site has been identified. There is less information on the number and localisation of Ca2+ binding sites. Because localisation of Ca2+ binding sites by mutation studies has been difficult, Foskett et al. [31] infer various Ca2+ binding sensors from the observed co-regulation by IP3 and Ca2+, see Foskett and Mak [30] for a summary. Often models assume a certain number of IP3 and Ca2+ binding sites and represent binding and unbinding of these ligands as transitions between states regulated by mass action kinetics. This modelling approach will be described in more detail in Section 3.6.
3.2. Patch-clamp recordings
Detailed studies of individual ion channels became possible due to the development of the patch-clamp technique. Neher and Sakmann [56] were the first to detect the flow of ions through a single ion channel by measuring the resulting current at constant voltage. The time-course of opening and closing can be inferred from the detected current which stochastically jumps between zero (closed) and one or more small non-zero current levels in the pA range (open) whose sign depends on the valence of the ion and the direction of the current.
Mak and Foskett [53] recently reviewed the single-channel literature of IP3R channels. An important experimental development that they highlight relates to the difficulty that IP3Rs are naturally localised within cells rather than in the cell membrane. Whereas in earlier patch-clamp experiments, IP3R channels were studied in artificial lipid bilayers, more recently investigating IP3R in isolated nuclei is favoured because it is assumed that nuclei provide an environment similar to the endoplasmic reticulum (ER), the native domain of the IP3R.
3.2.1. Stationary data
If ligand concentrations (such as IP3, Ca2+ and ATP) are kept constant for the whole duration of the experiment we obtain stationary data. These data allow us to observe the “typical” channel dynamics for a given combination of ligands. The reason that we refer to these data as “stationary” is that we assume that the channel has fully adjusted to the concentration of ligands—the term stationary suggests that the channel has reached its stationary probability distribution, see Section 3.4. Because the stationary solution is only reached asymptotically we can, in theory, never be sure that our ion channel has actually reached equilibrium. Instead we can check if a data set is not stationary by using indicators such as the open probability. If the open probability averaged over a sufficient number of data points spontaneously changes (which indicates the switching of the channel to a different activity level) the channel may exhibit modal gating.
3.2.2. Modal gating
Spontaneous switching between different levels of channel activity at constant ligand concentrations has been observed for a long time. The earliest example is perhaps from a classical study of the large-conductance potassium channel (BK) [52, 51]. In IP3R channels modal gating was discovered only relatively recently [44]. The authors found three different modes characterised by high (H), intermediate (I) and low (L) levels of open probabilities, , and . They also realised the importance of modal gating for IP3R regulation: they observed that the same three modes seemed to exist for different combinations of ligand concentrations. Because the IP3R mostly seemed to adjust the time spent in each of the three modes they proposed that modal gating is the major mechanism of ligand regulation in IP3R channels.
One reason that the significance of modal gating has not been appreciated until recently is due to the fact that switching between different modes cannot always be recognised easily without statistical analysis. Recently, Siekmann et al. [72] developed a statistical method which for a given set of single-channel data detects switching between an arbitrary number of modes characterised by their respective open probabilities . A software implementation which is publicly available under https://github.com/merlinthemagician/icmcstat.git was applied to a large data set from Wagner and Yule [86]. Siekmann et al. [72] found that the same two modes, an inactive “park” () and an active “drive” mode (), were found across all combinations of ligands. There may be various reasons why two modes were observed rather than the three modes found in the earlier study [44], see Siekmann et al. [72] for more details. But more importantly, a detailed study of a bacterial potassium channel (KscA) [17, 16, 15] strongly suggests that the stochastic dynamics characteristic for each mode may be closely related to distinct three-dimensional configurations (conformations) of the channel. Thus, whereas it is often difficult to relate individual open or closed states in ion channel models to distinct conformations of the channel protein, the set of model states that represents a particular mode may, in fact, have a biophysical counterpart [72]. In order to confirm this hypothesis, more studies of modal gating for a variety of channels are needed.
Independent from its biophysical significance, appropriately accounting for modal gating is crucial from a modelling point of view. As we will see in Section 3.4, the phenomenon of modal gating demonstrates that a Markov process must be observed for a sufficiently long time in order to infer the correct stationary distribution, otherwise we observe a “quasi-steady state”. For example, a channel whose kinetics is restricted to an active and an inactive mode can produce intermediate activity only by switching between both modes. Thus, a model that is not capable of switching between different levels of activity is misleading because it produces a constant open probability instead of alternating between highly different open probabilities. In their recent review Mak and Foskett [53] explicitly recognise the importance of modal gating which so far has only been represented in the most recent models [84, 73].
3.2.3. Response to rapid changes of ligand concentrations
Modal gating is an aspect of stationary data collected at constant concentrations of ligands. In contrast, Mak et al. [54] designed an experiment where IP3 and/or Ca2+ concentrations in the channel environment were rapidly altered in order to simulate an instantaneous change of ligand concentrations. Switching from ligand concentration where the IP3R is inactive to conditions where the channel is maximally activated (and vice versa), enabled Mak et al. [54] to investigate the question how fast the IP3R responds to varying ligand concentrations. To illustrate the experiment let us consider the change from inhibitory to activating conditions. At an inhibitory condition, the open probability of the channel is very close to zero so that initially the IP3R is most likely closed. When changing from an inhibitory to an activating condition the channel will activate but it needs a certain time to respond to the change. In order to measure this latency, Mak et al. [54] recorded the time the channel took from when they altered the ligand concentration until the first opening. For the opposite change from activating to inhibitory conditions they analogously detected the time the channel needed to switch from a high to a low level of activity. This experiment was repeated multiple times for switching between the same conditions which enabled the authors to investigate the latency statistics. It was not only discovered that for some conditions the latencies were surprisingly long but interestingly, they also found that for some conditions the latency distributions were multi-modal which shows that multiple timescales may be observed for the same latency.
Due to the substantial effort required to perform these experiments (which have to be repeated multiple times for each condition where each repeat only gives a single data point rather than a time course) it is unsurprising that these data are very rare. In fact, to date, Mak et al. [54] is the only data set of this kind currently available. Mak and Foskett [53] explain that their data suggests that there may be long refractory periods between release events from the same IP3R which makes these results particularly relevant for the modelling of Ca2+ puffs.
3.3. Calcium puffs
So far we have only considered data recorded from single IP3Rs. In order to understand how the macroscopic flux arises from the release of many individual channels we have to consider the hierarchical nature of Ca2+ release. As reviewed by Parker et al. [57], Falcke [28], Thurley et al. [80] stochastic opening of a single IP3R channel leads to a localised Ca2+ release event (a Ca2+ blip). Such a release further sensitises neighbouring IP3R to induce more Ca2+ release through a few tightly clustered IP3R by CICR (a Ca2+ puff). Sufficiently many puffs could eventually trigger a global elevation of that is able to propagate through the entire cell (a Ca2+ wave) [55]. Thus, Ca2+ puffs play a crucial role that: not only are puffs essential for the formation of functional global Ca2+ signals [12] but they also reflect the quantal Ca2+ releases by stochastic openings of IP3R in vivo [75].
Experimentally, Ca2+ release at a specific spatial position can be initiated by triggering release of caged IP3 using a laser. A relative measure for the local Ca2+ concentration is obtained by detecting fluorescent dye bound to Ca2+ using a light microscope. For a given point within the cell the resulting time series is characterised by a sequence of stochastic spikes that are highly variable as far as the spike amplitude, the frequency and the time interval between subsequent spikes, the inter-puff interval, is concerned. From a modelling point of view, these data can be used to test wether the single-channel behaviour represented in a model is able to account for the release from a cluster of interacting IP3Rs. As explained in Section 4.1, Cao et al. [13] found that the original model by Siekmann et al. [73] was incapable of generating the correct stochastic puff distribution as long as the adaptation to different ligand concentrations was assumed to occur instantaneously. After augmenting the model so that it accounted for the latency data by Mak et al. [54] presented in the previous section the puff statistics could be reproduced accurately.
The only other model that accounts for latency data is the model by Ullah et al. [84]. Because the models by Siekmann et al. [73], Cao et al. [13] and by Ullah et al. [84] are the only models that account for all aspects of single-channel data assumed to be necessary for an understanding of the IP3R we focus on these two models and the alternative modelling approaches that they represent in Sections 3.6 and 3.7.
3.4. Aggregated continuous-time Markov models
The most natural model for the stochastic process of opening and closing of a single ion channel is the aggregated continuous-time Markov model. A good introduction to the theory reviewed here is the classical paper by Colquhoun and Hawkes [18] which also gives some simple but illustrative examples.
An aggregated continuous-time Markov model is a graph on a set of closed and open states (Figure 2).
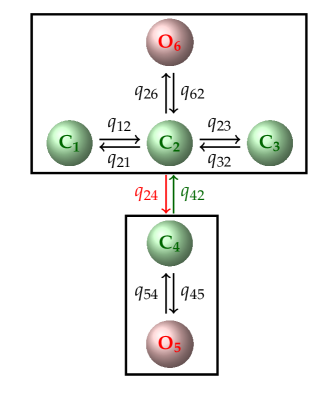
Between adjacent states and the transition rate (from to ) is given by so that the whole model is represented by a matrix with constant coefficients, the infinitesimal generator . The time-dependent probability distribution over the state set is the solution of the differential equation
| (5) |
The stochastic interpretation of (5) is as follows: for a given point in time, one particular state of the model is “active”. But how long it will take until the current state is vacated and which state will be active after a time cannot be answered with certainty (deterministically) due to the stochastic transitions between states.
For the model defined by (5) the Markov property holds both for the stochastic sequence of active states as well as for the time that it takes until the active state is left.
-
(1)
Which state will be the next active state only depends on the currently active state , not on previously active states.
-
(2)
The time it takes until the model exits from the state , also called the sojourn time in , does not depend on the time already spent in .
The second point implies that sojourn times must be exponentially-distributed because the exponential distribution is the only continuous probability distribution with this property. This explains why multiple open and closed states may be needed for accurately representing the opening and closing of ion channels.
In order to ensure that is a stochastic vector i.e. for all , the matrix must be conservative, i.e. for the diagonal elements we have
| (6) |
Provided that (6) holds, the solution
| (7) |
is a stochastic vector for all if and only if the initial distribution is a stochastic vector. From (7) the time-dependent open probability of the channel can be calculated by summing over the individual probabilities of all open states.
For large times the solution approaches a stochastic vector which is known as the stationary distribution. This means that provided we wait sufficiently long, the expected frequency of observing a state approaches a probability . Because is the solution of a differential equation, is, in fact, a stationary solution of (5) i.e. can be obtained by solving the equation
| (8) |
3.5. Estimation of Markov models from experimental data
Whereas the mathematical framework of aggregated Markov models was developed a short time after single channel data became available, the statistical estimation of these models is a topic of current research. Most commonly used are approaches based on Bayesian statistics. For a given time series of open and closed events recorded from an ion channel the conditional probability density , known as the posterior density in the Bayesian framework, is used for determining a suitable Markov model with infinitesimal generator . Note that both and are considered as random variables, thus the posterior distribution quantifies how likely a model is under the condition that data have been observed. Direct calculation of the posterior is analytically intractable and computationally prohibitive but efficient approaches for maximum likelihood estimation (MLE) i.e. estimating
| (9) |
were published in the 1990s [60, 61, 19]. Software implementations of these methods have been made available freely for academic use. Currently, the methods by Qin et al. [60, 61] can be obtained under the name QUB as standalone GUI applications at http://www.qub.buffalo.edu/. DCPROGS based on Colquhoun et al. [19] is still under active development and the source code of the most recent version has been published on github: https://github.com/DCPROGS.
An alternative approach to maximum likelihood estimation has been pursued since the late 1990s. The aim of Markov chain Monte Carlo (MCMC) is to approximate the posterior density by sampling. MCMC enables us to randomly generate a sequence of models such that the expected frequency of a model within this sequence is as large as the density . Thus, by generating a sufficient number of samples, the posterior is approximated.
The early method by Ball et al. [4] for estimation of a Markov model depends on a suitable idealisation of discretely sampled measurements to continuous open and closed times. This leads to a difficult statistical problem that has been discussed widely in the ion channel literature as the “missed events” problem. Rosales and colleagues were the first to propose a method that directly uses the discrete measurements and thus does not require further idealisation of the data [65, 64]. Their algorithm estimates a discrete-time Markov model which describes the transition probabilities between states during a sampling interval rather than the so-called infinitesimal generator . Gin et al. [36] were the first to propose a method for estimating from discretely-sampled data, their method was extended to models with arbitrary numbers of open and closed states by Siekmann et al. [74] and Siekmann et al. [70]. The current version of the software implementation of this method is available on github: https://github.com/merlinthemagician/ahmm.git. For an overview of various approaches to statistical modelling based on single-channel data, see Gin et al. [38].
The crucial advantage of MCMC methods over MLE approaches is that uncertainties can be comprehensively understood by analysing the posterior . Already marginal distributions for individual rate constants (Figure 3) are helpful for localising and quantifying uncertainties within a model .
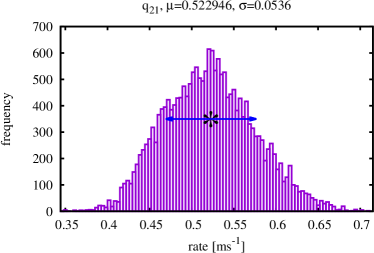
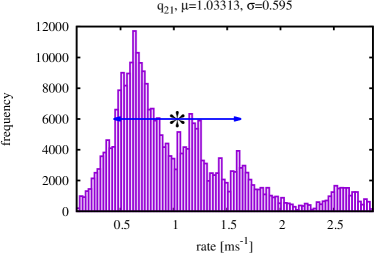
But even more can be gained by analysing statistical relationships between combinations of model parameters as, for example, demonstrated by Siekmann et al. [70]. An important drawback of aggregated Markov models is non-identifiability i.e. model structures whose parameters cannot be inferred unambiguously from experimental data. Unfortunately, non-identifiable aggregated Markov models have not been completely classified [32, 33, 11]. But non-identifiability can at least be detected by analysing the posterior distribution [70]. Thus, MCMC allows us to disentangle different causes of model uncertainty because it enables us to distinguish between parameter uncertainties due to insufficient or noisy data from pathologies in the structure of the model itself.
3.6. The Ullah et al. model
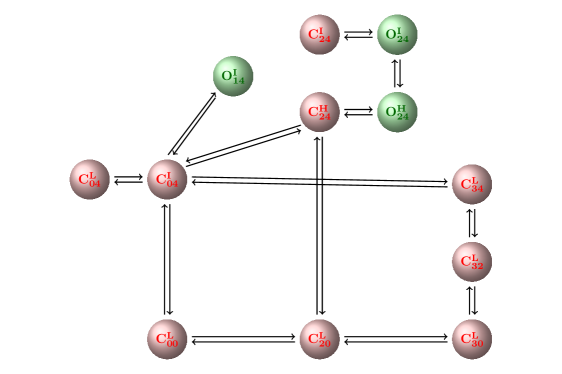
A common approach for selecting a model structure for an ion channel model (which goes back at least to the classical model by De Young and Keizer [25]) is to identify the states of the Markov model with different chemical states of the channel protein. As explained in Section 3.1, the IP3R has various binding sites that allow specific ligands such as Ca2+ and IP3 to bind to the channel protein and induce conformational changes of its three-dimensional structure. To account for this, model states are distinguished by how many particles of each ligand are bound to the channel. This assumption not only determines the state set of the model but also the possible transitions between states—in each state we can either bind a ligand to a free binding site or remove a ligand from an occupied binding site. The dynamics of binding and unbinding of ligands is modelled by the law of mass action so that, in principle, the model is completely specified by the number of binding sites for each ligand. However, in practice, such a model would be heavily overparameterised when fitted to experimental data, so it is necessary to simplify the model.
To illustrate this with an example, consider the recent model by Ullah et al. [84] which is representative for this approach. The model states in Figure 2a are arranged in a grid whose horizontal axis shows how many Ca2+ molecules are bound to the channel and whose vertical axis indicates how many IP3 binding sites are occupied. Thus, the position within the grid reflects for a specific model state how many Ca2+ ions and how many IP3 molecules, respectively, are bound to the channel. For example, neither Ca2+ nor IP3 are bound to the state C in the lower left corner whereas two Ca2+ and four IP3 binding sites are occupied for the states C, O, C and O. This is also indicated by the subscript indices—the first digit stands for the number of Ca2+ ions whereas the second digit accounts for the number of IP3 molecules bound to the channel. Figure 2a shows that of the 20 possible combinations of occupying Ca2+, ATP and IP3 binding sites only a subset of eight appears in the model. This considerable reduction is due to the removal of “low occupancy states”—Ullah et al. [83] developed a perturbation theory approach that allows them to omit states with low stationary probabilities while at the same time accounting for the delays caused by passing through these states.
The model is constructed in an iterative four step process integrating several sources of data. In a first step, Ullah et al. [84] use Ca2+ and IP3 dependency of the average open probability in order to determine a minimal set of model states. By optimising an Akaike information criterion (AIC) score function, a model with five closed, C, C, C, C and C, and one open state, O, was selected as the best fit for the data.
In a second step, the ligand-dependent average probabilities , and of being in modes characterised by three different levels of activity as well as the open probabilities in each mode (, and ) are used for assigning each of the six model states with a mode. At this step, some additional states are added because, for example, the state C must exist both in the low (C) as well as the intermediate mode (C) in order to get a good fit to the data. To account appropriately for the Ca2+ dependency of , the open probability in the intermediate mode, an additional state O had to be introduced.
In the first two steps, Ullah et al. [84] use stationary probabilities in order to determine which states should appear in the model without considering transitions between states. In step 3 the authors infer the transitions that are needed to account for the average sojourn times , and in the three modes whereas in step 4, data on the IP3R response to rapid changes in Ca2+ and IP3 (latencies) is used for determining the remaining transitions. Two additional states, C and C are introduced in order to account for the latency data.
Until this point, data is only used for determining the model structure but not for parameter estimation. The model is finally parameterised using the latency data from Mak et al. [54] or a combination of these data and single-channel time series obtained at three different constant Ca2+ concentrations.
3.7. Siekmann et al. “Park-Drive” model
The main aims of the modelling study by Siekmann et al. [73] were first to account for switching between an inactive “park” and an active “drive” mode observed in the data set by Wagner and Yule [86]. As mentioned by Mak et al. [54] and Foskett and Mak [30], Mak and Foskett [53], the importance of modal gating is well-recognised and the implications for not appropriately capturing the timescale separation of fast opening and closing and slower switching between different activity levels is obviously unsatisfactory from a modelling point of view.
Second, these data provided the possibility to build a model of two different mammalian isoforms of the IP3R, type I and type II IP3R. In addition to a comparative study of type I and type II IP3R, these data also include ligand-dependency of ATP in addition to IP3 and Ca2+.
Third, Siekmann et al. [73] followed a primarily statistical approach to inference, rather than deriving the model from a binding scheme as the model by Ullah et al. [84] discussed above. Based on the experience of the earlier study by Gin et al. [37] where similar data could be fitted satisfactorily by a model with four states and only one ligand-dependent pair of rate constants, the number of parameters required to account for binding of IP3, Ca2+ and ATP were likely to lead to a highly overparameterised model.
Due to these considerations, Siekmann et al. [73] made the inactive “park” and the active “drive” mode the construction principle of their model. In a first step, Markov models representing the stochastic dynamics for these two modes were constructed based on representative segments of the time series data that were characteristic for one of the two modes. Models with different numbers of states and model structures were fitted to these segments using the method by Siekmann et al. [74], Siekmann et al. [70]. It was observed that the best fits for either of the two modes across all combinations of ligands available in the large data set by Wagner and Yule [86] were quantitatively similar. This strongly suggested (consistent with Ionescu et al. [44]) that the dynamics within park and drive modes are ligand-independent and that ligand-dependent regulation of IP3R activity is achieved by varying the prevalence of park or drive mode.
In a second step after both park and drive mode had been modelled separately, a model of the ligand-dependent switching between the ligand-independent modes was constructed. The structure for the full Park-Drive model (Figure 2b) was found by connecting the Markov models of park and drive mode obtained previously with a pair of transition rates. Due to the infrequent switching between park and drive mode observed in the data it was decided that adding more than a single pair of transition rates was statistically unwarranted. The full Park-Drive model was then fitted to time series for all combinations of ligands of the study by Wagner and Yule [86]. The results of these fits established the ligand-dependency of modal gating by the IP3-, Ca2+- and ATP-dependent variation of the two transition rates.
Probably the most important result of this study is that only models that take into account modal gating are able to accurately capture IP3R kinetics. A channel whose kinetics is restricted to an active and an inactive mode can produce intermediate activity only by switching between both modes. Thus, a model that is not capable of switching between different levels of activity is misleading because it produces a constant open probability instead of alternating between highly different open probabilities. However, Cao et al. [13] showed that accounting for modal gating alone was insufficient for modelling stochastic Ca2+ release events (puffs) that arise from the interactions of a few IP3R channels. This study showed that the Park-Drive model has to be augmented by latency data [54] in order to account for the delayed response of individual channels to changes in ligand concentrations.
Constructing the Park-Drive model based on the two modes proved very useful in the study by Cao et al. [14]. The authors iteratively reduced the Park-Drive model to a two-state model that only approximates the dynamics of opening and closing within the modes and focuses on the level of activity determined by the relative prevalence of the modes. This further emphasises that switching between park and drive mode rather than stochastic dynamics within the modes is the most important mechanism of IP3R regulation.
3.8. Comparison of type I and type II IP3R
The experimental study by Wagner and Yule [86] not only investigated the IP3R under a wide range of ligand conditions but also contrasted the behaviour of type I and type II IP3R. In the models for type I and type II IP3R constructed by Siekmann et al. [73] at a first glance the similarities between both subtypes are probably more obvious than the differences. First of all, it is striking that both IP3R subtypes can not only be represented in the same model structure but that active and inactive modes in both channels are nearly identical. This indicates that both subtypes have the same modes and that their differences are entirely due to differences in modal gating.
4. Using data-driven IP3R models in calcium dynamics
So far we have focused on the dynamics of individual IP3Rs. In order to investigate the role of IP3Rs in calcium dynamics we will now consider the interaction of IP3Rs within a cluster.
4.1. Modeling calcium puffs using the Park-Drive IP3R model
There is a large literature on stochastic models of calcium puffs for which we refer to the recent review by Rüdiger [66]. Here we present a simple model based on the Park-Drive model [73] which is based on the following assumptions:
-
•
The ER contains sufficiently high to keep a nearly constant Ca2+ release rate through a cluster of IP3R [85]. Thus, ER dynamics is not explicitly modeled.
-
•
Ca2+ fluxes through the cell membrane have little effect on the very localised Ca2+ puffs far from cell membrane.
-
•
We compartmentalise our model to capture heterogeneity within a cluster of IP3Rs. We assume that sufficiently far away from individual channels we have a homogeneous basal Ca2+ concentration that slowly responds to the total Ca2+ flux through all IP3R channels. In the vicinity of an open IP3R channel this basal concentration is elevated by a constant ; once the channel closes it instantaneously equilibrates to the basal concentration .
Furthermore, Ca2+ buffers are not considered except a Ca2+ fluorescence dye. With these assumptions, the model is given as follows,
| (10) | ||||
| (11) |
where models the flux (mainly via diffusion and SERCA) removing Ca2+ from the puff site. represents Ca2+ leak current from the ER for stabilising the resting of (a typical value). and represent the total dye buffer concentration and Ca2+-bound dye buffer concentration respectively, and the buffering process follows the mass action kinetics. is the Ca2+ flux through open IP3R, which is modeled by the production of a constant release flux rate () and number of open IP3R channels (), i.e. . Each open IP3R will equally contribute to the elevation of cluster , . Note that the actual modulating each IP3R is either (when it is in closed states) or (when it is in open states). Parameters values are , , , , , , and [13]. The cluster is assumed to contain 10 IP3R channels.
The Park-Drive IP3R model is used to simulate IP3R state and coupled to the deterministic equations via a hybrid-Gillespie method [67]. However, the puff model based on the Park-Drive model fails to reproduce nonexponential interpuff interval (IPI) distribution due to the sole use of stationary single channel data (i.e. Ca2+ is fixed during measurement) in IP3R model construction. This does not allow the model to capture the transient single channel behaviour when Ca2+ experiences a rapid change [54, 13]. Thus, the Park-Drive model is modified by incorporating time-dependent inter-mode transitions so that the transient single channel behaviour is captured. In detail, the transition rates and are changed from constants to functions of four newly-introduced gating variables,
| (12) | ||||
| (13) |
where , , and are gating variables obeying
| (14) |
is the steady state which is a function of channel-sensed Ca2+ and IP3 concentrations and is determined by stationary single channel data (i.e. the Park-Drive model). is the rate at which the steady state is approached. This is based on the fact that a IP3R channel cannot immediately reach its steady state upon a transient change in Ca2+ concentration [54]. The values of for , and are found to be large so that the three gating variables could be approximated by their steady states i.e. , a method called quasi-steady-state approximation. However, at low should be very small, reflecting a very slow recovery of IP3R from high Ca2+ inhibition [54]. Note that when is sufficiently large, quasi-steady-state approximation applies and the modified IP3R model reduces to the original Park-Drive model. Details about the functions and parameters can be seen in [13].
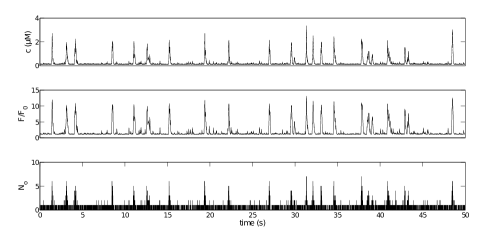
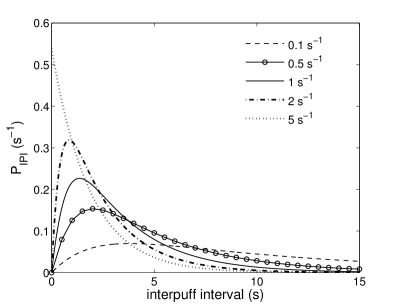
An example of simulation results using the modified Park-Drive model is give in Fig. 4. The waiting time between two successive puffs (or interpuff interval, IPI) is a key statistics to quantify the underlying process governing the emergence of puffs. Fig. 5 shows that, as at low increases, the IPI distribution changes from nonexponential to exponential, demonstrating that the missing slow time scale in the original Park-Drive model is very crucial to explain the inhomogeneous Poisson process governing puff emergence found by (Thurley et al. [81]). The IPI distributions were generated by fitting the probability density function proposed by Thurley et al. [81] to the simulated IPI histograms [13]. The proposed IPI distribution is
| (15) |
where represent IPI. is the puff rate, a measure of the typical IPI (similar to average puff frequency), and is the recovery rate.
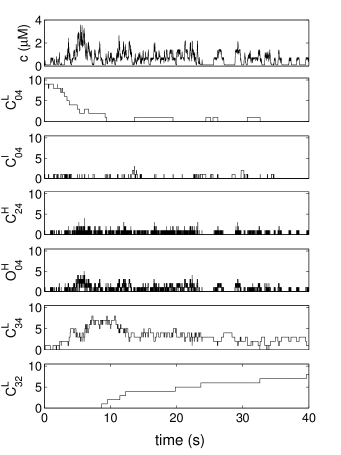
Hence, this example shows the particular importance of considering both stationary and nonstationary data when constructing an IP3R model. However, even if a model is constructed based on both data sets, it could also fail to reproduce Ca2+ puffs. One example is the Ullah model [84] as introduced in Section 3.6. A model simulation using the same puff model (10), (11) with the Ullah model is given in Fig. 6 where the Ca2+ signal behaves very irregularly and no puffs are clearly detected.
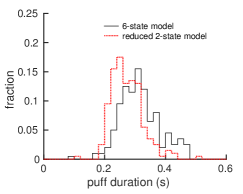
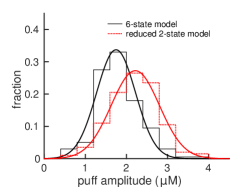
4.2. The role of modal gating of IP3R in modulating calcium signals
The Park-Drive model (and its modified version) has the feature that IP3R exist in two different modes, each of which contains multiple states, some open, some closed. Intermode transitions are important for modulating Ca2+ signals because of their ligand- and time-dependent property. However, structure within each mode may also have substantial contribution to the formation of different Ca2+ signals. Here, we examine the relative importance of intermode and intramode transitions using model reduction methods. By reducing the 6-state IP3R model to a 2-state open/closed model, we will remove the intramodal structure, and a direct comparison between the statistics generated by the two IP3R models will show the importance of intramodal structure.
The model reduction takes the following steps:
-
•
The low probabilities of , and (sum of which is less than 0.03 for any ) means that the IP3R either rarely visit those states or have very short dwell time in those states. This allows to completely remove the three states from the 6-state model.
-
•
Transitions and are far larger (about two orders of magnitude) than and . By taking a quasi-steady state approximation to the transition between and , we have . Combining and to be a new state , i.e. , the 6-state model becomes a 2-state model, where represents a partially open state with Ca2+ flux through the channel decreased by a factor of . Moreover, needs to be rescaled by due to the quasi-steady state approximation so that the effective closing rate is .
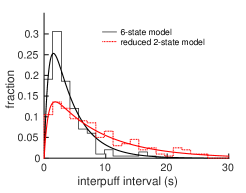
Fig. 7 shows the distributions of interpuff interval, puff duration and amplitude generated by using the 6-state IP3R model (the Park-Drive model) and the reduced 2-state model. Reducing the intramodal structure does not qualitatively change the distributions but may lead to quantitative difference, which could be caused by missing open state that significantly contributes to the fluctuations of basal level of . However, if the IP3R channel is not very sensitive to small fluctuations of basal , the quantitative difference is significantly reduced [14]. Thus, the fundamental process governing the generation of Ca2+ puffs and oscillations is primarily controlled by the modal structure but not the intramodal structure which improves the model fitting to the single-channel data.
5. Conclusions
The IP3R plays a major role in CICR. For this reason, more and more aspects of its behaviour have been investigated by experiments. It usually turned out that new types of data had to be explicitly included in a model to account for them. For example, in early models such as the de Young-Keizer model [25], the rate constants were determined by fitting to the observed at different calcium concentrations. But it soon became obvious that models parameterised with data could not be used for extrapolating the channel kinetics, i.e. the stochastic opening and closing. See Sneyd and Falcke [77] or Ullah et al. [84] for a more detailed explanation why it is impossible to infer kinetics from the ligand dependency of the open probability .
Just as kinetics cannot be inferred from it turned out that the response of the IP3R to varying ligand concentrations cannot be predicted from data collected at constant ligand concentrations. This was demonstrated by the next generation of models that were directly fitted to single-channel data, taking into account the stochastic process of opening and closing. The simplest assumption for integrating models for different ligand concentration is that the IP3R adjusts instantaneously. If this was true we could represent the channel kinetics appropriately by (to give a concrete example) simply replacing the model for the kinetics at with the model for the kinetics at calcium as we increase the calcium concentration. But Cao et al. [13] showed that only after taking into account rapid-perfusion data generated by Mak et al. [54] was the model of Siekmann et al. [73] capable of generating the correct puff distribution.
It is important to note that taking into account more data does not necessarily have to lead to more complicated models. Instead, after taking into account that the simpler kinetics of modal gating should capture the part of the channel dynamics that is most important for the functional role of the IP3R in CICR, Cao et al. [14] were able to reduce the six-state model by Siekmann et al. [73] to a two-state model. Thus, after interpreting experimental data in the right way, we are able to build models for the functional role of IP3R that are nearly as simple as the early phenomenological models.
6. Future work
After reviewing the current state of data-driven approaches to investigating the IP3R we would like to take a look at promising future directions. In order to address the particular importance of modal gating, Siekmann et al. [71] develop a novel hierarchical model structure that enables us to combine Markov models that represent the stochastic switching between modes with models that account for the characteristic opening and closing within different modes. Thus, models for both processes can be fitted separately (e.g. using the method by Siekmann et al. [74], Siekmann et al. [70]) after analysing the data with statistical method presented by Siekmann et al. [72]. This allows us to build models for modal gating following a completely data-driven approach.
More generally, we have compared two current models as representative examples for different modelling approaches, the Ullah et al. [84] and the Park-Drive model [73, 13, 14]. Although both approaches ultimately meet in the middle, their different construction principles impose different requirements for future progress. From a statistical point of view, representation of ligand interactions with a channel by mass action kinetics as in Ullah et al. [84] defines a sufficiently large search space of models. It is crucial to select from this search space an appropriately simplified model that is obtained by removing states of the full model in a consistent way. A method for model reduction is provided by Ullah et al. [83] and Ullah et al. [84] demonstrate how data can be used to statistically select from all possible simplified models. A central principle of the biophysical approach is to design models in a way that closely follows physical principles. In this context, the bond-graph approach to modelling ion channels by Gawthrop and Crampin [35], Gawthrop et al. [34] is highly relevant because it ensures that physical principles are enforced when choosing a model structure.
For models that primarily focus on a statistically satisfying representation in a first instance, the model selection problem arises again but in the other direction. Rather than starting from a model structure determined by an underlying mass action model, Gin et al. [37] and Siekmann et al. [73] iteratively increased the number of states in their model structure until further increasing the number of parameters appears statistically unwarranted. This process is time-consuming and may be computationally prohibitive if models exceed a certain number of states. Developing a method that is able to automatically compare models with an increasing number of states has proven to be difficult indicated by the few number of studies that have appeared on this subject after an early article on comparison of a finite number of models [41]. A promising new direction is the non-parametric Bayesian method developed by Hines et al. [39] which allows the authors to estimate the number of states within an ion-channel data set. Determining the required number of open and closed states in a first step may increase efficiency because it restricts the class of models which have to be compared in a second step.
Acknowledgements
Funding from NIH grant R01-DE19245 is gratefully acknowledged.
References
- Allegrini et al. [2009] Allegrini, P., L. Fronzoni, and D. Pirino (2009). The influence of the astrocyte field on neuronal dynamics and synchronization. Journal of Biological Physics 35(4), 413–423.
- Alzayady et al. [2013] Alzayady, K. J., L. E. Wagner, R. Chandrasekhar, A. Monteagudo, R. Godiska, G. G. Tall, S. K. Joseph, and D. I. Yule (2013). Functional inositol 1,4,5-trisphosphate receptors assembled from concatenated homo- and heteromeric subunits. Journal of Biological Chemistry 288(41), 29772–29784.
- Atri et al. [1993] Atri, A., J. Amundson, D. Clapham, and J. Sneyd (1993). A single-pool model for intracellular calcium oscillations and waves in the Xenopus laevis oocyte. Biophysical Journal 65(4), 1727–1739.
- Ball et al. [1999] Ball, F. G., Y. Cai, J. B. Kadane, and A. O’Hagan (1999). Bayesian inference for ion-channel gating mechanisms directly from single-channel recordings, using Markov chain Monte Carlo. Proceedings of the Royal Society of London A 455, 2879–2932.
- Barrack et al. [2014] Barrack, D. S., R. Thul, and M. R. Owen (2014). Modelling the coupling between intracellular calcium release and the cell cycle during cortical brain development. Journal of Theoretical Biology 347, 17–32.
- Barrack et al. [2015] Barrack, D. S., R. Thul, and M. R. Owen (2015). Modelling cell cycle synchronisation in networks of coupled radial glial cells. Journal of Theoretical Biology 377, 85–97.
- Bennett et al. [2006] Bennett, M. R., V. Buljan, L. Farnell, and W. G. Gibson (2006). Purinergic junctional transmission and propagation of calcium waves in spinal cord astrocyte networks. Biophysical Journal 91, 3560–3571.
- Bennett et al. [2005] Bennett, M. R., L. Farnell, and W. G. Gibson (2005). A quantitative model of purinergic junctional transmission of calcium waves in astrocyte networks. Biophysical Journal 89, 2235–2250.
- Bennett et al. [2008] Bennett, M. R., L. Farnell, and W. G. Gibson (2008). A quantitative model of cortical spreading depression due to purinergic and gap-junction transmission in astrocyte networks. Biophysical Journal 95, 5648–5660.
- Bezprozvanny et al. [1991] Bezprozvanny, I., J. Watras, and B. E. Ehrlich (1991). Bell-shaped calcium-response curves of Ins(1,4,5)P3-gated and calcium-gated channels from endoplasmic-reticulum of cerebellum. Nature 351(6329), 751–754.
- Bruno et al. [2005] Bruno, W. J., J. Yang, and J. E. Pearson (2005). Using independent open-to-closed transitions to simplify aggregated Markov models for ion channel gating kinetics. Proceedings of the National Academy of Science of the United States of America 102(16), 6326–6331.
- Callamaras et al. [1998] Callamaras, N., J. S. Marchant, X. P. Sun, and I. Parker (1998). Activation and coordination of InsP3-mediated elementary Ca2+ events during global Ca2+ signals in Xenopus oocytes. Journal of Physiology 509, 81–91.
- Cao et al. [2013] Cao, P., G. Donovan, M. Falcke, and J. Sneyd (2013). A stochastic model of calcium puffs based on single-channel data. Biophysical Journal 105, 1133–1142.
- Cao et al. [2014] Cao, P., X. Tan, G. Donovan, M. J. Sanderson, and J. Sneyd (2014, 08). A deterministic model predicts the properties of stochastic calcium oscillations in airway smooth muscle cells. PLoS Computational Biology 10(8), e1003783.
- Chakrapani et al. [2011] Chakrapani, S., J. F. Cordero-Morales, V. Jogini, A. C. Pan, D. M. Cortes, B. Roux, and E. Perozo (2011). On the structural basis of modal gating behaviour in K+ channels. Nature Structural and Molecular Biology 18(1), 67–75.
- Chakrapani et al. [2007] Chakrapani, S., J. F. Cordero-Morales, and E. Peroso (2007). A quantitative description of KscA gating II: Single-channel currents. Journal of General Physiology 130(5), 479–496.
- Chakrapani et al. [2007] Chakrapani, S., J. F. Cordero-Morales, and E. Perozo (2007). A quantitative description of KscA gating I: Macroscopic currents. Journal of General Physiology 130(5), 465–478.
- Colquhoun and Hawkes [1981] Colquhoun, D. and A. G. Hawkes (1981). On the stochastic properties of single ion channels. Proceedings of the Royal Society of London B 211, 205–235.
- Colquhoun et al. [1996] Colquhoun, D., A. G. Hawkes, and K. Srodzinski (1996). Joint distributions of apparent open and shut times of single-ion channels and maximum likelihood fitting of mechanisms. Philosophical Transactions of the Royal Society of London A 354, 2555–2590.
- De Pittà et al. [2009] De Pittà, M., M. Goldberg, V. Volman, H. Berry, and E. Ben-Jacob (2009). Glutamate regulation of calcium and IP3 oscillating and pulsating dynamics in astrocytes. Journal of Biological Physics 35(4), 383–411.
- De Pittà et al. [2011] De Pittà, M., V. Volman, H. Berry, and E. Ben-Jacob (2011, 12). A tale of two stories: Astrocyte regulation of synaptic depression and facilitation. PLoS Comput Biol 7(12), e1002293.
- De Pittà et al. [2012] De Pittà, M., V. Volman, H. Berry, V. Parpura, A. Volterra, and E. Ben-Jacob (2012). Computational quest for understanding the role of astrocyte signaling in synaptic transmission and plasticity. Frontiers in Computational Neuroscience 6.
- De Pittà et al. [2009] De Pittà, M., V. Volman, H. Levine, and E. Ben-Jacob (2009). Multimodal encoding in a simplified model of intracellular calcium signaling. Cognitive Processing 10(1), 55–70.
- De Pittà et al. [2008] De Pittà, M., V. Volman, H. Levine, G. Pioggia, D. De Rossi, and E. Ben-Jacob (2008). Coexistence of amplitude and frequency modulations in intracellular calcium dynamics. Physical Review E - Statistical, Nonlinear, and Soft Matter Physics 77(3).
- De Young and Keizer [1992] De Young, G. W. and J. Keizer (1992). A single-pool inositol 1,4,5-trisphosphate-receptor-based model for agonist-stimulated oscillations in Ca2+ concentration. Proceedings of the National Academy of Sciences 89(20), 9895–9899.
- Dupont et al. [2011] Dupont, G., E. F. L. Lokenye, and R. J. Challiss (2011). A model for Ca2+ oscillations stimulated by the type 5 metabotropic glutamate receptor: An unusual mechanism based on repetitive, reversible phosphorylation of the receptor. Biochimie 93(12), 2132 – 2138.
- Edwards and Gibson [2010] Edwards, J. and W. Gibson (2010). A model for Ca2+ waves in networks of glial cells incorporating both intercellular and extracellular communication pathways. Journal of Theoretical Biology 263(1), 45–58.
- Falcke [2004] Falcke, M. (2004). Reading the patterns in living cells – the physics of Ca2+ signaling. Advances in Physics 53(3), 255–440.
- Fedorenko et al. [2014] Fedorenko, O. A., E. Popugaeva, M. Enomoto, P. B. Stathopulos, M. Ikura, and I. Bezprozvanny (2014). Intracellular calcium channels: Inositol-1,4,5-trisphosphate receptors. European Journal of Pharmacology 739, 39 – 48. Special Issue on Calcium Channels.
- Foskett and Mak [2010] Foskett, J. K. and D.-O. D. Mak (2010). Regulation of ip3r channel gating by Ca2+ and Ca2+ binding proteins. In I. I. Serysheva (Ed.), Structure and Function of Calcium Release Channels, Volume 66 of Current Topics in Membranes, pp. 235 – 272. Academic Press.
- Foskett et al. [2007] Foskett, J. K., C. White, K. Cheung, and D. Mak (2007). Inositol trisphosphate receptor Ca2+ release channels. Physiological Reviews 87, 593–568.
- Fredkin et al. [1985] Fredkin, D. R., M. Montal, and J. A. Rice (1985). Identification of aggregated Markovian models: Application to the nicotinic acetylcholine receptor. In L. M. L. Cam and R. A. Olshen (Eds.), Proceedings of the Berkeley Conference in Honor of Jerzy Neyman and Jack Kiefer, Volume 1, Belmont, CA, pp. 269–289. Wadsworth.
- Fredkin and Rice [1986] Fredkin, D. R. and J. A. Rice (1986). On aggregated Markov processes. Journal of Applied Probability 23(1), 208–214.
- Gawthrop et al. [2015] Gawthrop, P., I. Siekmann, and E. J. Crampin (2015). A bond graph approach to chemoelectrical energy transduction in excitable membranes. in preparation.
- Gawthrop and Crampin [2014] Gawthrop, P. J. and E. J. Crampin (2014). Energy-based analysis of biochemical cycles using bond graphs. Proceedings of the Royal Society of London A: Mathematical, Physical and Engineering Sciences 470(2171).
- Gin et al. [2009] Gin, E., M. Falcke, L. E. Wagner, D. I. Yule, and J. Sneyd (2009). Markov chain Monte Carlo fitting of single-channel data from inositol trisphosphate receptors. Journal of Theoretical Biology 257, 460–474.
- Gin et al. [2009] Gin, E., M. Falcke, L. E. Wagner II, D. I. Yule, and J. Sneyd (2009). A kinetic model of the inositol trisphosphate receptor based on single-channel data. Biophysical Journal 96(10), 4053–4062.
- Gin et al. [2009] Gin, E., L. E. Wagner II, D. I. Yule, and J. Sneyd (2009). Inositol trisphosphate receptor and ion channel models based on single-channel data. Chaos: An Interdisciplinary Journal of Nonlinear Science 19(3), 037104.
- Hines et al. [2015] Hines, K. E., J. R. Bankston, and R. W. Aldrich (2015). Analyzing single-molecule time series via nonparametric Bayesian inference. Biophysical Journal 108(3), 540 – 556.
- Hituri and Linne [2013] Hituri, K. and M.-L. Linne (2013). Comparison of models for IP3 receptor kinetics using stochastic simulations. PLoS ONE 8(4), e59618.
- Hodgson and Green [1999] Hodgson, M. E. A. and P. J. Green (1999, SEP 8). Bayesian choice among Markov models of ion channels using Markov chain Monte Carlo. Proceedings of the Royal Society of London Series A-Mathematical Physical and Engineering Sciences 455(1989), 3425–3448.
- Höfer et al. [2002] Höfer, T., L. Venance, and C. Giaume (2002). Control and plasticity of intercellular calcium waves in astrocytes: A modeling approach. The Journal of Neuroscience 22(12), 4850–4859.
- Holtzclaw et al. [2002] Holtzclaw, L., S. Pandhit, D. Bare, G. Mignery, and J. Russell (2002). Astrocytes in adult rat brain express type 2 inositol 1,4,5-trisphosphate receptors. GLIA 39(1), 69–84.
- Ionescu et al. [2007] Ionescu, L., C. White, K.-H. Cheung, J. Shuai, I. Parker, J. E. Pearson, J. K. Foskett, and D.-O. D. Mak (2007). Mode switching is the major mechanism of ligand regulation of InsP3 receptor calcium release channels. Journal of General Physiology 130(6), 631–645.
- Lallouette et al. [2014] Lallouette, J., M. De Pittà, E. Ben-Jacob, and H. Berry (2014). Sparse short-distance connections enhance calcium wave propagation in a 3D model of astrocyte networks. Frontiers in Computational Neuroscience 8.
- Lavrentovich and Hemkin [2008] Lavrentovich, M. and S. Hemkin (2008). A mathematical model of spontaneous calcium(II) oscillations in astrocytes. Journal of Theoretical Biology 251(4), 553–560.
- Li et al. [2012] Li, B., S. Chen, S. Zeng, Q. Luo, and P. Li (2012). Modeling the contributions of Ca2+ flows to spontaneous Ca2+ oscillations and cortical spreading depression-triggered Ca2+ waves in astrocyte networks. PLoS ONE 7(10).
- Li and Rinzel [1994] Li, Y.-X. and J. Rinzel (1994). Equations for insp3 receptor-mediated [Ca2+]i oscillations derived from a detailed kinetic model: A Hodgkin-Huxley like formalism. Journal of Theoretical Biology 166(4), 461 – 473.
- Ludtke and Serysheva [2013] Ludtke, S. J. and I. I. Serysheva (2013). Single-particle cryo-EM of calcium release channels: structural validation. Current Opinion in Structural Biology 23, 755–762.
- Macdonald and Silva [2013] Macdonald, C. and G. Silva (2013). A positive feedback cell signaling nucleation model of astrocyte dynamics. Frontiers in Neuroengineering 6.
- Magleby and Pallotta [1983a] Magleby, K. L. and B. S. Pallotta (1983a). Burst kinetics of single calcium-activated potassium channels in cultured rat muscle. Journal of Physiology-London 344, 605–623.
- Magleby and Pallotta [1983b] Magleby, K. L. and B. S. Pallotta (1983b). Calcium dependence of open and shut interval distributions from calcium-activated potassium channels in cultured rat muscle. Journal of Physiology-London 344, 585–604.
- Mak and Foskett [2015] Mak, D.-O. D. and J. K. Foskett (2015). Inositol 1,4,5-trisphosphate receptors in the endoplasmic reticulum: A single-channel point of view. Cell Calcium 58(1), 67 – 78.
- Mak et al. [2007] Mak, D.-O. D., J. E. Pearson, K. P. C. Loong, S. Datta, M. Fernández-Mongil, and J. K. Foskett (2007). Rapid ligand-regulated gating kinetics of single inositol 1,4,5-trisphosphate receptor Ca2+ release channels. EMBO reports 8(11), 1044–1051.
- Marchant et al. [1999] Marchant, J., N. Callamaras, and I. Parker (1999). Initiation of IP3-mediated Ca2+ waves in Xenopus oocytes. EMBO Journal 18, 5285–5299.
- Neher and Sakmann [1976] Neher, E. and B. Sakmann (1976). Single-channel currents recorded from membrane of denervated frog muscle fibres. Nature 260(5554), 799–802.
- Parker et al. [1996] Parker, I., J. Choi, and Y. Yao (1996). Elementary events of InsP3-induced Ca2+ liberation in xenopus oocytes: hot spots, puffs and blips. Cell Calcium 20(2), 105 – 121.
- Parys et al. [1992] Parys, J. B., S. W. Sernett, S. DeLisle, P. M. Snyder, M. J. Welsh, and K. P. Campbell (1992). Isolation, characterization, and localization of the inositol 1,4,5-trisphosphate receptor protein in Xenopus laevis oocytes. The Journal of Biological Chemistry 267(26), 18776–18782.
- Postnov et al. [2009] Postnov, D., R. Koreshkov, N. Brazhe, A. Brazhe, and O. Sosnovtseva (2009). Dynamical patterns of calcium signaling in a functional model of neuron-astrocyte networks. Journal of Biological Physics 35(4), 425–445.
- Qin et al. [1996] Qin, F., A. Auerbach, and F. Sachs (1996). Idealization of single-channel currents using the segmental K-means method. Biophysical Journal 70(2, Part 2), MP432.
- Qin et al. [1997] Qin, F., A. Auerbach, and F. Sachs (1997). Maximum likelihood estimation of aggregated Markov processes. Proceedings of the Royal Society of London Series B-Biological Sciences 264, 375–383.
- Riera et al. [2011] Riera, J., R. Hatanaka, T. Ozaki, and R. Kawashima (2011). Modeling the spontaneous Ca2+ oscillations in astrocytes: Inconsistencies and usefulness. Journal of Integrative Neuroscience 10(04), 439–473.
- Riera et al. [2011] Riera, J., R. Hatanaka, T. Uchida, T. Ozaki, and R. Kawashima (2011). Quantifying the uncertainty of spontaneous Ca2+ oscillations in astrocytes: Particulars of Alzheimer’s disease. Biophysical Journal 101(3), 554–564.
- Rosales [2004] Rosales, R. (2004). MCMC for Hidden Markov Models incorporating aggregation of states and filtering. Bulletin of Mathematical Biology 66, 1173–1199.
- Rosales et al. [2001] Rosales, R., J. A. Stark, W. J. Fitzgerald, and S. B. Hladky (2001). Bayesian Restoration of Ion Channel Records using Hidden Markov Models. Biophysical Journal 80(3), 1088–1103.
- Rüdiger [2014] Rüdiger, S. (2014). Stochastic models of intracellular calcium signals. Physics Reports 534(2), 39 – 87. Stochastic models of intracellular calcium signals.
- Rüdiger et al. [2007] Rüdiger, S., J. Shuai, W. Huisinga, C. Nagaiah, G. Warnecke, I. Parker, and M. Falcke (2007). Hybrid stochastic and deterministic simulations of calcium blips. Biophysical Journal 93(6), 1847 – 1857.
- Seneta [1981] Seneta, E. (1981). Non-negative Matrices and Markov Chains (2 ed.). Springer Series in Statistics. New York: Springer.
- Sharp et al. [1999] Sharp, A. H., F. C. Nucifora Jr., O. Blondel, C. A. Sheppard, C. Zhang, S. H. Snyder, J. T. Russell, D. K. Ryugo, and C. A. Ross (1999). Differential cellular expression of isoforms of inositol 1,4,5-triphosphate receptors in neurons and glia in brain. Journal of Comparative Neurology 406(2), 207–220.
- Siekmann et al. [2012] Siekmann, I., E. J. Crampin, and J. Sneyd (2012). MCMC can detect non-identifiable models. Biophysical Journal 103(11), 1275–1286.
- Siekmann et al. [2015] Siekmann, I., M. Fackrell, P. Taylor, and E. J. Crampin (2015). Modelling modal gating in ion channels with hierarchical Markov models. in preparation.
- Siekmann et al. [2014] Siekmann, I., J. Sneyd, and E. J. Crampin (2014, June). Statistical analysis of modal gating in ion channels. Proceedings of the Royal Society of London A 470(2166), 20140030.
- Siekmann et al. [2012] Siekmann, I., L. E. Wagner II, D. Yule, E. J. Crampin, and J. Sneyd (2012). A kinetic model of type I and type II IP3R accounting for mode changes. Biophysical Journal 103(4), 658–668.
- Siekmann et al. [2011] Siekmann, I., L. E. Wagner II, D. Yule, C. Fox, D. Bryant, E. J. Crampin, and J. Sneyd (2011). MCMC estimation of Markov models for ion channels. Biophysical Journal 100, 1919–1929.
- Smith and Parker [2009] Smith, I. F. and I. Parker (2009). Imaging the quantal substructure of single IP3R channel activity during Ca2+ puffs in intact mammalian cells. Proceedings of the National Academy of Sciences of the USA 106(15), 6404–6409.
- Sneyd et al. [1994] Sneyd, J., A. Charles, and M. Sanderson (1994). A model for the propagation of intercellular calcium waves. American Journal of Physiology - Cell Physiology 266, C293–C302.
- Sneyd and Falcke [2005] Sneyd, J. and M. Falcke (2005). Models of the inositol trisphosphate receptor. Progress in Biophysics and Molecular Biology 89, 207–245.
- Sneyd et al. [2004] Sneyd, J., M. Falcke, J. F. Dufour, and C. Fox (2004). A comparison of three models of the inositol trisphosphate receptor. Progress in Biophysics and Molecular Biology 85, 121–140.
- Swillens et al. [1994] Swillens, S., L. Combettes, and P. Champeil (1994). Transient inositol 1,4,5-trisphosphate-induced Ca2+ release: a model based on regulatory Ca(2+)-binding sites along the permeation pathway. Proceedings of the National Academy of Sciences 91(21), 10074–10078.
- Thurley et al. [2012] Thurley, K., A. Skupin, R. Thul, and M. Falcke (2012). Fundamental properties of Ca2+ signals. Biochimica et Biophysica Acta 1820(8), 1185–1194.
- Thurley et al. [2011] Thurley, K., I. F. Smith, S. C. Tovey, C. W. Taylor, I. Parker, and M. Falcke (2011). Timescales of -evoked spikes emerge from puffs only at the cellular level. Biophysical Journal 101, 2638–2644.
- Tu et al. [2005] Tu, H., Z. Wang, and I. Bezprozvanny (2005). Modulation of mammalian inositol 1,4,5-trisphosphate receptor isoforms by calcium: A role of calcium sensor region. Biophysical Journal 88(2), 1056–1069.
- Ullah et al. [2012] Ullah, G., W. J. Bruno, and J. E. Pearson (2012). Simplification of reversible Markov chains by removal of states with low equilibrium occupancy. Journal of Theoretical Biology 311, 117–129.
- Ullah et al. [2012] Ullah, G., D.-O. D. Mak, and J. E. Pearson (2012). A data-driven model of a modal gated ion channel: The inositol 1,4,5-trisphosphate receptor in insect Sf9 cells. Journal of General Physiology 140(2), 159–173.
- Ullah et al. [2012] Ullah, G., I. Parker, D. O. D. Mak, and J. E. Pearson (2012). Multi-scale data-driven modeling and observation of calcium puffs. Cell Calcium 52, 152–160.
- Wagner and Yule [2012] Wagner, L. E. and D. I. Yule (2012). Differential regulation of the InsP3 receptor type-1 and -2 single channel properties by InsP3, Ca2+ and ATP. The Journal of Physiology 590(14), 3245–3259.
- Zeng et al. [2009] Zeng, S., B. Li, S. Zeng, and S. Chen (2009). Simulation of spontaneous Ca2+ oscillations in astrocytes mediated by voltage-gated calcium channels. Biophysical Journal 97(9), 2429–2437.