The abundance of 28Si32S, 29Si32S, 28Si34S, and 30Si32S in the inner layers of the envelope of IRC+10216
Abstract
We present high spectral resolution mid-IR observations of SiS towards the C-rich AGB star IRC+10216 carried out with the Texas Echelon-cross-Echelle Spectrograph mounted on the NASA Infrared Telescope Facility. We have identified 204 ro-vibrational lines of 28Si32S, 26 of 29Si32S, 20 of 28Si34S, and 15 of 30Si32S in the frequency range cm-1. These lines belong to bands , , , , and , and involve rotational levels with . About 30 per cent of these lines are unblended or weakly blended and can be partially or entirely fitted with a code developed to model the mid-IR emission of a spherically symmetric circumstellar envelope composed of expanding gas and dust. The observed lines trace the envelope at distances to the star (). The fits are compatible with an expansion velocity of km s-1 between 1 and 5, 11 km s-1 between 5 and 20, and 14.5 km s-1 outwards. The derived abundance profile of 28Si32S with respect to H2 is between the stellar photosphere and 5, decreasing linearly down to at 20 and to at 50. 28Si32S seems to be rotationally under LTE in the region of the envelope probed with our observations and vibrationally out of LTE in most of it. There is a red-shifted emission excess in the 28Si32S lines of band that cannot be found in the lines of bands , , , and . This excess could be explained by an enhancement of the vibrational temperature around 20 behind the star. The derived isotopic ratios 28Si/29Si, and 32S/34S are 17 and 14, compatible with previous estimates.
keywords:
line: identification — line: profiles — stars: AGB and post-AGB — circumstellar matter — stars: individual: IRC+10216 — infrared: stars1 Introduction
IRC+10216 (CW Leo) is the closest asymptotic giant branch (AGB) star to Earth ( pc; Groenewegen et al., 2012). During the last decades this star was usually considered as an isolated star with an effective temperature of K (Ridgway & Keady, 1988) and surrounded by an optically thick C-rich circumstellar envelope (CSE) composed of molecular gas and dust, which results from the ejection of stellar material at a rate (e.g., Knapp & Morris, 1985; Cernicharo et al., 1996; Schöier & Olofsson, 2001; De Beck et al., 2012). Although there were indirect evidences suggesting that it could be actually a binary system (Mauron & Huggins, 1999, 2000; Fong et al., 2013; Decin et al., 2011, 2014; Cernicharo et al., 2015a, c), Kim et al. (2014) recently reported the discovery of what could be a faint companion of the AGB star responsible of the ejected matter.
More than 80 molecular species have been detected in its CSE (e.g., Kawaguchi et al., 1995; Cernicharo et al., 2000; He et al., 2008; Patel et al., 2011). Although most of them form in the outer envelope, the so-called parent molecules (e.g., CO, C2H2, HCN, SiS, SiO, CS, SiC2, Si2C) are formed in warm and dense shells near the stellar photosphere (Keady & Ridgway, 1993; Boyle et al., 1994; Cernicharo et al., 2010, 2015b), where strong dynamical mechanisms probably exist (Hinkle et al., 1982; Bowen, 1988) and an active chemistry has been inferred (Willacy & Cherchneff, 1998; Agúndez & Cernicharo, 2006; Cherchneff, 2006). The dust formation and the subsequent gas acceleration involved in the development of the envelope (e.g., Gilman, 1972; Morris, 1987; Bowen, 1988; Fonfría et al., 2008) are supposed to be intimately related to the refractory nature and abundance of the parent molecules, in particular to C- and Si-bearing species such as SiS, SiC2, and Si2C (Cernicharo et al., 2015b). These molecules are believed to be highly depleted due to dust throughout the first outwards from the stellar photosphere (Turner, 1987; Bieging & Nguyen-Quang-Rieu, 1989; Bieging & Tafalla, 1993; Boyle et al., 1994; Lucas et al., 1995; Agúndez et al., 2012; Fonfría et al., 2014).
The emission of SiS has been analysed in the mid-infrared (Boyle et al., 1994), the submillimetre (Patel et al., 2009, 2011; Decin et al., 2010, 2014), and the millimetre frequency ranges (Morris, 1975; Henkel et al., 1983, 1985; Turner, 1987; Kahane et al., 1988, 2000; Bieging & Nguyen-Quang-Rieu, 1989; Carlström et al., 1990; Bieging & Tafalla, 1993; Lucas et al., 1995; Lucas, 1997; Cernicharo et al., 2000, 2014; Fonfría Expósito et al., 2006; Schöier et al., 2007; Agúndez et al., 2012; Fonfría et al., 2014; Velilla Prieto et al., 2015). Its abundance throughout the middle and outer envelope is reasonably well estimated ( outwards from arcsec) but its value in the innermost envelope is still controversial due to discrepancies of up to one order of magnitude between the results of several works.
The main goal of the current work is to derive a reliable SiS abundance profile for the innermost envelope of IRC+10216 in order to settle the controversy through the analysis of high spectral resolution molecular observations in the mid-IR, which has been proven as a powerful method to probe the region close to the central star (Keady et al., 1988; Keady & Ridgway, 1993; Boyle et al., 1994; Fonfría et al., 2008).
In this Paper we present the identification of 265 lines of the vibrational bands , , , , and of the silicon sulphide isotopologues 28Si32S, 29Si32S, 28Si34S, and 30Si32S observed with high-spectral resolution ( km s-1) towards IRC+10216. About 30 per cent of them have enough quality to be properly fitted and analysed. The observing procedure is included in Section 2. Comments on the fitting process of the molecular lines can be found in Section 3. The description of the observed SiS lines, the results of the fitting procedure, and their analysis are addressed in Section 4. Finally, a brief summary of the current work and our conclusions can be found in Section 5.
2 Observations
We observed IRC+10216 with the Texas Echelon-cross-Echelle Spectrograph (TEXES; Lacy et al., 2002) at the NASA Infrared Telescope Facility (IRTF) on 2002 Dec 12. We used the TEXES high resolution echelon grating with a first order grating as the cross-disperser. In this mode, a single setting covered a spectral range of m. The entire range (m) was covered with 10 separate settings. We nodded IRC+10216 off the slit for sky subtraction. The weather was good enough during the observations that the median background level measured in the off positions showed no significant variations. We used a black body-sky difference spectrum to correct for the atmosphere. The data were reduced with the standard TEXES pipeline (Lacy et al., 2002). We normalised each spectrum by removing the baseline with a polynomial fit. The rms of the random noise is per cent of the continuum emission.
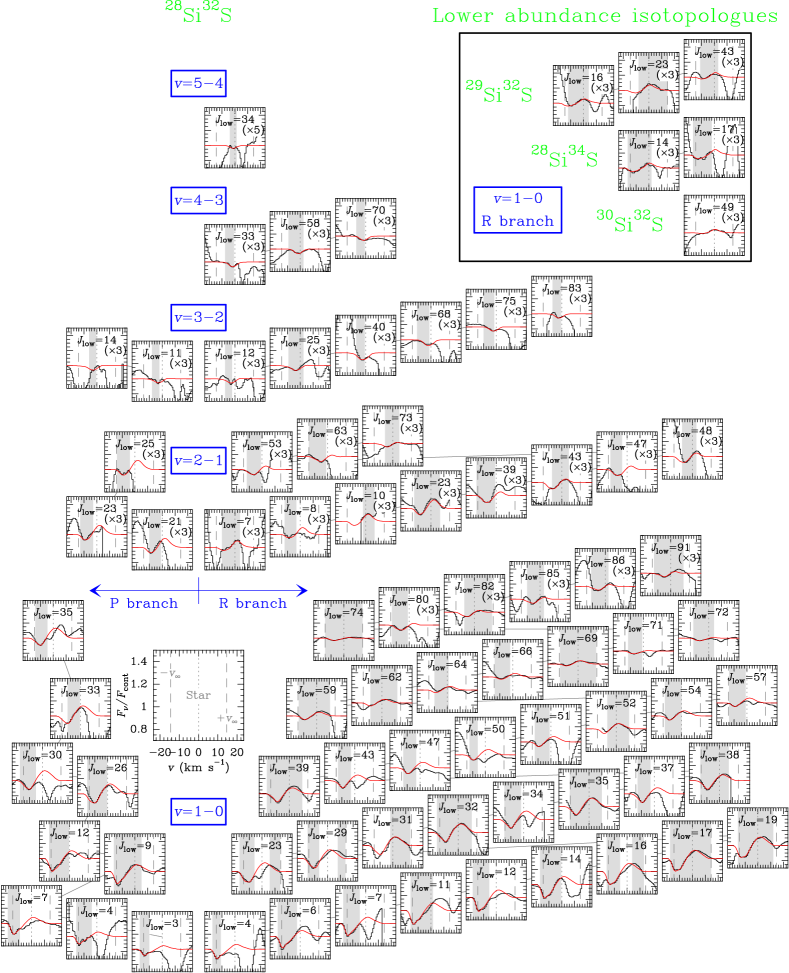
Although most of the lines in the spectrum are produced by C2H2, HCN, and their main isotopologues (Fonfría et al., 2008), we have identified 204 lines of 28Si32S, 26 of 29Si32S, 20 of 28Si34S, and 15 of 30Si32S in the frequency range between 720 to 790 cm-1. A hundred and fifteen of the 28Si32S lines belong to band , 54 to band , 13 to band , 16 of band , and 6 of band . Seventy three of them are unblended or partially blended and can be fitted (Fig. 1). The identified lines of 29Si32S, 28Si34S, and 30Si32S pertain to band . Three, two, and one of them, respectively, are unblended or partially blended and can be reasonably fitted. The lines of bands involving vibrational states with higher energy are below the detection limit. No lines of the other SiS isotopologues, which are at least 100 times less abundant than 28Si32S (e.g., Kahane et al., 2000; Cernicharo et al., 2000), have been detected in our spectrum.
We have used the low spectral resolution ISO/SWS observations carried out on 1996 May 31 (Cernicharo et al., 1999) to determine the properties of the dusty envelope. We estimate the uncertainty of these observations due to noise and the calibration process in per cent.
3 Model of envelope and fitting procedure
The observed SiS lines were fitted and analysed with the aid of the code developed by Fonfría et al. (2008), which solves numerically the radiation transfer equation of a spherically symmetric envelope composed of gas and dust in radial expansion. It was successfully used to analyse the mid-IR spectra of C2H2, HCN, C4H2, and C6H2 at 8 and m towards IRC+10216 and the protoplanetary nebula CRL618 (Fonfría et al., 2008, 2011). The code does not solve the statistical equilibrium equations, which would require a very large amount of CPU time to determine the population of all the ro-vibrational levels involved in the calculations. Instead, it makes use of rotational and vibrational temperature profiles provided by the user. The code solves the radiation transfer equation and produces the spectrum of the envelope convolved with a given Gaussian beam. The new 3D version of this code, presented in Fonfría et al. (2014), allowed us to calculate as well the emission of a simple asymmetrical envelope. A deeper insight on how this code works in its 1D and 3D versions and its benchmarking can be found in Fonfría et al. (2008) and Fonfría et al. (2014).
| Parameter | Units | Value | Error | Ref. |
|---|---|---|---|---|
| pc | 123 | — | 2 | |
| arcsec | 0.02 | — | 3 | |
| cm | — | |||
| M⊙ yr-1 | — | 4 | ||
| K | — | 3 | ||
| 0.2 | — | 5 | ||
| — | 4 | |||
| — | 4 | |||
| km s-1 | — | 1 | ||
| km s-1 | — | 4 | ||
| km s-1 | — | 4 | ||
| K | — | 6 | ||
| K | — | 6 | ||
| K | — | 6 | ||
| km s-1 | — | 7 | ||
| km s-1 | — | 8 | ||
| per cent | 95 | — | 4 | |
| per cent | 5 | — | 4 | |
| m) | 0.70 | 1 | ||
| K | 825 | 1 | ||
| 0.39 | 1 |
: distance to the star; : angular stellar radius; : linear stellar radius; : mass-loss rate; : stellar effective temperature; : abundance of He; and : positions of the inner and outer acceleration shells; : gas expansion velocity; : gas kinetic temperature; : line width; : fraction of dust grains composed of material X, i.e., amorphous carbon (AC) or silicon carbon (SiC); : dust optical depth along the line-of-sight; : temperature of dust grains; : exponent of the decreasing dust temperature power-law. The parameters for which no uncertainty has been provided (—) were assumed as fixed throughout the whole fitting process. ∗The fit to the observed SiS lines was better with this expansion velocity field in Region I and it was assumed during the whole fitting process (see Section 4.1.1). References: (1) This work (2) Groenewegen et al. (2012) (3) Ridgway & Keady (1988) (4) Fonfría et al. (2008) (5) Cox (2000) (6) De Beck et al. (2012) (7) Agúndez et al. (2012) (8) Huggins & Healy (1986).
3.1 Adopted envelope model and spectroscopic constants
In order to analyse the SiS lines identified in the observed spectrum, we adopted the model of envelope composed of several concentric shells with a constant expansion velocity derived by Fonfría et al. (2008) from the analysis of the mid-IR spectra of C2H2 and HCN, which are produced in the same region of the envelope of IRC+10216 that the observed SiS lines trace. Despite the fact that some authors used a different model with a more continuous expansion velocity profile (e.g., Schöier et al., 2006b; Decin et al., 2010, 2014; De Beck et al., 2012), the adopted model seems to be more suitable to describe the inner layers of the envelope (Keady et al., 1988; Keady & Ridgway, 1993; Boyle et al., 1994; Fonfría et al., 2008, 2014; Cernicharo et al., 2011, 2013; Agúndez et al., 2012; Daniel et al., 2012). With the aim of supporting our choice, we briefly discuss about the quality of the fits using the selected velocity profile and that recently derived by Decin et al. (2014) in Appendix A. Thus, we assumed that the CSE is divided into three Regions (I, II, and III) separated by two acceleration shells located at 5 and 20, which were initially 0.5 thick each (Table 1). The gas expansion velocity, , is initially assumed to be 5, 11, and 14.5 km s-1 in Regions I, II, and III, respectively. In order to improve the expansion velocity field close to the star, different thicks of the inner acceleration shell (ending at 5) and expansion velocities in Region I were tried. The mass conservation results in a gas density profile following very approximately the law , since a negligible amount of the total ejected mass ( per cent) is locked in the dust grains (De Beck et al., 2012; Decin et al., 2014). We assumed that there is no atomic H in gas phase (Knapp & Bowers, 1983; Glassgold, 1996; Agúndez & Cernicharo, 2006). The line width at the stellar surface is assumed to be 5 km s-1, decreasing to the terminal value of 1 km s-1 at 5 following the power-law (e.g., Huggins & Healy, 1986; Keady et al., 1988; Schöier et al., 2006a; Agúndez et al., 2012). This line width profile is compatible with the turbulent velocity km s-1 suggested by Keady et al. (1988) and Monnier et al. (2000) and the line width of km s-1 inferred from the vibrational excited lines of SiS, CS, and HCN observed in the mm and sub-mm wavelength ranges by Patel et al. (2009, 2011) and Cernicharo et al. (2011), which are supposed to be formed in the inner layers of the envelope. The kinetic temperature was adopted to follow the profile derived from the analysis of the CO emission by De Beck et al. (2012), i.e., between the stellar surface and 9, from 9 to 65, and outwards. The rotational and vibrational temperature profiles were assumed to follow , a dependence on the distance to the star tightly related to the cooling process of the envelope (McKee et al., 1982; Doty & Leung, 1997). can be different for each region and for the rotational and vibrational temperatures. cannot be determined for both the rotational and vibrational temperatures in Region III due to the low sensitivity of the model to the emission coming from that zone. Thus, we adopted and 1.0, respectively (Fonfría et al., 2008; Agúndez et al., 2012). We assumed SiS is in rotational LTE at the stellar photosphere. No dust was considered to exist in Region I. Throughout the rest of the envelope, we adopted dust grains composed of 95 per cent of amorphous carbon (AC) and 5 per cent SiC, with a size of m, and a density of 2.5 g cm-3 (Fonfría et al., 2008).
The rest frequencies of the observed lines and the energy of the vibrational states involved in the calculations (; K) were taken from the MADEX code (Cernicharo et al., 2012) and the fits presented by Velilla Prieto et al. (2015). The optical constants needed to calculate the opacity of the dust grains were taken from Rouleau & Martin (1991) for amorphous carbon and from Mutschke et al. (1999) for SiC.
3.2 Fitting procedure
The fitting procedure is based on the minimisation of the reduced function defined as
| (1) |
where and are the number of frequency channels and of parameters involved in the fitting process, and are the flux normalised to the continuum for the synthetic and observed spectra, respectively, and is the uncertainty of the observed normalised flux for each channel. In this work, was considered equal to the noise rms for all the frequency channels. We assumed a number of physical parameters related to the envelope model as fixed during the fitting process (gas expansion velocity field, H2 density, kinetic temperature, or line width, among others; see Tables 1 and 2).
| Parameter | Units | Value | Error | Ref. |
|---|---|---|---|---|
| 1 | ||||
| 1 | ||||
| — | 2 | |||
| K | — | |||
| K | 1 | |||
| K | 1 | |||
| — | 2 | |||
| K | 1 | |||
| K | 1 | |||
| K | 1 | |||
| K | 1 | |||
| K | 1 | |||
| K | 1 | |||
| K | 1 | |||
| K | 1 | |||
| K | — | 1 | ||
| K | 1 | |||
| K | — | 1 | ||
| K | — | 1 | ||
| K | 1 | |||
| K | — | 1 | ||
| K | — | 1 | ||
| — | 3 |
: abundance relative to H2; : rotational temperature; : exponent of the rotational temperature power-law outwards from ; : vibrational temperature; : exponent of the vibrational temperature power-law outwards from for all the vibrational bands. and are , where depends on the Region of the CSE and the temperature. The parameters for which no uncertainty has been provided (—) were assumed as fixed throughout the whole fitting process. ∗Linearly extrapolated from the vibrational temperature of other bands at the same position in the envelope. †This parameter is free but the fitted lines are too weak to derive a reliable error. References: (1) This work (2) Agúndez et al. (2012) (3) Fonfría et al. (2008).
The parameters related to 28Si32S derived from the fits were the abundance with respect to H2, the vibrational temperature at the stellar photosphere, and the rotational and vibrational temperatures at the inner and outer acceleration shells. The 28Si/29Si, 28Si/30Si, and 32S/34S isotopic ratios were estimated from the lines of 29Si32S, 29Si32S, and 28Si34S as scaling factors of the abundance profile of 28Si32S (Section 4.2). The fits to the lines of the SiS isotopologues were performed assuming the rotational and vibrational temperatures derived from the fits to the lines of 28Si32S. Several other parameters related to the dust component of the envelope, such as the dust optical depth or the temperature of the dust grains, were left as free parameters in order to fit the continuum and kept fixed when the SiS lines were fitted. The fits were carried out using all the observed lines from each isotopologue simultaneously. A number of observed SiS lines were slightly offset along the frequency and normalised flux level axes to get the best fit. These offsets in the normalised flux level axis are included to remove artefacts introduced during the baseline removal or due to blends with other lines coming from IRC+10216 or weak telluric lines. The offsets in the frequency axis are always smaller than the spectral resolution of the observations ( km s-1) but larger than typical with TEXES observations. The offsets have larger amplitude, although still generally less than 2 km s-1, toward higher frequencies. The line list we used is based on experimental measurements and has small errors in our spectral range ( km s-1), as expected for a simple molecule like SiS. We see slightly small amplitude frequency offsets when we looked at the atmospheric features, suggesting that the determination of the frequency scale is less precise at higher frequencies for these data.
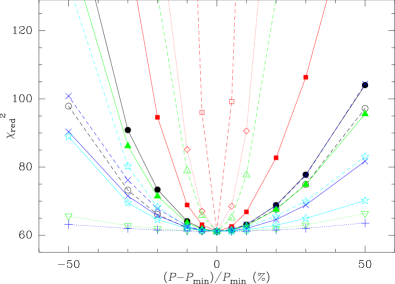
The model was sensitive to changes in most of the parameters related to SiS at distances and to dust up to . The uncertainties of the free parameters (Tables 1 and 2) were calculated by varying them until the the difference between the observed and the computed synthetic spectrum was larger than the detection limit of in each channel. This conservative decision directly affects the derived uncertainties, which could be overestimated. During this process, all free parameters were varied at the same time to account for any possible influence between them that could substantially affect the derived uncertainties. These errors reflected the sensitivity of the model to each parameter, as can be seen in the shape of the function (Fig. 2), which shows the largest curvature around its minimum (best fit) for the most influential parameters on the model (e.g., the vibrational temperature of bands and at the end of the inner acceleration shell, ). The minimum achieved during the best fit is . This large value is mostly related to contamination of the SiS lines by other features in the frequency intervals used to calculate the function. Although these differences do not severely affect the global minimisation process due to the large number of lines involved, they increase the minimum value of . This value could be diminished by modifying the frequency interval where the function is calculated for each line to remove what seems a contamination after the end of the fitting process, but this choice could compromise the objectivity of the minimisation procedure and was discarded.
4 Results and analysis
4.1 28Si32S
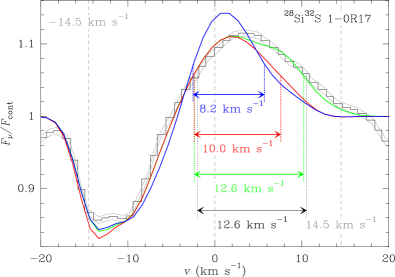
Most of the observed lines in bands and show shapes compatible with P-Cygni profiles (Fig. 1). The emission component cannot be clearly recognised in the profiles of the lines of band , although this fact can be consequence of strong overlaps with close lines. This component is insignificant in the profiles of the lines of bands and . The lines of band display typical absorption depths of per cent of the continuum emission while the lines of bands , , , and are weaker with absorption depths smaller than 5, 2.5, 1.3, and 0.7 per cent of the continuum, respectively. The maximum absorption for all the lines occurs at velocities between and km s-1. The absorption component of the lines of band with and show main contributions peaking at and km s-1 in average, respectively. The absorption component of these lines have widths of km s-1, even for the lines involving ro-vibrational levels with the highest energies. The absorption of the lines with show both absorption contributions (at and km s-1) and, consequently, the largest absorption widths ( km s-1). A width of 7 km s-1 is also found in the absorption components of the lines of band , which display their maximum between and km s-1. The absorption of the lines of bands , , and show smaller widths of km s-1, peaking between and km s-1.
The velocity of the maximum absorption and the shape of the absorption component of the lines are consequences of the expansion velocity of the emitting gas. The width of the absorption components can be produced by expansion velocity gradients, line broadening due to turbulence, the varying thermal line width due to the large temperature gradient, and the different directions along what the absorbing gas expands (more important for the gas close to the star). Thus, the absorption of the low excitation lines is mostly formed far from the star where the gas is colder and it expands at large velocities. The high excitation lines require warm gas and/or an efficient radiative pumping mechanism, conditions that are fulfilled close to the star. Hence, the absorption of the observed high excitation lines indicate that the gas in the innermost envelope expands at low velocities. The observed medium excitation lines, mostly produced between the regions where the low and high excitation lines are formed, display large absorption widths which suggest the existence of an expansion velocity gradient due to the absorption of gas at different velocities. The detailed analysis of the absorption components of the observed lines performed in the current work suggests that the actual expansion velocity profile and our choice (Section 3.1) are essentially compatible but it can be improved close to the star.
4.1.1 Improving the gas expansion velocity field
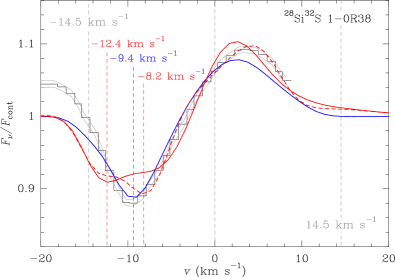
The part of the synthetic SiS line profiles arising from the gas in Regions II and III is in a reasonably good agreement with the observations. These calculations assumed the expansion velocity field initially considered in our model (Section 3.1). Although a constant gas expansion velocity of 5 km s-1 can be adopted as the average velocity in Region I (), a linear dependence between the stellar atmosphere and 5 ranging from 1 to 11 km s-1, i.e., km s-1, describes better the emission component of the 28Si32S lines of bands and (Fig. 3).
This velocity gradient gives rise to a wider emission component of the low excitation lines, although it is worth noting that the observed lines of band with show a red-shifted emission excess with respect to the synthetic lines that is not accounted by the improved expansion velocity field (see Figs. 1 and 3, and Section 4.1.4 for a discussion about this topic). Lines of bands , , and are reasonably well reproduced with both expansion velocity fields since these lines are formed close to the photosphere (Agúndez et al., 2012; Velilla Prieto et al., 2015), where the expansion velocity is expected to be low.
Hence, we used the improved expansion velocity field with the gradient in Region I in our fits.
4.1.2 28Si32S abundance with respect to H2
| Error | IR Phase | Ref. | ||||
|---|---|---|---|---|---|---|
| 4.9 | 4.9 | 1.6 | 1.3 | ∗ | 0.08 | 1 |
| 3.0 | 3.0 | 2.4 | 1.3 | Multiepoch | 2 | |
| 4.0 | 4.0 | 4.0 | 4.0 | 0.04 | 3 | |
| 19 | 17 | 1.7 | 1.7 | 4 | ||
| 51 | 33 | 2.5 | 0.5 | 5 | ||
| 7.5 | 7.5 | 7.5 | 7.5 | 6 |
The abundances are multiplied by . Their errors are provided as multiplicative/dividing factors. The pulsation phase was calculated following the analysis of the infrared light curves performed by Monnier et al. (1998). ∗See Table 2. (1) This work (2) Agúndez et al. (2012) (3) Decin et al. (2010) (4) Schöier et al. (2007) (5) Boyle et al. (1994) (6) Bieging & Nguyen-Quang-Rieu (1989)
The best fit to the whole set of lines derived assuming the envelope model presented above was achieved with a constant 28Si32S abundance with respect to H2 by number of in Region I followed by a linear decrease in Region II down to at the outer acceleration shell, and a further decrease outwards down to at 50. The 28Si32S abundance beyond the outer acceleration shell is compatible with the results by Boyle et al. (1994), Schöier et al. (2007), and Agúndez et al. (2012) within a factor of 2 and with the results by Decin et al. (2010) within up to a factor of 3, a disagreement smaller than the uncertainty they estimated for their own results (Table 3). However, our 28Si32S abundance is about 10 and 4 times smaller in Region I than the results by Boyle et al. (1994) and Schöier et al. (2007), respectively. The large discrepancy of one order of magnitude found between our derived abundance in Region I and that proposed by Boyle et al. (1994) is due to significant differences in the spectra. In the spectrum presented by Boyle et al. (1994) only the blue-shifted part of the lines, corresponding to the absorption depths, were totally covered during the observations while the emission components were largely (but not completely) missed. The emission component of most of the lines they observed was probably blended with telluric lines or features of other molecules existing in the envelope of IRC+10216. In addition, it is usually difficult to determine the baseline in spectral regions with many molecular lines, such as the region containing SiS (see figs. 1-6 in Fonfría et al., 2008). Thus, the line profiles were assumed to display no emission resulting in lines with absorption components deeper than they actually were due to the remnants of the emission components. The modelling of these lines required an exceedingly low vibrational temperature and a significant increase of the estimated 28Si32S abundance in Region I and part of Region II compared to the actual profile. Schöier et al. (2007) derived the abundance by fitting previous observations acquired with BIMA by Bieging & Tafalla (1993). These observations seem not to be affected by any instrumental effect suggesting that the disagreement between our results and those by Schöier et al. (2007) may be produced by an actual variation in the 28Si32S emission. Such variation would not be related to the stellar pulsation phase, known to influence the emission of several molecules (Carlström et al., 1990; Cernicharo et al., 2014), since both observations were carried out close to maximum light (see Table 3; Monnier et al., 1998). The abundances proposed by Bieging & Nguyen-Quang-Rieu (1989) and Decin et al. (2010), although based on observations acquired near maximum light, are affected by large errors that prevent us from deriving reliable conclusions about the time evolution. Therefore, the observed variation in the 28Si32S abundance could be the consequence of a larger time-scale change in the mass-loss rate (Cernicharo et al., 2015a, c) or the gas phase chemistry close to the star, considering that our observations were acquired about 14 yr after the observations taken by Bieging & Tafalla (1993), and the ejected gas is expected to spend about yr travelling across Region I.
The 28Si32S abundance with respect to H2 calculated with chemical models under thermodynamical equilibrium (TE) is larger than in Region I (Willacy & Cherchneff, 1998; Agúndez & Cernicharo, 2006), i.e., a factor of 2 larger than our results. The TE and chemical kinetic models give constant abundances in most of Region I and beyond, meaning that gas-phase chemical reactions involving SiS are only expected to play an important role in the vicinity of the star (e.g., Agúndez & Cernicharo, 2006). Hence, the large decrease in the SiS abundance outwards from the inner acceleration zone is probably due to depletion on to dust grains, as was suggested previously (Turner, 1987; Bieging & Nguyen-Quang-Rieu, 1989; Bieging & Tafalla, 1993; Boyle et al., 1994; Schöier et al., 2007; Agúndez et al., 2012).
4.1.3 Rotational and vibrational temperatures
The rotational temperature profile in the ground vibrational state derived from our fits throughout the dust formation zone (; e.g., Fonfría et al., 2008; Decin et al., 2010) are similar to the kinetic temperature proposed in previous works within the estimated uncertainties (Fig. 4), demonstrating that the 28Si32S molecules in the vibrational ground state is under rotational LTE throughout the first of the envelope. Moreover, our results suggest that the rotational temperature for the vibrational states to 5 can be assumed to be the same for the vibrational ground state in the region of the envelope where these vibrational states are significantly populated, i.e., at distances to the star .
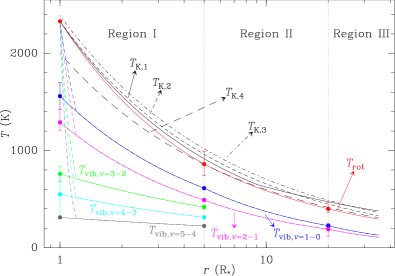
The vibrational temperatures derived from bands , , , , and are significantly smaller than the kinetic temperature (Fig. 4), which indicates that 28Si32S is vibrationally out of LTE and its vibrational states are, mainly, radiatively populated. Using the gas density profile presented in Section 3.1, we estimate the gas density at the stellar photosphere, , to be cm-3. The critical density, , at this position can be estimated with the A-Einstein coefficients of the observed 28Si32S ro-vibrational transitions, which range from 0.8 to 6.2 s-1 (the MADEX code; Cernicharo et al., 2012; Velilla Prieto et al., 2015), and the de-excitation ro-vibrational state-to-state collisional rates discussed in Velilla Prieto et al. (2015), where the calculations performed by Toboła et al. (2008) for the colliding pair 28Si32S:He were improved and extrapolated to high ro-vibrational levels. As far as we know, there is no data in the literature about ro-vibrational transitions due to collisional processes between 28Si32S and H2. Thus, we assume that the collisional rates are the same for H2 and for He, and that these rates, calculated for a kinetic temperature ranging between 300 and 1500 K, can be extrapolated up to K following the power-law . We estimate that the maximum 28Si32S ro-vibrational collisional rates ranged from to cm3 s-1 for the transitions of bands to . Hence, cm-3 at the stellar photosphere, two orders of magnitude larger than the estimated gas density. However, the analysis of the HNC emission performed by Cernicharo et al. (2013) is compatible with an H2 density very close to the star larger than cm-3 as a consequence of the matter levitation due to the stellar pulsation (Bowen, 1988; Willacy & Cherchneff, 1998; Agúndez & Cernicharo, 2006; Agúndez et al., 2012; Cherchneff, 2006), being similar or exceeding the estimated critical density (). Thus, the vibrational excitation would be dominated by collisions and 28Si32S might be vibrationally under or close to LTE in the vicinity of the stellar photosphere, meaning that the vibrational temperatures at this position we derive in the current work are significantly constrained by the power law consider to prevail throughout Region I and should be assumed as lower limits. In this case, a more realistic approach would include a new Region adjoining the photosphere of less than 1 thick (e.g., an extension of the photosphere), where the dependence of the vibrational temperature with the distance to the star would be much steeper than in the rest of Region I (Fig. 4). The larger flatness in Region I showed by , , and in comparison to the vibrational temperature derived from bands and are probably related to the lack of reliable information about the emission component of the lines of bands , , and . Thus, the vibrational temperature for these bands could be steeper than our best fit suggests throughout Region I, as the results by Velilla Prieto et al. (2015) indicate. On the other hand, the decrease experienced by the vibrational temperature in Region I when the vibrational quantum number increases ( compared to , , and so on) derived from our fits seems to be significant, as the uncertainties suggest (Table 2). This variation is probably caused by the different A-Einstein coefficients of the ro-vibrational transitions of bands to , that are about times larger than for band .
4.1.4 The red-shifted emission excess
The observed lines of the band with show a red-shifted emission excess at Doppler velocities of km s-1 with respect to the lines derived from the best fit. The affected lines involve ro-vibrational levels with energies below 700 K, suggesting that the emitting gas is located further than from the star. This scenario is compatible with the lack of an emission excess in higher excitation lines, which are mostly produced closer to the star than . A similar red-shifted emission excess was already reported by Fonfría et al. (2008) in the ro-vibrational lines of C2H2 and HCN. Interferometer observations carried out with HPBW arcsec of the lines Si34S(), H13CN(), and SiO() (Shinnaga et al., 2009; Fonfría et al., 2014) also showed red-shifted emission excesses probably produced in the dust formation zone (; e.g., Fonfría et al., 2008; Decin et al., 2010), the same region where the ro-vibrational lines presented and analysed in the current work and by Fonfría et al. (2008) are formed.
A spherically symmetric envelope model cannot reproduce the red-shifted emission excess and the absorption component of many lines at the same time. Since these absorption components highly constrain the possible structure, the expansion velocity field, and the physical and chemical conditions prevailing throughout the envelope, other models should be invoked to explain the observations. As most of the emission component of the SiS lines of the band comes from the rear part of the envelope close to the star while the absorption component is formed in front of the star, the red-shifted emission excess could be modelled assuming an asymmetric SiS abundance and/or vibrational temperature distributions. This asymmetry could be a consequence of (1) gas expanding at velocities higher than expected in the surroundings of the stellar photosphere through, e.g., the existence of an outflow behind the star (Fonfría et al., 2014), (2) the influence of the companion on the ejected matter by the AGB star by its orbital movement (Cernicharo et al., 2015a, c), or (3) an anisotropic mass loss from the AGB star.
A simple 2D envelope model can be proposed and its molecular emission calculated with our code (Fonfría et al., 2014) in order to show the feasibility of an asymmetric emission. In this model, we defined a conical region behind the star with its axis parallel to the line-of-sight, its vertex matching up with the centre of the star, and an aperture of 120∘, where the SiS abundance and the vibrational temperature for band could be different than in the rest of the envelope. These magnitudes could only depend on the distance to the star in both regions. The aperture was chosen to modify the part of the emission component of the lines of the band where the excess was found. The initial physical and chemical conditions were those derived from the best fit assuming the spherically symmetric envelope (Tables 1 and 2). In the best fit adopting the asymmetric model (see Fig. 3), the vibrational temperature of the band in the conical region behind the star was incremented from up to K at the outer acceleration shell (located at 20), following the law outwards. The variation of the SiS abundance in the conical region derived from the fitting process was negligible. This 2D envelope model did not introduce any significant modification in the synthetic lines of bands , , , and compared to the results of the spherically symmetric envelope model.
4.2 Isotopic ratios
| Ratio | Value | Error | Reference |
|---|---|---|---|
| 28Si/29Si | 17 | 1 | |
| 18 | 2 | ||
| 8.2 | 3 | ||
| 15.1 | 4 | ||
| 17.2 | 5 | ||
| — | 6 | ||
| 32S/34S | 14 | 1 | |
| 2 | |||
| 30 | 3 | ||
| 19.6 | 4 | ||
| 18.9 | 5 | ||
| 21.8 | 6 |
(1) This work (2) Agúndez et al. (2012) (3) Patel et al. (2011) (4) Patel et al. (2009) (5) He et al. (2008) (6) Kahane et al. (2000) and Cernicharo et al. (2000). The isotopic ratios by Patel et al. (2011) presented here were calculated by assuming as reliable the isotopic ratios derived from optically thin lines that do not show extended emission when possible (see table 6 of this reference).
The observed lines of 29Si32S, 28Si34S, and 30Si32S belong to band and show shapes compatible with P-Cygni profiles (Fig. 1). These lines are weak, with differences between the maximum emission and absorption of about three to four times for lines with . Most of the lines in the observed frequency range are blended with C2H2, HCN, and 28Si32S lines. Only a handful of lines over the detection limit are sufficiently isolated and can be conveniently fitted (Fig. 1). The lines of 29Si32S and 28Si34S were strong enough to derive the isotopic ratios 28Si/29Si and 32S/34S with a relatively good accuracy of and 40 per cent, respectively (Table 4). The fit to the only 30Si32S line suitable to be analysed gave an isotopic ratio 28Si/30Si of 39 with an error of 60 per cent. The lack of available lines and the large uncertainty prevent us to derive reliable conclusions about this isotopic ratio.
The ratios 28Si/29Si and 32S/34S are compatible with previous estimates derived from observations carried out in the mm wavelength range (Table 4). These observations mostly recovered the long scale emission of the envelope that comes from layers composed of matter expelled more than yr ago (Cernicharo et al., 2015c), while our observations traced gas recently ejected. Hence, no significant changes in the nucleosynthesis of the most abundant Si and S isotopes are expected to have happened during the last 1000 yr.
5 Conclusions
In this paper, we have presented high spectral resolution observations in the mid-IR range (m) towards the AGB star IRC+10216. Two hundred and four lines coming from band , , , , and of 28Si32S, 26 from of 29Si32S, 20 from of 28Si34S, and 15 from of 30Si32S have been identified in the observed spectrum. About 30 per cent of the total set of detected lines are unblended or partially blended and could be fitted and analysed. We have found that:
-
•
the quality of the fits is higher by assuming that the gas expansion velocity profile grows linearly from the photosphere up to 5 following the dependence km s-1 compared to the fits based on a constant velocity of 5 km s-1. Our fits support the expansion velocity profile proposed by Fonfría et al. (2008) outwards from 5, i.e., km s-1 and km s-1.
-
•
The abundance of 28Si32S is between the stellar photosphere and the inner acceleration shell (located at 5) and decreases linearly down to at the outer acceleration shell (at 20). The observed lines are compatible with an abundance of at 50. The decrease in the abundance beyond the inner acceleration shell is probably explained by the depletion of SiS on to the dust grains due to its refractory nature and the lack of gas-phase chemical reactions expected to be enabled in this region of the CSE.
-
•
28Si32S is vibrationally out of LTE in most of the envelope. The vibrational temperature for the vibrational ground state is K between the stellar surface and the inner acceleration shell (Region I) and K up to the outer acceleration shell (Region II). For the vibrational state, the relation is K in Region I and K in Region II. Beyond the outer acceleration shell, the vibrational temperature for these states is compatible with an exponent of . For , 3, and 4, the vibrational temperature is compatible with , , and K in Region I, respectively.
-
•
28Si32S can be assumed to be rotationally under LTE with a rotational temperature of K between the stellar photosphere and the inner acceleration shell and K outwards.
-
•
There is a red-shifted emission excess at large velocities in the 28Si32S lines of bands and not noticed in the lines of bands , , and . This excess can be explained by an asymmetry of the vibrational temperature distribution for what the gas behind the star shows a higher excitation around that mostly affects the lines of band .
-
•
The isotopic ratios 28Si/29Si and 32S/34S derived from our observations are 17 and 14, respectively. These ratios, referred to matter in the vicinity of the star, are compatible with the previously proposed values for outer shells of the envelope.
Acknowledgements
JPF was supported during part of this study by the UNAM through a postdoctoral fellowship. We thank the Spanish MINECO/MICINN for funding support through grants AYA2009-07304, AYA2012-32032, the ASTROMOL Consolider project CSD2009-00038 and the European Research Council (ERC Grant 610256: NANOCOSMOS). MJR is supported by grant AST 03-07497. Development of TEXES was supported by grants from the NSF and USRA. MJR, JHL, and others want to thank IRTF, which is operated by the University of Hawaii under Cooperative Agreement NCC 5-538 with the National Aeronautics and Space Administration, Office of Space Science, Planetary Astronomy Program. MFL thanks the University of Illinois at Urbana-Champaign and the hospitality of the Instituto de Astronomía (UNAM). We thank the unknown referee for his/her helpful comments.
References
- Agúndez & Cernicharo (2006) Agúndez M. & Cernicharo J., 2006, ApJ, 650, 374
- Agúndez et al. (2012) Agúndez M., Fonfría J. P., Cernicharo J., Kahane C., Daniel F., & Guélin M., 2012, A&A, 543, A48
- Bieging & Nguyen-Quang-Rieu (1989) Bieging J. H. & Nguyen-Quang-Rieu, 1989, ApJ, 343, L25
- Bieging & Tafalla (1993) Bieging J. H. & Tafalla M., 1993, AJ, 105, 576
- Boyle et al. (1994) Boyle R. J., Keady J. J., Jennings D. E., Hirsch K. L., Wiedemann G. R., 1994, ApJ, 420, 863
- Bowen (1988) Bowen G. H., 1988, ApJ, 329, 299
- Carlström et al. (1990) Carlström U., Olofsson H., Johansson L. E. B., Nguyen-Q-Rieu, & Sahai R., 1990, in From Miras to Planetary Nebulae, ed. M. O. Mennessier & A. Omont, (Gif-sur-Yvette: Ed. Frontières), 170
- Cernicharo et al. (1996) Cernicharo J. et al., 1996, A&A, 315, L201
- Cernicharo et al. (1999) Cernicharo J., Yamamura I., González-Alfonso E., de Jong T., Heras A., Escribano R., & Ortigoso J., 1999, ApJ, 526, L41
- Cernicharo et al. (2000) Cernicharo J., Guélin M., & Kahane C., 2000, A&AS, 142, 181
- Cernicharo et al. (2010) Cernicharo J. et al., 2010, A&A, 521, L8
- Cernicharo et al. (2011) Cernicharo J., Agúndez M., Kahane C., Guélin M., Goicoechea J. R., Marcelino N., De Beck E., & Decin L., 2011, A&A, 529, L3
- Cernicharo et al. (2012) Cernicharo J., 2012, EAS Pub. Series, 58, 251
- Cernicharo et al. (2013) Cernicharo J., Daniel F., Castro-Carrizo A., Agúndez M., Marcelino N., Joblin C., Goicoechea J. R., & Guélin M., 2013, A&A, 778, 25
- Cernicharo et al. (2014) Cernicharo J. et al., 2014, ApJ, 796, 21
- Cernicharo et al. (2015a) Cernicharo J., Marcelino N., Agúndez M., & Guélin M., 2015a, A&A, 575, A91
- Cernicharo et al. (2015b) Cernicharo J. et al., 2015b, ApJ, 806, L3
- Cernicharo et al. (2015c) Cernicharo J., Castro-Carrizo A., Quintana-Lacaci G., Agúndez M., Velilla Prieto L., Fonfría J. P. & Guélin M., submitted to the ApJ
- Cherchneff (2006) Cherchneff I., 2006, A&A, 456, 1001
- Cox (2000) Cox A. N., ed. 2000, Allen’s Astrophysical Quantities (4th ed.; New York: AIP)
- Daniel et al. (2012) Daniel F. et al., 2012, A&A, 524, A37
- De Beck et al. (2012) De Beck E. et al., 2012, A&A, 539, A108
- Decin et al. (2010) Decin L. et al., 2010, A&A, 518, L143
- Decin et al. (2011) Decin L. et al., 2011, A&A, 534, A1
- Decin et al. (2014) Decin L., Richards A. M. S., Neufeld D., Steffen W., Melnick G. & Lombaert R., 2014, arXiv:1410.2060, accepted to be published in A&A
- Doty & Leung (1997) Doty S. D. & Leung C. M., 1997, MNRAS, 286, 1003
- Fonfría Expósito et al. (2006) Fonfría Expósito J. P., Agúndez M., Tercero B., Pardo J. R., & Cernicharo J., 2006, ApJ, 646, L127
- Fonfría et al. (2008) Fonfría J. P., Cernicharo J., Richter M. J., & Lacy, J. H., 2008, ApJ, 673, 445
- Fonfría et al. (2011) Fonfría J. P., Cernicharo J., Richter M. J., & Lacy, J. H., 2011, ApJ, 728, 43
- Fonfría et al. (2014) Fonfría J. P., Fernández-López M., Agúndez M., Sánchez-Contreras C., Curiel S. & Cernicharo J., 2014, MNRAS, 445, 3289
- Fong et al. (2013) Fong D., Meixner M. & Shah R. Y., 2003, ApJ, 582, L39
- Gilman (1972) Gilman R. C., 1972, ApJ, 178, 423
- Glassgold (1996) Glassgold, 1996, ARA&A, 34, 241
- Groenewegen et al. (2012) Groenewegen M.A.T. et al., 2012, A&A, 543, L8
- He et al. (2008) He J. H., Dinh-V-Trung, Kwok S., Müller H. S. P., Zhang Y., Hasegawa T., Peng T. C., & Yuang Y. C., 2008, ApJS, 177, 275
- Henkel et al. (1983) Henkel C., Matthews H. E., & Morris M., 1983, ApJ, 267, 184
- Henkel et al. (1985) Henkel C., Matthews H. E., Morris M., Terebey S., & Fich M., 1985, ApJ, 147, 143
- Hinkle et al. (1982) Hinkle K. H., Hall D. N. B., & Ridgway S. T., 1982, ApJ, 252, 697
- Huggins & Healy (1986) Huggins P. J. & Healy A. P., 1986, ApJ, 304, 418
- Kim et al. (2014) Hyosun Kim, Ho-Gyu Lee & N. Mauron, 2014, arXiv:1412.0083 [astro-ph.SR]
- Kahane et al. (1988) Kahane C., Gómez-González J., Cernicharo J., & Guélin M., 1988, A&A, 190, 167
- Kahane et al. (2000) Kahane C., Dufour E., Busso M., Gallino R., Lugaro M., Forestini M., & Straniero O., 2000, A&A, 357, 669
- Kawaguchi et al. (1995) Kawaguchi K., Kasai Y., Ishikawa S.-I., & Kaifu N., 1995, PASJ, 47, 853
- Keady et al. (1988) Keady J. J., Hall D. N. B., & Ridgway S. T., 1988, ApJ, 326, 832
- Keady & Ridgway (1993) Keady J. J. & Ridgway S. T., 1993, ApJ, 406, 199
- Knapp & Bowers (1983) Knapp G. R. & Bowers P. F., 1983, ApJ, 266, 701
- Knapp & Morris (1985) Knapp G. R. & Morris M., 1985, ApJ, 292, 640
- Lacy et al. (2002) Lacy J. H., Richter M. J., Greathouse T. K., Jaffe D. T., & Zhu Q., 2002, PASP, 114, 153
- Lucas et al. (1995) Lucas R., Guélin M., Kahane C., Audinos P., & Cernicharo J., 1995, Ap&SS, 224, 293
- Lucas (1997) Lucas R., 1997, Ap&SS, 251, 247
- Mauron & Huggins (1999) Mauron N. & Huggins P., 1999, A&A, 349, 203
- Mauron & Huggins (2000) Mauron N. & Huggins P., 2000, A&A, 359, 707
- McKee et al. (1982) McKee C. F., Storey J. W. V., & Watson D. M., 1982, ApJ, 259, 647
- Monnier et al. (1998) Monnier J. D., Geballe T. R., & Danchi W. C., 1998, ApJ, 502, 833
- Monnier et al. (2000) Monnier J. D., Danchi W. C., Hale D. S., Tuthill P. G., & Townes C. H., 2000, ApJ, 543, 868
- Morris (1975) Morris M., 1975, ApJ, 197, 603
- Morris (1987) Morris M., 1987, PASP, 99, 1115
- Mutschke et al. (1999) Mutschke H., Andersen A. C., Clément D., Henning Th., & Peiter G., 1999, A&A, 345, 187
- Patel et al. (2009) Patel N. A. et al., 2009, ApJ, 692, 1205
- Patel et al. (2011) Patel N. A. et al., 2011, ApJS, 193, 17
- Ridgway & Keady (1988) Ridgway S. T. & Keady J. J., 1988, ApJ, 326, 843
- Rouleau & Martin (1991) Rouleau F. & Martin P. G., 1991, ApJ, 377, 526
- Schöier & Olofsson (2001) Schöier F. L. & Olofsson H., 2001, A&A, 368, 969
- Schöier et al. (2006a) Schöier F. L., Olofsson H., & Lundgren A. A., 2006a, A&A, 454, 247
- Schöier et al. (2006b) Schöier F. L., Fong D., Olofsson H., Zhang Q. & Patel N., 2006b, ApJ, 649, 965
- Schöier et al. (2007) Schöier F. L., Bast J., Olofsson H., & Lindqvist M., 2007, A&A, 473, 871
- Shinnaga et al. (2009) Shinnaga H. et al., 2009, ApJ, 698, 1924
- Toboła et al. (2008) Toboła R., Lique F., Kłos J. & Chałasiński G., 2008, J. Phys. B: At. Mol. Opt. Phys., 41, 155702
- Turner (1987) Turner B. E., 1987, A&A, 183, L23
- Velilla Prieto et al. (2015) Velilla Prieto L. et al., 2015, ApJ, 805, L13
- Willacy & Cherchneff (1998) Willacy K. & Cherchneff I., 1998, A&A, 330, 676
Appendix A Gas expansion velocity field
In order to fit the observed lines, we initially chose the expansion velocity profile derived by Fonfría et al. (2008) from the analysis of several hundreds of C2H2 and HCN lines in the mid-IR. During the current work we slightly modified this velocity profile to improve the quality of the fits to the SiS lines proving that the velocity profile derived by Fonfría et al. (2008) is essentially compatible with the actual profile. However, Decin et al. (2014) has recently published a new profile based on the analysis of high angular resolution observations (HPBW arcsec) carried out with ALMA in the submillimetre wavelength range. In this new profile, the gas expands at km s-1 between the stellar surface and 5.6 and grows linearly up to 11, where it reaches the terminal expansion velocity (profile 1; not shown). These authors also proposed a more complex profile compatible with their observations where the expansion velocity is 8 km s-1 between 8 and 10 (profile 2; not shown).
We tried to fit our observations with these new velocity profiles finding that it is not possible to get better fits than that the obtained with the profile derived in the current work (Section 4.1.1). The largest deviations of the synthetic from the observed lines appear in the lines of the ro-vibrational band with ranging from 30 to 50 (Fig. 5). The maximum absorption of these lines occurs between and km s-1. Assuming a spherically symmetric expanding envelope, the maximum absorption is produced in front of the star by the shells of the envelope located at distances to it smaller than and where the overlapping fraction between the molecular absorption of contiguous shells is maximum. A gradient in the expansion velocity field would diminish this fraction and, consequently, the optical depth, making the absorption less prominent. This diminishing could be balanced with a larger molecular abundance but it would also affect the shape of the whole absorption component. Adopting a continuous abundance profile described by its linearly connected values at 1, 5.6, and 11 for the profile 1 and at 1, 5.6, 8, 10, and 11 for the profile 2, the best fits cannot properly reproduce the absorption component of the observed lines (Fig. 5). Both profiles produce absorptions for the lines of band with comprising two velocity contributions approximately at and between and km s-1, which are produced by the gas expanding at the terminal velocity and at km s-1, respectively. However, the minima of the absorption components of the observed lines are between both contributions. The main characteristics of the absorption component of the observed lines are better explained with the expansion velocity field derived in the current work.