A comprehensive study of the open cluster NGC 6866
Abstract
We present CCD photometry of the field of the open cluster NGC 6866. Structural parameters of the cluster are determined utilizing the stellar density profile of the stars in the field. We calculate the probabilities of the stars being a physical member of the cluster using their astrometric data and perform further analyses using only the most probable members. The reddening and metallicity of the cluster were determined by independent methods. The LAMOST spectra and the ultraviolet excess of the F and G type main-sequence stars in the cluster indicate that the metallicity of the cluster is about the solar value. We estimated the reddening mag using the vs two-colour diagram. The distance modula, the distance and the age of NGC 6866 were derived as mag, pc and Myr, respectively, by fitting colour-magnitude diagrams of the cluster with the PARSEC isochrones. The Galactic orbit of NGC 6866 indicates that the cluster is orbiting in a slightly eccentric orbit with . The mass function slope was derived by using the most probable members of the cluster.
keywords:
Galaxy: open cluster and associations: individual: NGC 6866 – stars: Hertzsprung Russell (HR) diagram1 Introduction
Distributed along the Galactic disc, open clusters are members of the thin-disc component of the Milky Way Galaxy. Since the stars in an open cluster are almost at the same metallicity, distance and age, but from different spectral classes, these systems provide valuable data to study the Galactic structure, chemical composition, stellar structure and star formation processes (Friel, 1995, 2013). Thus, the structural and astrophysical parameters of open clusters such as the reddening, metallicity, distance and age have to be determined through precise photometric and spectroscopic observations. Furthermore, the stellar structure and evolution models exhibit considerable discrepancies at different parts of the observational main-sequence due to adoption of different input physics (Thompson et al., 2014). Since open clusters allow for direct comparisons of the predictions of theoretical models with observations, they provide very important tools to better understand the physical reasons behind some of these discrepancies.
The most common method used to infer the astrophysical parameters of the Galactic and extra-galactic open clusters is based on fitting stellar isochrones to the observed colour-magnitude diagrams (CMDs) and two-colour diagrams (TCDs) of the clusters. In this method, astrophysical parameters are estimated simultaneously via Bayesian statistics. However, such simultaneous statistical solutions based on comparison of stellar isochrones with the photometric observations suffer from degeneracies between parameters, causing large uncertainties in the measured reddening, metallicity (King et al., 2005; de Meulenaer et al., 2013; Janes et al., 2014), and therefore the age values.
Different approaches were suggested to break the age-reddening degeneracy in the simultaneous solutions. The main idea behind most of these suggestions is to use the maximum available wavelength range, preferably including at least one near-infrared (NIR) band (cf. Anders et al., 2004; Bridźius et al., 2008; Bilir et al., 2010; de Meulenaer et al., 2013). Anders et al. (2004) suggest that, if NIR data cannot be obtained and only observations in four passbands are available, one of the best photometric band combination for a reliable parameter determination is . Besides these suggestions, independent (traditional) and reliable methods that were developed for the determination of the reddening and metallicity, such as those recently used by Yontan et al. (2015), can be used to constrain these parameters.
Here, we focus on the CCD UBVRI observations of open cluster NGC 6866 () since it is one of the clusters located in the Kepler field (Borucki et al., 2011) and atmospheric model parameters and radial velocities for a considerable number of stars in the cluster’s field are present in the Large Sky Area Multi-Object Fiber Spectroscopic Telescope (LAMOST; Luo et al., 2012) survey. The availability of photometric and spectroscopic data allow us to calculate the cluster’s precise astrophysical and kinematical parameters. Following independent methods we find reddening and metallicity of the cluster from the stars with high membership probabilities and then keeping these two constant, we derive its distance modulus and age by fitting stellar isochrones to the observed CMDs. Although it has recently been investigated photometrically, NGC 6866 is a relatively less well-known cluster (Janes et al., 2014) as compared to the other open clusters located in the Kepler field (NGC 6811, NGC 6819 and NGC 6791). The colour excesses, distance moduli, distances and ages obtained for NGC 6866 in the previous studies are summarized in Table 1. Almost all of these studies have assumed a solar metallicity for the cluster. Mermilliod et al. (2008) measured the radial velocities of two giant stars located in the cluster field and estimated a mean radial velocity of km s-1. Frinchaboy & Majewski (2008) derived a radial velocity of 0.75 km s-1, a value in agreement with the mean velocity given by Mermilliod et al. (2008). They also found the proper motion components as and mas yr-1 for NGC 6866. Molenda-Zakowicz et al. (2009) detected 19 variable stars in the cluster field, changing apparent magnitudes from 12.1 to 17.4 and colours from 0.3 to 2.2 mag. Joshi et al. (2012) found 28 periodic variables with apparent magnitudes between 11.5 and 19.3 and colours between 0.3 and 2.1 mag. Nineteen of these systems were newly identified.
| Refs. | ||||
| (mag) | (mag) | (pc) | (Myr) | |
| 0.14 | 10.82 | 1200 | 1, 2 | |
| 230 | 3 | |||
| 0.16 | 11.10 | 4 | ||
| 650 | 5 | |||
| 0.17 | 11.33 | 1450 | 480 | 6 |
| 0.14 | 11.13 | 1380 | 560 | 7 |
| 0.10 | 11.15 | 1470 | 630 | 8 |
| 0.19 | 11.08 | 1650 | 800 | 9 |
| 0.16 | 10.98 | 1250 | 705 | 10 |
In this work, our main goal is to overcome in part the parameter degeneracy in the statistical solutions of the astrophysical parameters of NGC 6866. In Section 2, we summarize the observations and reductions. We present the CMDs, structural parameters of NGC 6866, and the membership probabilities of the stars in the cluster field in Section 3. In section 4, we measure the astrophysical parameters of the cluster. Section 5 discusses the results of the study.
2 Observations
2.1 Photometry
CCD images of the open cluster NGC 6866 and standard stars selected from Landolt (2009) were acquired on 18th July 2012 using a 1m Ritchey-Chrétien telescope (T100) located at the TÜBİTAK National Observatory (TUG)111www.tug.tubitak.gov.tr in Bakırlıtepe, Antalya/Turkey. With a relatively large CCD camera which has a field of view of about 21.521.5 arcmin, this telescope is very useful for open cluster observations. Since the observations of NGC 6866 (Fig. 1) and NGC 6811 were performed in the same night, the details of the observations and photometric reductions can be found in Yontan et al. (2015), where the photometric analyses of NGC 6811 are discussed. Below, a brief summary is given.
Short and long exposure images were obtained in each filter of the cluster’s field in order to cover the widest possible flux range. The night was moderately photometric with a mean seeing of 1′′.5. A log of observations is given in Table 2. IRAF222IRAF is distributed by the National Optical Astronomy Observatories. routines were used for pre-reduction processes of images and transforming the pixel coordinates of the objects identified in frames to equatorial coordinates. The instrumental magnitudes of the standard stars were measured utilizing the aperture photometry packages of IRAF. Atmospheric extinction and transformation coefficients for the observing system were determined from the observations of the standard stars (Landolt, 2009) through the equations given in Janes & Hoq (2013), which are a set of calibration equations to transform instrumental magnitudes to the Johnson-Cousins magnitude system. For the list of the coefficients for that particular night, see Table 2 of Yontan et al. (2015). Source Extractor (SExtractor)333SExtractor: Software for source extraction. and isophotal photometry (Bertin & Arnouts, 1996) were performed for the cluster’s field. Transformation of instrumental magnitudes to standard magnitudes was done as described in Yontan et al. (2015).
| Filter | Long Exp. time (s)N | Short Exp. time (s)N |
|---|---|---|
| 1803 | 903 | |
| 903 | 203 | |
| 603 | 53 | |
| 303 | 43 | |
| 303 | 43 |
2.2 Spectroscopy
Spectra of the stars in the direction of NGC 6866 were obtained as part of the LAMOST survey (Luo et al., 2012; Cui et al., 2012; De Cat et al., 2014, 2015a, 2015b; Ren et al., 2015). The LAMOST, also called the Guo Jing Telescope, is located at the Xinglong observatory, China. The telescope has an aperture of 4m. Its focal plane, which has a 5∘ field of view in diameter, is covered with 4000 optical fibers connected to 16 sets of multi-objective optical spectrometers with 250 optical fibers each (Wang et al., 1996; Xing et al., 1998). The spectrometer obtains low resolution spectra () in two wavelength regions, 3700-5900 and 5700-9000 Å, using two CCD cameras. LAMOST can take spectra of all objects in the field of view down to a magnitude of 17.8 simultaneously. Its capability of tracking the motion of celestial objects during about four hours while they are passing the meridian makes the LAMOST an ideal instrument to collect low-resolution spectra of the objects in the Kepler field. Spectra obtained with the LAMOST are wavelength calibrated and intensity normalized following the procedures detailed in Luo et al. (2012). For detailed information about the LAMOST, see Cui et al. (2012) and Zhao et al. (2012).
We scanned the LAMOST database in order to find the stars with spectra, which are located in our field of view, and found 31 stars for which atmospheric parameters and radial velocities were measured. We presented the KIC names and equatorial coordinates of these stars in Table 3 (see also, Fig. 7).
The stellar atmospheric parameters, e.g. effective temperature , surface gravity , and metallicity , are estimated via the stellar parameters pipeline of the LAMOST. The spectral data reduction procedure consists of three stages: LAMOST 2D pipeline works on reduction of CCD data including dark and bias subtraction, flat field correction, spectra extraction, sky subtraction, wavelength calibration, sub-exposure merging and wavelength band combination. LAMOST 1D pipeline identifies spectral type classes and measures radial velocities for star or the redshifts for galaxy or QSO using cross correlation. The pipeline produces four prime classifications, namely STAR (with released subclass), GALAXY, QSO and UNKNOWN, LAMOST Stellar Parameter pipeline (LASP; Wu et al., 2015; Luo et al., 2015), automatically derives the stellar parameters for late A and FGK type stellar observation from LAMOST survey stars. The LASP consecutively adopts correlation function interpolation (CFI; Du et al., 2012) method and Université de Lyon Spectroscopic analysis Software (ULySS; Koleva et al., 2009; Wu, 2009; Wu et al., 2011) method to determine the stellar parameters. The LASP first uses CFI method to get an initial coarse guess for , , that serve as the starting values for ULySS, then ULySS determines the parameters by minimizing the values between the observation and the template spectra which were generated by an interpolator built on the empirical ELODIE stellar library (Prugniel & Soubiran,, 2001). Details for the spectral analysis and propagated errors can be found in Luo et al. (2015).
| ID | KIC | Date | SNR | ||||
|---|---|---|---|---|---|---|---|
| (hh:mm:ss.ss) | (∘ ′ ′′) | (mag) | (mag) | ||||
| 1 | 8329578 | 20:03:00.39 | +44:16:54.13 | 13.519 | 0.728 | 25.10.2013 | 78 |
| 2 | 8329629 | 20:03:04.09 | +44:14:15.65 | 12.588 | 0.267 | 25.09.2013 | 186 |
| 3 | 8128952 | 20:03:04.83 | +43:59:58.60 | 13.786 | 0.568 | 25.09.2013 | 74 |
| 4 | 8263825 | 20:03:12.47 | +44:06:59.03 | 13.445 | 0.842 | 25.10.2013 | 87 |
| 5 | 8329888 | 20:03:22.22 | +44:16:57.95 | 12.162 | 0.295 | 25.10.2013 | 182 |
| 6 | 8329894 | 20:03:22.81 | +44:15:50.46 | 11.578 | 1.030 | 25.09.2013 | 166 |
| 7 | 8264037 | 20:03:26.11 | +44:10:05.45 | 11.755 | 0.356 | 25.09.2013 | 208 |
| 8 | 8264075 | 20:03:28.33 | +44:07:55.26 | 13.784 | 0.393 | 25.10.2013 | 66 |
| 9 | 8264148 | 20:03:32.47 | +44:06:46.17 | 14.032 | 0.479 | 25.09.2013 | 60 |
| 10 | 8330092 | 20:03:34.92 | +44:14:50.16 | 13.548 | 0.439 | 25.09.2013 | 89 |
| 11 | 8197368 | 20:03:44.34 | +44:05:39.30 | 12.777 | 0.475 | 25.10.2013 | 137 |
| 12 | 8330251 | 20:03:45.04 | +44:15:19.86 | 13.321 | 0.688 | 25.09.2013 | 102 |
| 13 | 8129588 | 20:03:45.24 | +43:59:22.51 | 13.207 | 0.341 | 25.10.2013 | 114 |
| 14 | 8197440 | 20:03:48.06 | +44:02:48.38 | 12.943 | 0.674 | 25.10.2013 | 137 |
| 15 | 8264534 | 20:03:54.16 | +44:06:46.04 | 12.628 | 0.222 | 25.09.2013 | 169 |
| 16 | 8264581 | 20:03:57.12 | +44:08:16.86 | 13.509 | 0.436 | 25.09.2013 | 103 |
| 17 | 8330453 | 20:03:57.80 | +44:16:32.51 | 12.804 | 0.738 | 25.09.2013 | 131 |
| 18 | 8264617 | 20:03:59.33 | +44:10:25.84 | 13.975 | 0.439 | 25.09.2013 | 79 |
| 19 | 8264674 | 20:04:02.84 | +44:11:55.63 | 11.164 | 0.251 | 25.09.2013 | 328 |
| 20 | 8330543 | 20:04:03.64 | +44:15:34.07 | 13.219 | 0.551 | 25.10.2013 | 99 |
| 21 | 8264698 | 20:04:03.95 | +44:10:20.72 | 12.356 | 0.318 | 25.09.2013 | 197 |
| 22 | 8197761 | 20:04:09.30 | +44:04:16.39 | 10.639 | 0.338 | 25.09.2013 | 329 |
| 23 | 8396247 | 20:04:09.36 | +44:19:10.03 | 13.835 | 1.852 | 25.09.2013 | 36 |
| 24 | 8330778 | 20:04:16.17 | +44:12:04.66 | 13.468 | 0.379 | 25.10.2013 | 118 |
| 25 | 8330790 | 20:04:16.73 | +44:12:43.66 | 13.143 | 0.314 | 25.09.2013 | 161 |
| 26 | 8264949 | 20:04:18.36 | +44:09:52.47 | 12.122 | 0.302 | 25.09.2013 | 235 |
| 27 | 8265068 | 20:04:25.50 | +44:10:16.54 | 12.029 | 0.333 | 25.09.2013 | 282 |
| 28 | 8198114 | 20:04:32.20 | +44:05:12.84 | 13.728 | 0.660 | 25.09.2013 | 71 |
| 20 | 8265356 | 20:04:43.26 | +44:08:02.05 | 12.367 | 0.611 | 17.10.2013 | 93 |
| 30 | 8331290 | 20:04:44.09 | +44:15:05.77 | 14.059 | 0.691 | 25.09.2013 | 54 |
| 31 | 8265377 | 20:04:44.37 | +44:08:58.53 | 13.170 | 0.315 | 25.09.2013 | 117 |
| ID | ||||||||||
|---|---|---|---|---|---|---|---|---|---|---|
| (hh:mm:ss.ss) | (dd:mm:ss.ss) | (mag) | (mag) | (mag) | (mag) | (mag) | (mas yr-1) | (mas yr-1) | (%) | |
| 1 | 20:02:57.52 | +44:11:17.39 | 18.4540.017 | 1.4450.270 | 1.3810.036 | 0.9020.022 | 0.6760.019 | |||
| 2 | 20:02:57.53 | +44:04:17.23 | 18.5460.018 | 1.1630.182 | 1.1490.033 | 0.6850.024 | 0.6970.023 | |||
| 3 | 20:02:57.58 | +44:14:51.51 | 18.3190.015 | 0.7030.097 | 1.0330.026 | 0.6370.021 | 0.6430.021 | |||
| 4 | 20:02:57.74 | +44:09:23.85 | 18.8730.021 | 0.8490.154 | 1.0820.037 | 0.6230.029 | 0.7430.028 | |||
| 5 | 20:02:57.77 | +44:12:06.25 | 16.6120.005 | 0.6070.029 | 1.0020.008 | 0.6070.007 | 0.6110.007 | 9.06.7 | 1.26.7 | 32 |
| .. | ……….. | ……….. | ……………. | …………… | …………… | …………… | …………… | ………… | …………. | …. |
3 Data analysis
3.1 Identification of stars and photometric errors
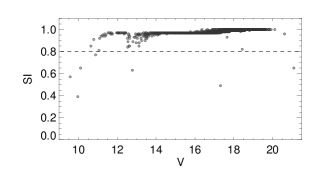
We identified 2096 sources in the field of NGC 6866 and constructed a photometric and astrometric catalogue. The stellarity index (SI) provided by SExtractor (Bertin & Arnouts, 1996) was used to detect non-stellar objects, most likely galaxies, in our catalogue. The SI has values between 0 and 1. According to Bertin & Arnouts (1996), a source with the SI close to 1 is a point source (most probably a star), while an extended object has an SI close to zero. Application of the SI to the stellar fields can be found in Andreuzzi et al. (2002) and Karaali et al. (2004) who showed that the objects with an SI smaller than 0.8 can be assumed to be extended objects. Thus we adopted that the objects with an SI larger than 0.8 are most probably stars. The apparent magnitude versus SI diagram of 2096 objects is plotted in Fig. 2. Resulting catalogue contains 2089 stars. Individual stars in the final photometric catalogue are tabulated in Table 4. The columns of the table are organized as ID, equatorial coordinates, apparent magnitude, colours, proper motion components and the probability of membership. The proper motions of the stars were taken from the astrometric catalogue of Zacharias et al. (UCAC4; 2013).
| Mag. Range | ||||||
|---|---|---|---|---|---|---|
| 18 | 0.001 | 0.002 | 0.002 | 0.002 | 0.002 | |
| 39 | 0.001 | 0.002 | 0.002 | 0.002 | 0.002 | |
| 65 | 0.001 | 0.004 | 0.001 | 0.002 | 0.002 | |
| 109 | 0.002 | 0.011 | 0.003 | 0.002 | 0.003 | |
| 192 | 0.003 | 0.022 | 0.005 | 0.004 | 0.004 | |
| 320 | 0.005 | 0.039 | 0.009 | 0.007 | 0.007 | |
| 560 | 0.009 | 0.083 | 0.016 | 0.013 | 0.012 | |
| 608 | 0.016 | 0.150 | 0.030 | 0.023 | 0.021 | |
| 178 | 0.027 | 0.183 | 0.050 | 0.037 | 0.035 |
The errors of the measurements in the band and , , , and colours are shown in Fig. 3 as a function of the apparent magnitude. Mean errors in the selected magnitude ranges are listed in Table 5. The errors are relatively small for stars with , while they increase exponentially towards fainter magnitudes. Thus, we decided to use stars with mag for further analysis. With this selection, the number of remaining stars for analysis is 1301 in the field of NGC 6866. As expected, the largest errors for a given magnitude occurred in the colours of the stars.

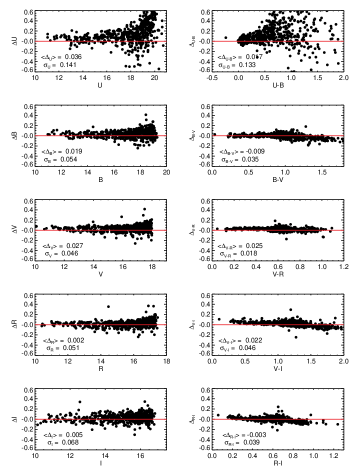
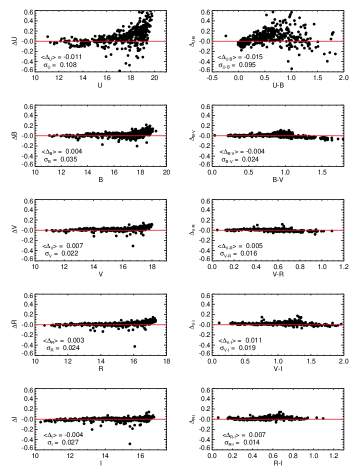
We compared our photometric measurements with those of Joshi et al. (2012) and Janes et al. (2014) who utilized the same photometric bands, i.e. , in their investigations. A cross-match of our catalogue with these two catalogues resulted in 800 stars for Joshi et al. (2012) and 429 stars for Janes et al. (2014). Comparisons between our and their datasets are shown in Fig. 4 and Fig. 5. In these figures, values on the abscissae refer to our measurements, while the magnitude or colour differences in the ordinates present the differences between the our and their catalogues. The means and the standard deviations of the magnitudes and colours obtained from the differences are small except for the standard deviations of and , i. e. and mag in the comparison with the Joshi et al. (2012) and and mag in the comparison with the Janes et al. (2014). Note that the large mean differences and standard deviations calculated for the magnitudes and colours are due to faint field stars beyond mag, for which the data are not used in the derivation of the cluster parameters. Agreement between our study and Janes et al. (2014) is much better than that with the study of Joshi et al. (2012).
3.2 Cluster radius and radial stellar surface density
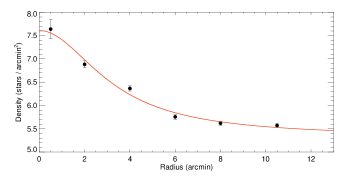
We estimated the stellar density profile of the open cluster NGC 6866 using stars with mag in the field. The central coordinates of the cluster were assumed to be as given in WEBDA444http://www.univie.ac.at/webda/ database (, ). We then calculated the stellar density in an area defined by a circle with a radius of 1 arcmin and centered on these coordinates. From this central circle, we calculated the variation of stellar density using annuli with width of 2 arcmin. The last annulus had a width of 3 arcmin because of a significant decrease in the number of stars. The resulting stellar density profile of the cluster is plotted in Fig. 6.
We fitted this density profile with the King (1962) model defined as:
| (1) |
where is the radius of the cluster centered at the celestial coordinates given above. , and denote the background stellar density, the central stellar density and the core radius of the cluster, respectively. We fitted the King model to the observed radial density profile for NGC 6866 and used a minimization technique to determine , and . The best fit to the density profile is shown with a solid line in Fig. 6. We estimated the central stellar density and core radius of the cluster, and the background stellar density as 0.02 stars arcmin-2, 0.04 arcmin and 0.01 stars arcmin-2, respectively.
Joshi et al. (2012) estimated the central stellar density and core radius of the cluster, and the background stellar density as 0.7 stars arcmin-2, 0.5 arcmin and stars arcmin-2, respectively, while Janes et al. (2014) found stars arcmin-2, arcmin and stars arcmin-2, respectively. Structural parameters in this study are generally in agreement with those in Joshi et al. (2012) whereas they are not in agreement with those in Janes et al. (2014). This is most likely caused by the selection made by Janes et al. (2014) since they considered only 75 stars of 11-16 mag within a circular field of 3 arcmin radius from the cluster’s centre.
3.3 CMDs and membership probabilities
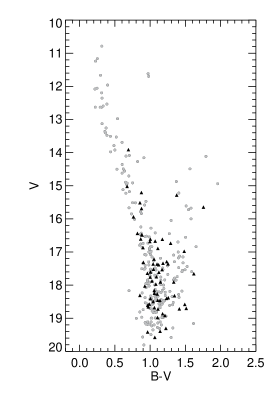
In order to derive the parameters of NGC 6866, we used its CMDs in Fig. 7, i.e. vs , vs , vs and vs . An inspection by eye suggests that the cluster is rather sparse. Since most of the stars brighter than mag are lying along a sequence, we conclude that these stars are probably representing the main-sequence of the cluster. On the contrary, most of the stars fainter than mag are field stars. In order to confirm this conclusion we selected a circular area of the core radius and an annulus between 10.5 and 11 arcmin from the centre of the cluster. We found 237 and 67 stars in the circular area and the annulus, respectively, and presented their positions in the vs CMD in Fig. 8 demonstrating that most of the stars close to the cluster centre are generally brighter than 17 mag and lying along the cluster’s main-sequence, as indicated above. However, the stars in the annulus are mostly fainter than 17 mag and they are probably field stars.
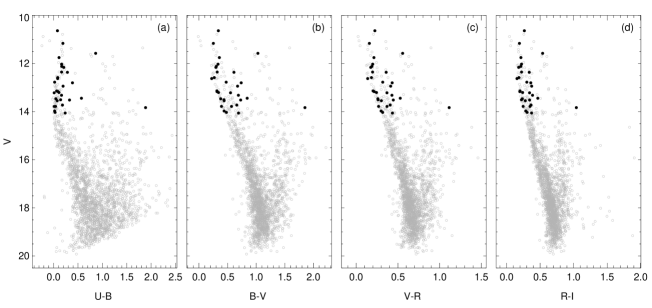
For relatively old clusters like NGC 6866, the red clump (RC) stars in their CMDs can be very useful to determine their distances and ages since they have been utilized as standard candles for distance estimates (i.e. Paczynski & Stanek, 1998; Cabrera-Lavers et al., 2005, 2007; Bilir et al., 2013a; Karaali et al., 2013; Yaz Gökçe et al., 2013). The RC stars in vs CMD can be identified in the colour range mag and the absolute magnitude range mag (Bilir et al., 2013b). Here, denotes the de-reddened colour. Indeed, there are stars in these colour and apparent magnitude ranges in Fig. 7. If they are members of the cluster, these RC stars can be used to confirm the distance estimation of NGC 6866. On the other hand, the position of another small group of bright and blue stars in the CMDs suggests that the turn-off point of the cluster lie within mag and mag.
Although identifying some stars near the RC region and turn-off point of the CMDs is very promising for the analysis, we can not confidently use these stars for further analysis without knowing if they are physical members of the cluster. In addition, determining the likely members of the cluster can be very useful to clearly demonstrate the cluster’s main-sequence. Thus, the probabilities of the stars in the field being physical members of the cluster must be estimated. For the membership probabilities of the individual stars, we employed the method given by Balaguer-Núnez et al. (1998). This method takes both the errors of the mean cluster and the stellar proper motions into account. The basic idea of the non-parametric method for the cluster-field separation in the 2-dimensional proper motion space is the empirical determination of the cluster and field stars’ distributions without any assumption about their shape. We used the kernel estimation technique (with a circular Gaussian kernel function) to derive the data distributions. The proper motions of the stars were taken from the UCAC4 catalogue. Additionally, we compared the results with those of the algorithm published by Javakhishvili et al. (2006), yielding excellent agreement. For this, we considered rectangular coordinates of the stars in the field, measured in two epochs, first of our observations and second the UCAC4 ones. The histogram of the differences efficiently discriminate the members from non-members.
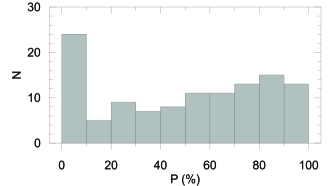
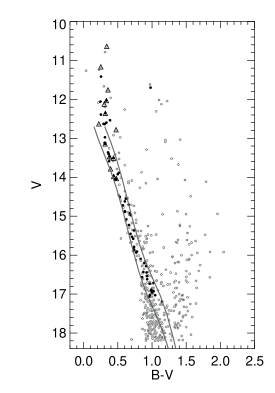
In order to determine the most likely members of the cluster we applied the following procedure. First, we selected only the stars in a circle with a radius of 6 arcmin whose centre coincides with the cluster’s centre. The selected radius of 6 arcmin corresponds to about two times the core radius of the cluster. As can be seen from Fig. 6, the field stars are dominant beyond this radius. The median value of the membership probabilities of these stars is found as . The histogram of the probabilities is shown in Fig. 9. Second, in order to identify the main-sequence stars of the cluster, we fitted the zero age main-sequence (ZAMS) of Sung et al. (2013) for solar metallicity to the vs CMD of NGC 6866 for 12.75 17 mag using only the stars with . The faint apparent magnitude limit was assumed to be mag as the proper motions could be obtained only for the stars brighter than this magnitude. By shifting the fitted main-sequence to brighter magnitudes by 0.75 mag, a band like region in vs CMD (see Fig. 10) was obtained to cover the binary stars, as well. However, we found visually out that the stars brighter than mag have already left the ZAMS. Thus, we conclude that this magnitude roughly corresponds to the turn-off point of the cluster. Hence, we assumed that all stars brighter than 12.75 mag, which are located in the circle defined above and having a probability of membership larger than , are the most likely members of the cluster. Finally, we assumed that all stars with a membership probability and located within the band-like region defined above are the most likely members of NGC 6866 on the main-sequence. With this procedure, we identified 64 stars which are used for further analyses. These stars are indicated with black dots in Fig. 10.
4 Determination of the astrophysical parameters of NGC 6866
4.1 The reddening
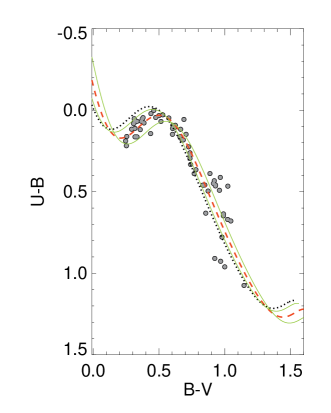
Before the determination of the metallicity of the cluster using photometric observations, its reddening should be estimated. Thus, for the determination of the colour excesses and , we used the 64 probable members of the cluster selected according to the procedure in Section 3.3. We compared the positions of these stars in the vs TCD with the ZAMS of Sung et al. (2013) with a solar metallicity. In order to do this, we shifted the de-reddened main-sequence curves of Sung et al. (2013) within the range mag with steps of 0.001 mag until it fits well with the vs TCD of NGC 6866. The shift in the axis was calculated by adopting the following equation (Hiltner & Johnson, 1956):
| (2) |
To define the goodness of the fit we adopted the minimum method. Fig. 11 shows the vs TCD of NGC 6866 for the 64 probable members of the cluster. In Fig. 11, the dashed red line represents the reddened ZAMS of Sung et al. (2013) while the black dotted line shows the de-reddened ZAMS of the cluster and green lines the deviations. This method gives the following colour excesses: and mag. The errors indicate the deviations. In order to evaluate the and colour excesses we usedthe following equations of Cardelli et al. (1989):
| (3) | |||
The colour excesses calculated are and mag.
4.2 Metallicity and radial velocity from the LAMOST spectra
Stars with the LAMOST spectra which are located in a circle of 6 arcmin radius from the centre of the cluster were used to derive the mean radial velocity and the metallicity of the cluster. The effective temperatures , surface gravities , metallicities and radial velocities of these stars are listed in Table 6. These stars are also indicated with green circle in Fig. 10.
Median metallicities and radial velocities of 14 stars in Table 6 are dex and km s-1, respectively. Six stars out of 14 have the membership probabilities larger than 50. Considering these six stars, we conclude that the median metallicity and the radial velocity of NGC 6866 are dex and km s-1, respectively. Radial velocity of the cluster measured in this study is in agreement with the radial velocities derived by Mermilliod et al. (2008) and Frinchaboy & Majewski (2008), where using only two stars in each study, and km s-1 are given, respectively. We note that a comparison revealed that there are no common stars between our sample and the stars used in the other two studies.
| KIC | |||||
|---|---|---|---|---|---|
| () | (K) | (cgs) | (dex) | (km s-1) | |
| 8197761 | 00 | 715377 | 4.020.32 | -0.040.09 | -29.1224.47 |
| 8264534 | 27 | 827083 | 3.870.34 | -0.030.10 | -6.4820.51 |
| 8264674 | 36 | 823259 | 3.860.32 | -0.120.08 | 9.4720.87 |
| 8264698 | 61 | 773064 | 3.980.35 | -0.150.13 | 12.9232.76 |
| 8264949 | 00 | 772653 | 3.890.34 | -0.160.11 | 11.5929.85 |
| 8264148 | 40 | 6977152 | 4.090.33 | -0.060.16 | 14.1022.80 |
| 8264581 | 90 | 7337113 | 3.660.38 | 0.620.10 | 10.2517.00 |
| 8264037 | 00 | 724492 | 3.970.36 | -0.040.11 | 5.2929.05 |
| 8330790 | 94 | 766969 | 4.050.33 | -0.090.13 | -22.7932.92 |
| 8264617 | 76 | 7177139 | 4.110.32 | -0.200.16 | 10.9025.28 |
| 8265068 | 75 | 757050 | 3.980.31 | -0.110.11 | 13.5930.90 |
| 8264075 | 17 | 7177152 | 4.110.34 | -0.120.17 | 10.6026.74 |
| 8197368 | 20 | 6622107 | 4.240.35 | -0.080.11 | 4.7922.63 |
| 8330778 | 53 | 7268130 | 3.990.47 | -0.090.19 | 8.4559.52 |
4.3 Photometric metallicity of NGC 6866
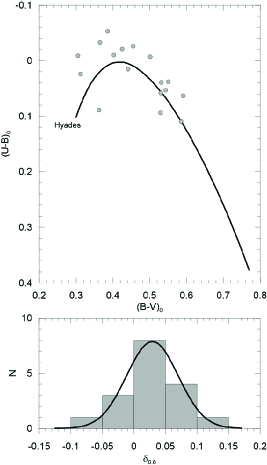
We followed the procedure described in Karaali et al. (2003, 2011) to measure the photometric metallicity of the open cluster NGC 6866. This method is mainly derived using F-G type main-sequence stars. Therefore, we selected 17 out of 64 stars of the cluster based on their colours ( mag) corresponding to F0-G0 spectral type main-sequence stars (Cox, 2000).
We calculated the normalized ultraviolet (UV) excesses of the selected stars, which are defined as the differences between the de-reddened colour indices of stars and the ones corresponding to the members of the Hyades cluster with the same de-reddened colour index, i.e. . Here, the subscripts and refer to Hyades and star, respectively. Then we normalized the differences to the UV-excess at mag, i.e. .
The vs TCD and the histogram of the normalized UV excesses of the selected 17 main-sequence stars of NGC 6866 are shown in Fig. 12. A Gaussian fit to the resulting histogram allows us to calculate the normalized UV excess as mag, where the uncertainty is given as the statistical uncertainty of the peak of the Gaussian. In order to estimate the metallicity () of the cluster, this mode value was evaluated in the following equation of Karaali et al. (2011):
| (4) |
The metallicity corresponding to the mode value for the distribution was calculated as dex.
The theoretical stellar evolutionary isochrones use the mass fraction of all elements heavier than helium. Thus, we used the following relation to transform the metallicities obtained from the LAMOST spectra and the photometry to the mass fraction (Mowlavi et al., 2012):
| (5) |
Hence, we calculated and from the metallicities obtained from the LAMOST spectra and the photometry, respectively. Since these abundances are very close to each other and to the solar value, which is given as by Bressan et al. (2012), we prefer to use the solar abundances in the determination of the astrophysical parameters of the cluster.
4.4 Distance modulus and age of NGC 6866
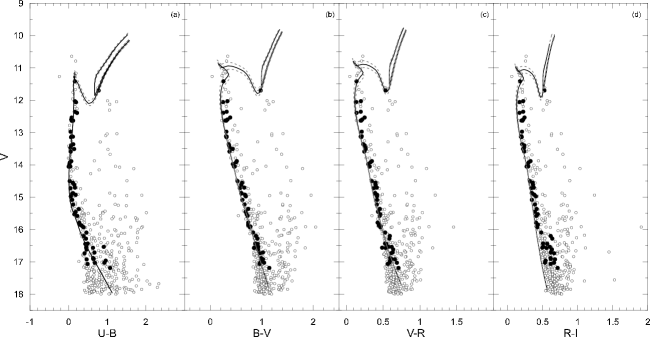
The reddening, metallicity, distance modulus and age of a cluster can be simultaneously determined by fitting the theoretical stellar evolutionary isochrones to the observed CMDs. In our case, we measured metallicity and reddening of the cluster using reliable traditional methods, as noted above. Then, in order to derive its distance modula and age simultaneously, we fitted the CMDs of NGC 6866 with the theoretical isochrones provided by the PARSEC synthetic stellar library (Bressan et al., 2012), which was recently updated (Tang et al., 2014; Chen et al., 2014). Since we keep the metallicity and reddening of the cluster as constants during the fitting process, it is expected that the degeneracy/indeterminacy of the parameters will be less than that in the statistical solutions with four free astrophysical parameters. In Fig. 13, the best fitted theoretical isochrones given by Bressan et al. (2012) for and are overplotted in the CMDs. The estimated astrophysical parameters of NGC 6866 obtained from the best fits to the CMDs are given in Table 7. Errors of the parameters are derived by visually shifting the theoretical isochrones to include all the main-sequence stars in the observed CMDs.
| CMD | Colour Excess | ||||
|---|---|---|---|---|---|
| (mag) | (mag) | (pc) | (Myr) | ||
| vs | |||||
| vs | |||||
| vs | |||||
| vs | |||||
| Mean | |||||
4.5 Galactic orbit of the cluster
In order to estimate the parameters of the Galactic orbit of the cluster, we followed the procedure described in Dinescu et al. (1999), Coşkunoğlu et al. (2012) and Bilir et al. (2012). We first performed a test-particle integration in a Milky Way potential which consists of a logarithmic halo, a Miyamoto-Nagai potential to represent the Galactic disc and a Hernquist potential to model the bulge. We then used values from Coşkunoğlu et al. (2011) for LSR corrections.
We calculated Galactic orbits of the six cluster stars with a membership probability larger than 50% for which LAMOST data are given in Table 6. Median values of the radial velocity and proper motion components of these stars, and the mean distance of the cluster were taken as the input parameters for the cluster’s Galactic orbit estimation: km s-1, and mas yr-1, and pc, respectively. The proper motion components were taken from Zacharias et al. (2013), while the radial velocities of the cluster stars and their distances were found in this study. Proper motions used in our study are almost the same as used by Wu et al. (2009) ( and mas yr-1) who also calculated the parameters of the Galactic orbit of the cluster. Galactic orbits of the stars were determined within an integration time of 3 Gyr in steps of 2 Myr. This integration time corresponds to minimum 12 revolutions around the Galactic center so that the averaged orbital parameters can be determined reliably. In order to determine the Galactic orbit of the cluster, means of the orbital parameters found for the stars were adopted as the orbital parameters of the cluster.
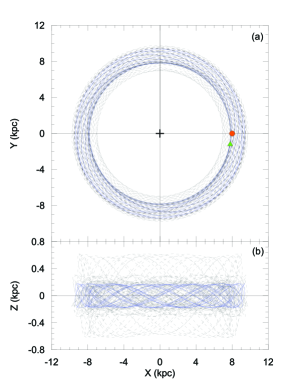
In Fig. 14, representations of Galactic orbits calculated for the cluster stars and the cluster itself are shown in the and planes. Here, , and are heliocentric Galactic coordinates directed towards the Galactic centre, Galactic rotation and the north Galactic pole, respectively. The cluster’s apogalactic () and perigalactic () distances were obtained as 9.78 and 7.76 kpc, respectively. The maximum vertical distance from the Galactic plane is calculated as . When determining the eccentricity projected on to the Galactic plane, the following formula was used: . The eccentricity of the orbit was calculated as . This value shows that the cluster is orbiting the Galaxy with a period of Myr as expected for the objects in the solar neighborhood.
4.6 Luminosity and mass functions of the cluster
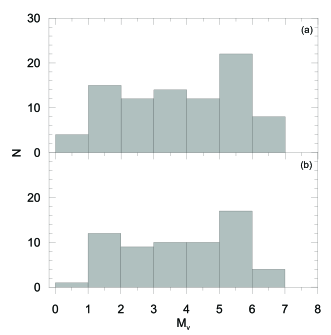
The luminosity function (LF) is defined as the relative number of stars in the unit absolute magnitude range. Since the correction for the non-member stars in a cluster field is very important in the estimation of the luminosity function, we decided to demonstrate the effect of non-member stars using the following procedure. First, we selected the main-sequence stars with mag located in a circular field of 6 arcmin radius from the centre of the cluster. Note that the stars fainter than mag have no accurate astrometric data in the UCAC4 catalogue (Zacharias et al., 2013). Thus, the membership probabilities can not be estimated for the stars fainter than mag. Then we removed the stars located out of the band-like region presented in Fig. 10. Additionally, we also selected the stars located near the turn-off point of the cluster and brighter than mag. This selection procedure resulted in 116 stars with the membership probability . For the main-sequence stars, the apparent magnitude corresponds to a mass range of for the cluster. In order to demonstrate the effect of non-member field stars, the LFs of the cluster estimated for the stars with the membership probabilities of () and () are displayed in Fig. 15. The LFs of NGC 6866 in Fig. 15 indicate that the LF of the cluster has a maximum value towards mag.
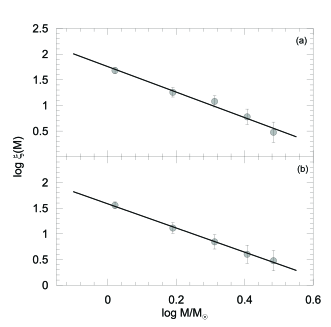
The mass function (MF) denotes the relative number of stars in a unit range of mass centered on mass . It represents the rate of star creation as a function of stellar mass. Theoretical models provided by the PARSEC synthetic stellar library (Bressan et al., 2012) were used to convert the LFs to MFs for NGC 6866. Resulting MFs are presented in Fig. 16. The slope of mass function can be derived by using the following linear relation: , where represents the number of stars in a mass bin with central mass of , and is a constant. The slopes of the MFs are found to be and for the stars with the membership probabilities of and , respectively. Since these values are in agreement in errors, we conclude that the effect of non-member stars can be negligible. As the stars with the membership probability constitute a more pure sample for the cluster stars, we adopt the MF slope for NGC 6866. This MF slope is in a perfect agreement with the value of 1.35 given by Salpeter (1955) for the stars in the solar neighbourhood.
5 Discussion
The reddening, metallicity, distance modulus and age of a cluster can be simultaneously determined by fitting the theoretical stellar evolutionary isochrones to the observed CMDs. However, astrophysical parameters derived from the simultaneous solutions suffer from the reddening-age degeneracy (cf. Anders et al., 2004; King et al., 2005; Bridźius et al., 2008; de Meulenaer et al., 2013). Thus, independent methods developed for the determination of the astrophysical parameters are very useful to reduce the number of free parameters. In this study, using such methods, the reddening was inferred from the vs TCD of the cluster and found as mag and the metallicities estimated from the spectroscopic and photometric observations were found to be roughly in agreement and assumed to be the solar value. Hence, keeping these two parameters as constants, we derived the distance modula and age of NGC 6866 by fitting its observed CMDs to the theoretical isochrones as mag and Myr, respectively. With this method, we attempt to break in part the reddening-age degeneracy.
Although the same metallicity values were adopted in the determination of the astrophysical parameters of NGC 6866, a comparison of Tables 1 and 7 reveals that the reddening, the distance modula, and the distance in this study were found to be smaller than those reported in the previous studies. The determined age of the cluster is in agreement with Güneş et al. (2012) and Janes et al. (2014). Since our photometric data is in good agreement with those of Joshi et al. (2012) and Janes et al. (2014), we conclude that the main reason for the disagreement of the results can be due to the chosen isochrone and age determination difference. It would be confident to conclude that our results are reliable since a more comprehensive approach which tries to minimize degeneracies among parameters is used in this study.
There is only one star with in the RC region of the CMDs of the cluster. The apparent magnitude and the colour index for this star are and mag, respectively. We adopt (see Section 4.1) and mag (Bilir et al., 2013b) as the intrinsic colour excess and absolute magnitude of this RC star, respectively. Using the Pogson’s relation, the distance of the RC star of the cluster is calculated as pc, in agreement with the mean distance given in Table 7, pc.
Using the most likely members of the cluster for which the radial velocities are taken from the LAMOST database, we estimated the Galactic orbit of NGC 6866. The eccentricity projected on to the Galactic plane for its orbit is calculated to be , which implies that the cluster is located in the thin-disc component of the Galaxy. Galactic orbital parameters of the cluster were also calculated by Wu et al. (2009) using the mean radial velocity given in Mermilliod et al. (2008). They calculated the eccentricity of the orbit of the cluster to be and the maximum vertical distance from the Galactic plane . A comparison shows that the eccentricity found in our study is about 50% larger than that calculated in Wu et al. (2009) probably since value in this study is about 30% smaller than their ones.
The luminosity function of NGC 6866 has a maximum value near mag. The derived slope of the mass function for the cluster is which is in a good agreement with the value of 1.35 given by Salpeter (1955) for the stars in the solar neighbourhood.
6 Acknowledgments
Authors are grateful to the anonymous referee for his/her considerable contributions to improve the paper. This work has been supported in part by the Scientific and Technological Research Council (TÜBİTAK) 113F201 and 113F270. Part of this work was supported by the Research Fund of the University of Istanbul, Project Numbers: 39170 and 39742. We thank to TÜBİTAK National Observatory for a partial support in using T100 telescope with project number 12BT100-324. Guoshoujing Telescope (the Large Sky Area Multi-Object Fiber Spectroscopic Telescope, LAMOST) is a National Major Scientific Project which is built by the Chinese Academy of Sciences, funded by the National Development and Reform Commission, and operated and managed by the National Astronomical Observatories, Chinese Academy of Sciences. Funding for the project has been provided by the National Development and Reform Commission. LAMOST is operated and managed by the National Astronomical Observatories, Chinese Academy of Sciences. EP acknowledge support by the SoMoPro II programme (3SGA5916). It was also supported by the grants GP14-26115P, 7AMB14AT015, the financial contributions of the Austrian Agency for International Cooperation in Education and Research (BG-03/2013 and CZ-09/2014). This research has made use of the WEBDA, SIMBAD, and NASA’s Astrophysics Data System Bibliographic Services.
References
- Anders et al. (2004) Anders P., Bissantz N., Fritze-v. Alvensleben U., de Grijs R., 2004, MNRAS, 347, 196
- Andreuzzi et al. (2002) Andreuzzi G., Richer H. B., Limongi M., Bolte, M., 2002, A&A, 390, 961
- Balaguer-Núnez et al. (1998) Balaguer-Núnez L., Tian K. P., Zhao J. L., 1998, A&AS, 133, 387
- Bertin & Arnouts (1996) Bertin E., Arnouts S., 1996, A&AS, 117, 393
- Bilir et al. (2010) Bilir S., Güver T., Khamitov I., Ak T., Ak S., Coşkunoğlu K. B., Paunzen E., Yaz E., 2010, Ap&SS, 326, 139
- Bilir et al. (2012) Bilir S., Karaali S., Ak S., Önal Ö., Dağtekin N. D., Yontan T., Gilmore G., Seabroke G.M., 2012, MNRAS, 421, 3362
- Bilir et al. (2013a) Bilir S., Ak T., Ak S., Yontan T., Bostancı Z. F., 2013a, NewA, 23, 88
- Bilir et al. (2013b) Bilir S., Önal Ö., Karaali S., Cabrera-Lavers A., Çakmak H., 2013b, Ap&SS, 344, 417
- Borucki et al. (2011) Borucki W. J., et al., 2011, ApJ, 728, 117
- Bressan et al. (2012) Bressan A., Marigo P., Girardi L., Salasnich B., Dal Cero C., Rubele S., Nanni A., 2012, MNRAS, 427, 127
- Bridźius et al. (2008) Bridz̆ius A., Narbutis D., Stonkuté R., Deveikis V., Vansevic̆ius V., 2008, BaltA, 17, 337
- Cabrera-Lavers et al. (2005) Cabrera-Lavers A., Garzón F., Hammersley P. L., 2005, A&A, 433, 173
- Cabrera-Lavers et al. (2007) Cabrera-Lavers A., Bilir S., Ak S., Yaz E., López-Corredoira M., 2007, A&A, 464, 565
- Cardelli et al. (1989) Cardelli J. A., Clayton G. C., Mathis J. S., 1989, ApJ, 345, 245
- Chen et al. (2014) Chen Y., Girardi L., Bressan A., Marigo P., Barbieri M., Kong X., 2014, MNRAS, 444, 2525
- Coşkunoğlu et al. (2011) Coşkunoğlu , B., et al., 2011. MNRAS 412, 1237
- Coşkunoğlu et al. (2012) Coşkunoğlu B., Ak S., Bilir S., Karaali S., Önal Ö., Yaz E., Gilmore G., Seabroke G. M., 2012, MNRAS, 419, 2844
- Cox (2000) Cox A. N., 2000. Allen’s astrophysical quantities, 4th ed. Publisher: New York: AIP Press; Springer, 2000. Edited by Arthur N. Cox. ISBN: 0387987460
- Cui et al. (2012) Cui X. Q., et al., 2012, RAA, 12, 9, 1197
- De Cat et al. (2014) De Cat P., et al., 2014, CoRoT Symposium 3/Kepler KASC-7 joint meeting, Toulouse, July 2014. (arXiv:1411.0913)
- De Cat et al. (2015a) De Cat P., et al., 2015a, EPJ Web of Conferences, in press (arXiv:1411.0913)
- De Cat et al. (2015b) De Cat P., Fu J.N., Yang X. H., et al., 2015b, submitted to ApJL
- de Meulenaer et al. (2013) de Meulenaer P., Narbutis D., Mineikis T., Vancevic̆ius V., 2013, A&A, 550, 20
- Dinescu et al. (1999) Dinescu D. I., Girardi T.M., van Altena W. F., 1999, AJ, 117, 1792
- Du et al. (2012) Du B., Luo A., Zhang J., Wu Y., Wang F., 2012, SPIE, 8451, 37
- Frinchaboy & Majewski (2008) Frinchaboy P. M., Majewski S. R., 2008, AJ, 136, 118
- Friel (1995) Friel E. D., 1995, ARA&A, 33, 381
- Friel (2013) Friel E. D., 2013, in Planets, Stars and Stellar Systems Vol. 5, by Oswalt T.D., Gilmore G., ISBN 978-94-007-5611-3. Springer Science+Business Media Dordrecht, p. 347
- Frolov et al. (2010) Frolov V. N., Ananjevskaja Yu. K., Gorshanov D. L., Polyakov E. V., 2010, Astronomy Letters, 36, 338
- Güneş et al. (2012) Güneş O., Karataş Y., Bonatto C., 2012, NewA, 17, 720
- Hidayat & Sutantyo (1972) Hidajat B., Sutantyo W., 1972, Contr. Bosscha Obs. no 44
- Hiltner & Johnson (1956) Hiltner W. A., Johnson H. L., 1956, ApJ, 124, 367
- Hoag et al. (1961) Hoag A. A., Johnson H.L., Iriarte B., Mitchell R. I., Hallam K. L., Sharpless S., 1961, Publ. Us. Nav. Obs. XVII part VII, 347
- Janes & Hoq (2013) Janes K., Hoq S., 2013, AJ, 141, 92
- Janes et al. (2014) Janes K., Barnes S. A., Meibom S., Hoq S., 2014, AJ, 147, 139
- Javakhishvili et al. (2006) Javakhishvili G., Kukhianidze V., Todua M., Inasaridze R., 2006, A&A, 447, 915
- Johnson et al. (1961) Johnson H. L., Hoag A. A., Iriarte B., Mitchell R. I., Hallam K. L. 1961, Bull. Lowell Obs., No.113, Vol. V, No. 8, 133
- Joshi et al. (2012) Joshi Y. C., Joshi S., Kumar B., Mondal S., Balona L. A., 2012, MNRAS, 419, 2379
- Karaali et al. (2003) Karaali S., Bilir S., Karataş Y., Ak S. G., 2003, PASA, 20, 165
- Karaali et al. (2004) Karaali S., Bilir S., Hamzaoğlu E., 2004, MNRAS, 355, 307
- Karaali et al. (2011) Karaali S., Bilir S., Ak S., Yaz E., Coşkunoğlu B., 2011, PASA, 28, 95
- Karaali et al. (2013) Karaali S., Bilir S., Yaz Gökçe E., 2013, Ap&SS, 346, 89
- Kharchenko et al. (2005) Kharchenko N. V., Piskunov A. E., Röser S., Schilbach E., Scholz R.-D., 2005, A&A, 438, 1163
- Kharchenko et al. (2007) Kharchenko N. V., Scholz R. -D., Piskunov A. E., Röser S., Schilbach E., 2007, AN, 328, 889
- King (1962) King I., 1962, AJ, 67, 471
- King et al. (2005) King I. R., Bedin L. R., Piotto G., Cassisi S., Anderson J., 2005, AJ, 130, 626
- Kochukhov & Piskunov (2006) Kochukhov O., Piskunov N., 2006, IAUJD, 8, 7
- Koleva et al. (2009) Koleva M., Prugniel P., Bouchard A., Wu Y., 2009, A&A, 501, 1269
- Landolt (2009) Landolt A. U., 2009, AJ, 137, 4186
- Lindoff (1968) Lindoff U., 1968, Arkiv för Astronomii, 5, 1
- Loktin & Matkin (1994) Loktin A. V., Matkin N. V., 1994, A&AT, 4, 153
- Luo et al. (2012) Luo A. L., et al., 2012, RAA, 12, 9, 1243
- Luo et al. (2015) Luo A.-L., et al. 2015, submitted to RAA (2015arXiv150501570L)
- Mermilliod et al. (2008) Mermilliod J.-C., Mayor M., Udry S., 2008, A&A, 485, 303
- Molenda-Zakowicz et al. (2009) Molenda-Żakowicz J., Kopacki G., Steślicki M., Narwid A., 2009, Acta Astronomica, 59, 193
- Mowlavi et al. (2012) Mowlavi N., Eggenberger P., Meynet G., Ekström S., Georgy C., Maeder A., Charbonnel C., Eyer L., 2012, A&A, 541, A41
- Paczynski & Stanek (1998) Paczynski B., Stanek K. Z., 1998, ApJ, 494, L219
- Prugniel & Soubiran, (2001) Prugniel P., Soubiran, C., 2001, A&A, 369, 1048
- Ren et al. (2015) Ren A. B., et al., 2015, in preparation
- Salpeter (1955) Salpeter E. E., 1955, ApJ, 121, 161
- Sung et al. (2013) Sung H., Lim B., Bessell M.S., Kim J. S., Hur H., Chun M., Park B., 2013, JKAS, 46, 103
- Tang et al. (2014) Tang J., Bressan A., Rosenfield P., Slemer A., Marigo P., Girardi L., Bianchi L., 2014, MNRAS, 445, 4287
- Thompson et al. (2014) Thompson B, Frinchaboy P., Kinemuchi K., Sarajedini A., Cohen R., 2014, AJ, 148, 85
- Wang et al. (1996) Wang S.-G., et al., 1996, Applied Optics, 35, 5155
- Wu (2009) Wu Y., 2009, A&A, 501, 1269
- Wu et al. (2009) Wu Z.-Yu, Zhou X., Ma J., Du C.-H., 2009, MNRAS, 399, 2146
- Wu et al. (2011) Wu Y., Singh H. P., Prugniel P., Gupta R., Koleva M., 2011, A&A, 525, 71
- Wu et al. (2015) Wu Y., Luo A., Du B., Zhao Y., Yuan H., 2015, in Heavens A., Starck J.-L., Krone-Martins A., eds, Proc. IAU Symp. 306, Statistical Challenges in 21st Century Cosmology, (arXiv:1407.1980)
- Xing et al. (1998) Xing X., et al., 1998, SPIE, 3352, 839.
- Yaz Gökçe et al. (2013) Yaz Gökçe E., Bilir S., Öztürkmen N. D., Duran Ş., Ak T., Ak S., Karaali S., 2013, NewA, 25, 19
- Yontan et al. (2015) Yontan T., Bilir S., Bostancı Z. F., Ak T., Karaali S., Güver T., Ak S., Duran Ş., Paunzen E., 2015, Ap&SS, 355, 267
- Zacharias et al. (2013) Zacharias N., Finch C. T., Girard T. M., Henden A., Bartlett J. L., Monet D. G., Zacharias M. I., 2013, AJ, 145, 44
- Zhao et al. (2012) Zhao G., Zhao Y.-H., Chu Y.-Q., Jing Y.-P., Deng L.-C., 2012, RAA, 12, 7, 723