Can life survive Gamma-Ray Bursts in the high-redshift universe?
Abstract
Nearby Gamma-Ray Bursts (GRBs) have been proposed as a possible cause of mass extinctions on Earth. Due to the higher event rate of GRBs at higher redshifts, it has been speculated that life as we know it may not survive above a certain redshift (e.g. ). We examine the duty cycle of lethal (life-threatening) GRBs in the solar neighborhood, in the Sloan Digital Sky Survey (SDSS) galaxies and GRB host galaxies, with the dependence of the long GRB rate on star formation and metallicity properly taken into account. We find that the number of lethal GRBs attacking Earth within the past 500 Myr ( epoch of the Ordovician mass extinction) is . The number of lethal GRBs hitting a certain planet increases with redshift, thanks to the increasing star formation rate and decreasing metallicity in high- galaxies. Taking 1 per 500 Myr as a conservative duty cycle for life to survive, as evidenced by our existence, we find that there are still a good fraction of SDSS galaxies beyond where the GRB rate at half-mass radius is lower than this value. We derive the fraction of such benign galaxies as a function of redshift through Monte Carlo simulations, and find that the fraction is at and even at . The mass distribution of benign galaxies is dominated by Milky-Way-like ones, thanks to their commonness, relatively large mass, and low star formation rate. GRB host galaxies are among the most dangerous ones.
Subject headings:
Gamma Ray Burst1. Introduction
Nearby high-energy transient sources have been considered as a possible cause of mass extinction events on Earth as well as a potential threat to life in the future (Ruderman, 1974; Thorsett, 1995; Dar et al., 1998; Gehrels et al., 2003; Melott & Thomas, 2011; Svensmark, 2012). Among them, gamma-ray bursts (GRBs), the most violent explosions in the universe, have been regarded as one of the most lethal high-energy transients to life (Scalo & Wheeler, 2002; Thomas et al., 2005a, b). With a 2-D simulation on how Earth’s atmosphere responds to an intense -ray flux, Thomas et al. (2005a) investigated the effect of a nearby (2 kpc away) GRB to life on Earth. A typical GRB at this distance has a -ray fluence of , which would cause severe damage to life on Earth. According to Thomas et al. (2005a), such a GRB would lead to a rapid increase of nitrogen compounds (e.g. NO and NO2) in the atmosphere causing an on-average 35% ozone depletion in the stratosphere, increasing for years the solar UVB radiation flux at Earth. The resulting DNA damage, up to 16 times the normal level, is lethal to many organisms such as plankton, the base of the food chain. It may lead to extinction of creatures in higher trophic levels of the food chain due to starvation. Furthermore, the opacity of NO2 in Earth’s atmosphere would result in a decreased surface temperature, which is speculated to be a cause of a long-lasting ice age (Thomas et al. 2005a, but see Thomas et al. 2015). The mass extinction in the late Ordovician ( 447 Myr ago) could be due to the impact of a nearby GRB (Melott et al., 2004; Bambach, 2006; Melott & Thomas, 2008).
Long-duration GRBs are more dangerous than the short-duration ones (Piran & Jimenez, 2014). Since long GRBs (LGRBs hereafter) are related to deaths of massive stars and therefore track the star formation history of the universe (Woosley & Bloom, 2006; Kumar & Zhang, 2015), it is naturally expected that GRBs become more lethal at higher redshifts where the star formation rate is higher. Indeed, Piran & Jimenez (2014) speculated that life as we know it cannot survive at due to the frequent bombardment of GRBs at any location in a galaxy.
One caveat in drawing such a conclusion is related to the duty cycle of lethal GRBs preventing development of advanced life. The time scale to re-develop advanced life is not well studied. Even though the Ordovician mass extinction happened 447 Myr ago, more recent mass extinction events (e.g. the Cretaceous-Paleogene extinction 65 Myr ago that killed the dinosaurs) did not prevent re-emergence of advanced life forms (humans). Therefore it may be possible for life to tolerate a shorter (say, 50 Myr) lethal GRB duty cycle. Regardless of the biological details of how a GRB may kill life and how advanced life forms re-emerge, our existence suggests that advanced civilizations can develop if lethal GRBs have a duty cycle comparable to the one inferred for the solar neighborhood in the Milky Way Galaxy.
In this paper, we quantify the lethal GRB duty cycle in the solar neighborhood, and apply it as a conservative life survival condition to study the “habitability” of various observed galaxies (e.g. Sloan Digital Sky Survey [SDSS] galaxies and the GRB host galaxies). The aim is to address whether life can survive GRBs in the high-redshift universe.
2. Methodology
Following Thomas et al. (2005a), we adopt as a critical fluence defining a lethal GRB. Since GRBs trace star formation and most star formation happens in late type galaxies, we consider our test galaxies as disk galaxies with an exponential stellar mass column density , where is the scale length. To the first-order approximation, one may ignore variation of specific star formation rate (sSFR) and metallicity within the galaxy. A GRB at from the galactic center defines a pair of cones where life is damaged. These cones have a radius and a solid angle , where is the peak isotropic luminosity of the GRB, and is the rest-frame duration of the GRB, which is typically s. For a GRB at , the fraction of mass in the galaxy where life is damaged can be expressed as
| (1) | |||||
where is the beaming correction factor. The fraction is also the probability for a random GRB in the galaxy (including both those beaming towards and those beaming away from the planet) to kill life on a planet at from the galactic center.
The high-luminosity LGRB luminosity function (LF), is characterized by a broken power law with a break luminosity (Liang et al., 2007; Wanderman & Piran, 2010; Sun et al., 2015), e.g.
| (2) |
The number of lethal GRBs that would attack the planet at within a time duration is
| (3) |
where the range of integration is , the observed range of LGRBs, and is the GRB event rate density above a specific luminosity in the local universe. Here the factor makes the correction from the observed GRBs (defined by the observed luminosity function) to the total GRBs (including those not beaming towards us). Notice that it cancels out with the factor in Eq.(1), so that the result does not depend on the poorly constrained parameter .
Various studies reach a generally consistent conclusion, but with somewhat different parameters. Here we adopt the latest analysis by Sun et al. (2015) using the largest long GRB sample. Since there is an evolution of the GRB luminosity function, we use the luminosity function and event rate density derived from the nearby () sample with the following parameters (Sun et al. 2015): , , , and . The occupied cosmological volume of a galaxy with mass is estimated as , where is the average stellar density obtained by integrating the stellar mass function (Mortlock et al., 2015) from for different redshifts, which is fit as (see also Muzzin et al. (2013) and papers therein). A typical time scale = 500 Myr is used to match approximately the epoch of the Ordovician Mass Extinction of (447 – 443) Myr ago (Sutcliffe et al., 2000; Brenchley et al., 2003).
The parameter denotes the average GRB event rate density in the local universe (). We know that the LGRB rate depends on star formation rate and metallicity. It is then relevant to introduce two correction factors for the specific galaxy values with respect to the local average values. The specific SFR correction factor is introduced as
| (4) |
where the local specific star formation rate is sSFR (Weinmann et al., 2011). The metallicity correction factor is defined as
| (5) |
Here is the fraction of stars with metallicity poorer than [Fe/H] (equivalent to 0.4 ) (Bertelli et al., 1994; Virgili et al., 2011), assuming that the metallicity of the galaxy is a Gaussian distribution with the detected metallicity as the medium value and the standard deviation , similar to the Milky Way (Casagrande et al., 2011). The function is a similar fraction, but with median value being the mean metallicity of the local universe (Gallazzi et al., 2008; Madau & Dickinson, 2014).
The short GRB (hereafter SGRB) impact rate can be estimated with a similar method. The typical duration of a SGRB is 0.5 s. The luminosity function depends on the model of the merger delay time distribution, but can be generally fitted as a single power law (Sun et al., 2015). We use the best-fit luminosity function parameters for a Gaussian delay time distribution, i.e. with . The range of integration is as observed. Since the SGRBs are likely due to mergers of two neutron stars or a neutron star–black hole system, the probability of a short GRB is no longer directly related to the fraction of the mass. Rather, we derive the probability by introducing an offset distribution of the afterglow with respect to the host galaxies. Using the observational data (Fong et al., 2010; Fong & Berger, 2013), we find that the normalized (in units of the host galaxy scale length) offset distribution can be approximated as a Gaussian function in logarithmic space, i.e., G(, =0.32, =0.57). So the probability of a SGRB located in an area is
| (6) | |||||
where the integration in the numerator is over the damaging region around and the integration in the denominator is over the entire galaxy. Also there is no direct connection between the SGRB rate and sSFR or metallicity, so that and are adopted.
3. Lethal GRB RATE IN MILKY WAY
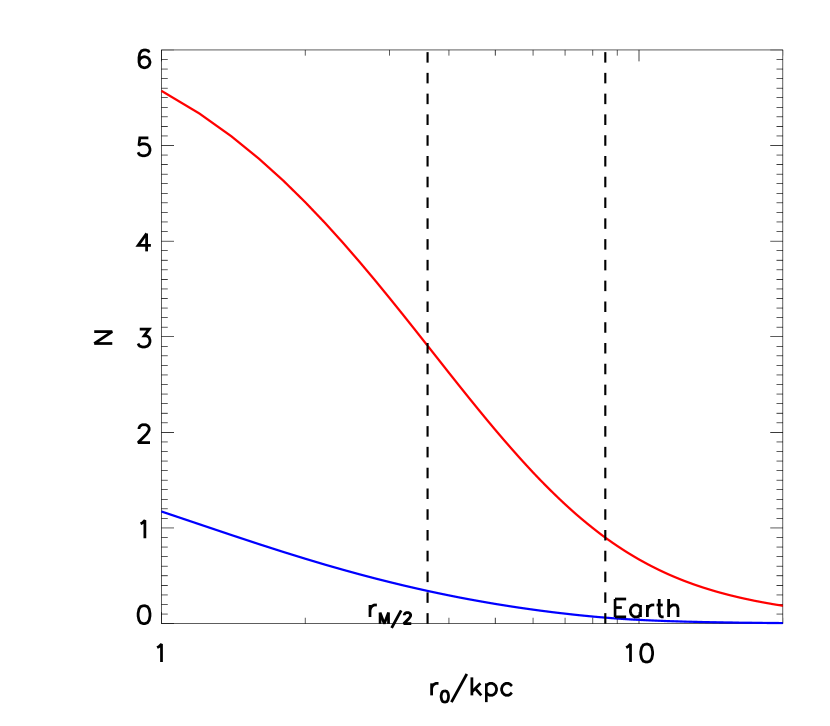
We first apply our methodology to the Milky Way (MW). The stellar mass of the MW is (McMillan, 2011), so that the occupied cosmological volume is . With sSFR = (Licquia & Newman, 2014), which is relatively small in the local universe, we get the sSFR correction factor . The metallicity distribution function of the MW is a Gaussian with the mean value and (Casagrande et al., 2011). It is relatively metal poor compared to the average value in the local universe, and the metallicity correction factor is . The half mass radius of the MW is (Bovy & Rix, 2013), and our Earth is located at away from the Galactic center (Reid, 1993; Eisenhauer et al., 2003; Gillessen et al., 2009).
The red line in Fig.1 denotes the number of lethal LGRBs for planets at different radii in the Milky Way within 500 Myr. At Earth’s location, the number of lethal LGRBs is 0.93 within 500 Myr. This is consistent with the hypothesis connecting the Ordovician mass extinction with GRB activity. The number is larger than 1 for kpc. At the half mass radius, the number of lethal GRBs is . The number increases to even larger values at smaller radii, suggesting that the regions close to the Galactic center are less habitable. Our existence suggests that per 500 Myr can be regarded as a conservative criterion for the survival of advanced life forms.
4. Lethal GRB rate in other galaxies
Galaxies at high redshifts have higher sSFR (Weinmann et al., 2011; Ilbert et al., 2014) and lower metallicity (Maiolino et al., 2008; Mannucci et al., 2010) on average. These result in higher and correction factors, so that the number of lethal GRBs is expected to increase with redshift. In this section, we investigate the lethal GRB rate for other galaxies making use of the observational data directly. We employ the SDSS DR8 and DR12 galaxy samples (Aihara et al., 2011; Smee et al., 2013; Alam et al., 2015) as the starting point, and extrapolate the sample to even higher redshifts with a Monte Carlo simulation, aiming at quantifying the redshift-dependence of the fraction of benign galaxies where life as we know it can survive GRBs. GRB host galaxies are also studied for comparison. For all the galaxies, instead of studying the -dependent lethal GRB rate, we only investigate the rate at the half-stellar-mass radius as a representation of the “habitability” of the galaxy.
4.1. SDSS DR8 and SDSS/BOSS DR12 Samples
The SDSS DR8 sample includes all spectroscopically classified galaxies in SDSS-I/II. It covers 9274 of the sky and includes 860,836 unique galaxies, with a median redshift 0.12. The SDSS/BOSS DR12 sample is the SDSS-III’s Baryon Oscillation Spectroscopic Survey (BOSS) galaxy catalog, which includes a LOWZ sample and a CMASS sample. There are 1,376,823 galaxies in total, with a median redshift 0.5.
These samples are subject to observational selection effects. Since our primary aim is to check whether life can survive GRBs at high redshifts, for the first step we work on the observed sample only to make the case.
We use the SDSS DR8 and SDSS/BOSS DR12 galaxy properties obtained from the Portsmouth Group111http://www.sdss.org/dr12/spectro/galaxy_portsmouth/. In this sample, stellar mass, star formation rate, and metallicity are estimated by fitting the photometric data with the publicly available code Hyper-Z (Bolzonella et al., 2000). The stellar population models of Maraston (2005) and Maraston et al. (2009) are employed. Star formation rate is estimated with an exponentially declining star formation history (SFH), truncated SFH, or constant SFH model, whichever gives the best fit. The Initial Mass Function is Kroupa (Kroupa, 2001).
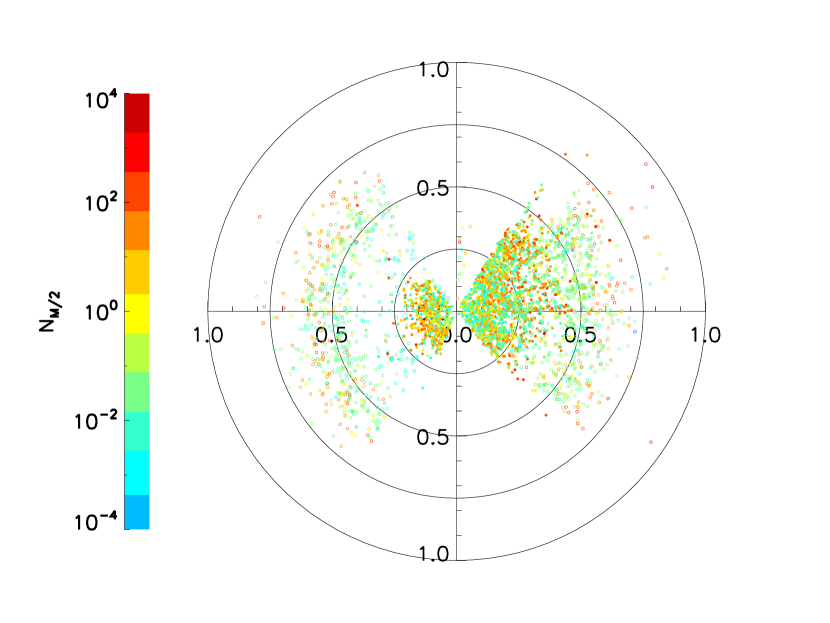
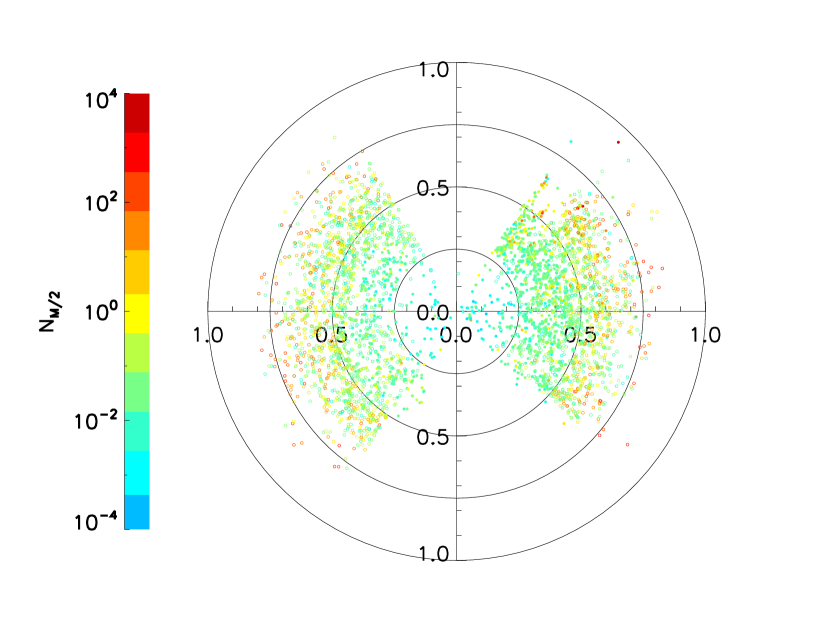
Figure 2 displays two 3-D maps of the galaxies in the samples. For clear illustration only galaxies with declinations in the range of [, ] are shown here. The left panel shows the galaxies with stellar mass , and the right panel shows the galaxies with . DR8 galaxies are shown as filled circles and DR12 galaxies are shown as open circles. Colors are encoded with the estimated number of lethal LGRBs at half mass radius in 500 Myr. “Blue” and “green” galaxies have , so that they are safe for life. “Red” and “orange” galaxies have , which are the most dangerous. “Yellow” galaxies are MW-like galaxies. One can see that although “red” and “orange” galaxies gradually increase with redshift, there are still “blue”/“green” galaxies up to redshift 0.7. The naive speculation that no life can survive beyond is not confirmed.
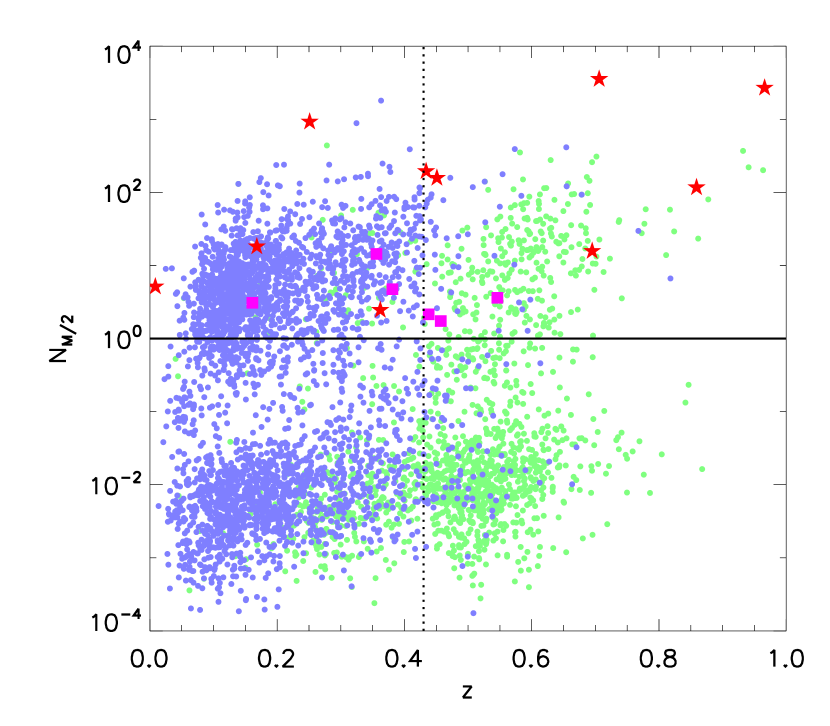
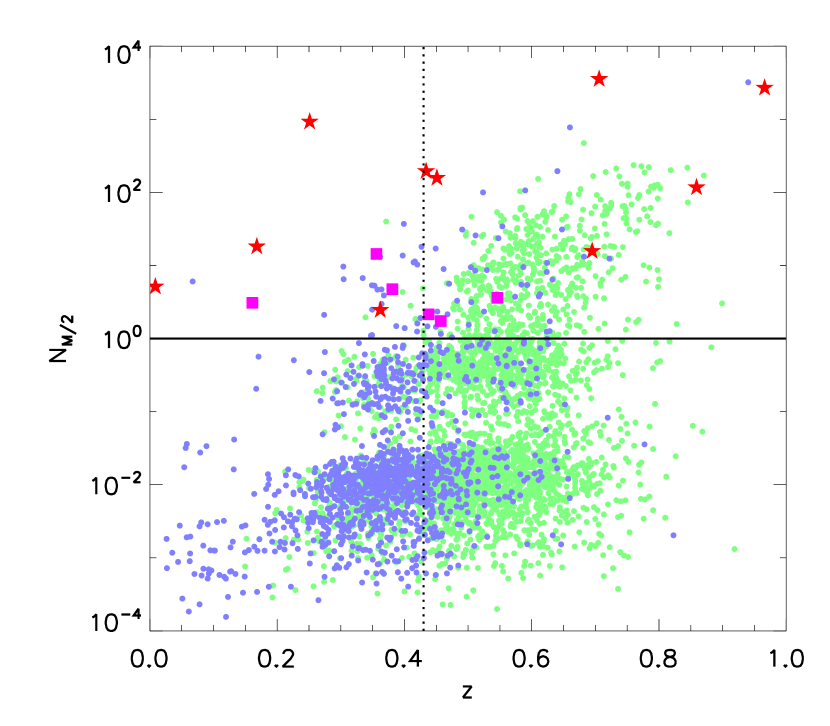
In order to take a closer look at how galaxies become more dangerous at higher redshifts, in Fig.3 we display of galaxies as a function of redshift. The left and right panels show the galaxies with stellar mass in the range of , and , respectively. In each panel, DR8 galaxies are shown as blue points and DR12 galaxies are shown as green points. The vertical dashed line shows the corresponding redshift () when Earth was formed. The horizontal solid line marks , above which most regions in the galaxy are dangerous for life. One can see in general for both mass ranges, galaxies become more dangerous at higher redshifts. There seems to be an offset (especially in the left panel) between the DR8 (blue) and DR12 (green) galaxies, but it is caused by the different selection effects for the two samples.
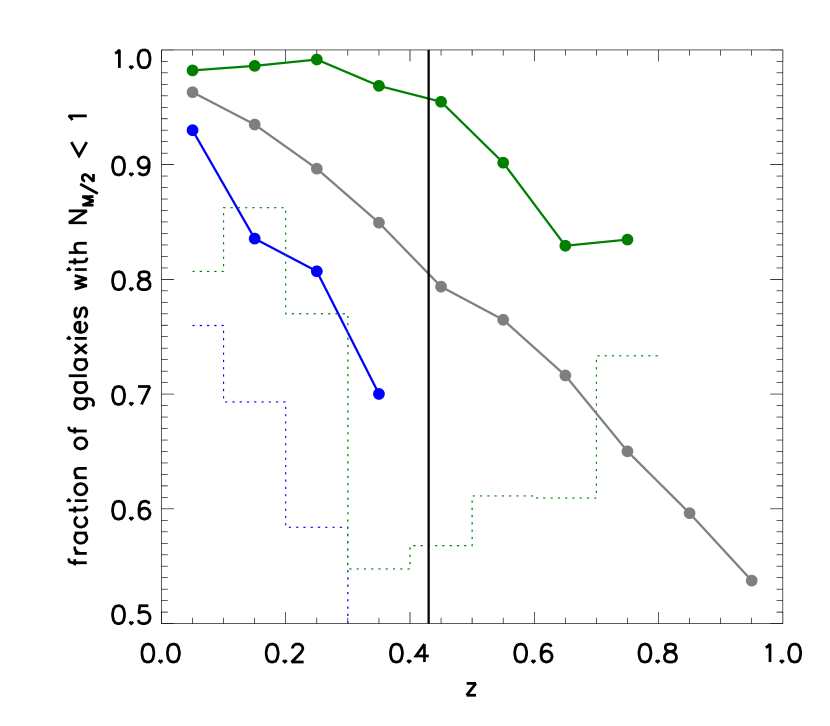
The fraction of galaxies with is shown in the left panel of Fig. 4. The blue and green lines are for DR8 and DR12, respectively. In order to avoid the selection effects on luminosity and mass, we only focus on one mass bin here. The results have similar trends for other mass bins. Each redshift bin is required to have more than 5,000 galaxies. Some galaxies are marked as SFR = 0. Most of them have a truncated SFH. Some others have a large age for an exponential decay of SFH as a function of time. For each redshift bin, the fraction of galaxies with SFR = 0 are plotted as the dotted histograms.
Since the DR8 sample tends to have more blue (late type) galaxies for a particular stellar mass bin whereas the DR12 sample originally searched for red (early type) galaxies, the two samples are both subject to a sample selection effect. In any case, the fraction lines (blue and green) derived from these two samples set the lower and upper limits of the fraction of benign galaxies as a function of redshift.
4.2. Monte Carlo Simulations
In order to reduce the sample selection effects and investigate redshift-dependence of the fraction of benign galaxies for life, we apply a Monte Carlo simulation aimed at achieving a more complete and unbiased sample.
We simulate blue and red galaxies separately since they follow different correlations among redshift, stellar mass, sSFR and metallicity (Kimm et al., 2009; Mortlock et al., 2015). We simulate 100,000 blue galaxies in each redshift bin. The number of red galaxies is estimated by the ratio between the number of red and blue galaxies. The ratio is estimated by integrating the stellar mass function of blue and red galaxies from in each redshift bin (Mortlock et al., 2015; Muzzin et al., 2013), which gives an empirical relation log.
For blue galaxies in each redshift bin, galaxy mass is given by stellar mass function as a function of redshift (Mortlock et al., 2015). The sSFR distribution is considered as a Gaussian distribution. The median sSFR is a function of redshift and stellar mass (Eq.5 of Ilbert et al. 2014). The dispersion is given as 0.4 Gyr-1, a mean value of their Fig. 6. The metallicity distribution is also assumed to be a Gaussian function. The median value is a function of stellar mass and SFR (Eq.4 of Mannucci et al. 2010). In order to avoid the abnormal increase of very small and very large , the fourth-order term of that equation is dropped. A dispersion is used, which is the median value of the dispersions in those stellar mass-SFR bins.
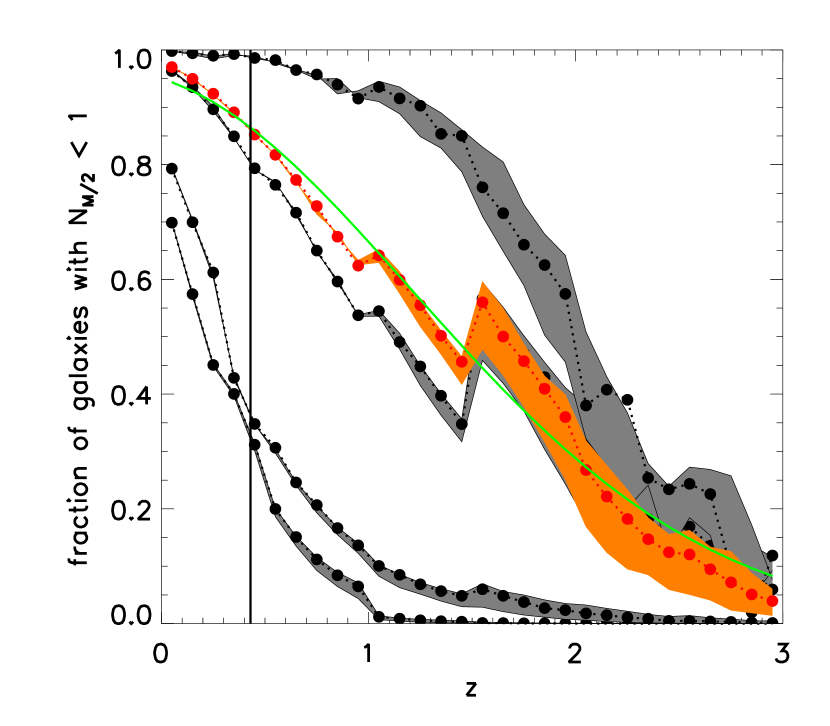
The mass distribution of red galaxies as a function of redshift in Mortlock et al. (2015) is used to simulate the masses of the red galaxies. They are mostly passive galaxies (Strateva et al., 2001) and their sSFRs are generally 0.01 to 0.001 times of those of blue galaxies (Kimm et al., 2009). One may assume that their sSFRs follow the same relation with stellar mass (Kimm et al., 2009), but have sSFRs a factor 0.001/0.003/0.010 of those of blue galaxies with the same masses. The effect of different sSFRs of red galaxies are shown as the shadows in the right panel of Fig.4.
The fraction of MC simulated galaxies with is shown in the right panel of Fig.4. Black lines are for different stellar mass bins. From the bottom up, the lines are for , , and , respectively. The shaded regions enclose the results for different median sSFRs ratio between red and blue galaxies. The center line is for 0.003, while the lower and upper ones are for 0.010 and 0.001, respectively. It reveals that the fraction of benign galaxies in the small galaxy sample () is low, which becomes smaller than 50% at . The fraction of benign galaxies increases with mass bins. For example, for , the fraction is still 50% at . The red line and the orange shaded region show the mass-weighted fraction of benign galaxies with . They are similar to the fraction line and shaded region for MW-like galaxies in the mass bin . This is because these galaxies are massive and relatively common, and occupy most of the mass in each redshift bin. The fraction of benign galaxies is at , and is even at .
4.3. GRB host galaxies
LGRBs tend to reside in late type galaxies with high star formation rate and low metallicity (e.g. Savaglio et al., 2009), whereas SGRB host galaxies tend to be more diverse (Fong & Berger, 2013; Berger, 2014). We study the GRB host galaxies, both for LGRBs and SGRBs, for their habitability. Table 4.3 lists the information of some LGRB and SGRB host galaxies with the desired information, including stellar mass, SFR, metallicity, and scale length. Also listed are the values of those galaxies. They are also overplotted as red stars (LGRB host galaxies) and magenta squares (SGRB host galaxies) in Fig.3. One can see that LGRB host galaxies are among the extremely dangerous galaxies for life. The number of lethal LGRBs at half mass radius within 500 Myr in all of the LGRB host galaxies is much greater than 1, suggesting that life can hardly survive in these galaxies. Meanwhile, SGRB hosts are relatively safer than LGRB hosts due to their much higher metallicity and lower sSFR. However, in all cases studied in our sample one has , so that they still belong to dangerous galaxies.
| GRB | sSFR | 12+ | Ref | ||||
|---|---|---|---|---|---|---|---|
| log(O/H) | kpc | ||||||
| 970228 | 0.695 | 8.65 | 1.19 | 8.47 | 2.458 | 15.74 | 1,2,3 |
| 980425 | 0.009 | 8.68 | 0.54 | 8.16 | 3.266 | 5.14 | 1,2,3 |
| 980703 | 0.966 | 10.00 | 1.66 | 8.14 | 1.342 | 2696.83 | 1,2,3 |
| 990712 | 0.434 | 9.29 | 1.23 | 8.10 | 1.591 | 194.86 | 1,2,3 |
| 991208 | 0.706 | 8.53 | 13.34 | 8.02 | 0.344 | 3558.73 | 1,2,3 |
| 010921 | 0.451 | 9.69 | 0.51 | 8.15 | 1.903 | 157.67 | 2,3 |
| 11121 | 0.362 | 9.81 | 0.35 | 8.60 | 12.671 | 2.46 | 2,3 |
| 020903 | 0.251 | 8.87 | 3.57 | 8.22 | 0.431 | 927.26 | 2,3 |
| 030329 | 0.168 | 7.74 | 2.00 | 7.97 | 0.804 | 18.18 | 2,3 |
| 040924 | 0.859 | 9.20 | 1.19 | 8.23 | 2.382 | 117.08 | 2,3 |
| SGRB | |||||||
| 050709 | 0.161 | 8.80 | 0.24 | 8.50 | 2.080 | 3.08 | 4,5 |
| 051221A | 0.546 | 9.40 | 0.38 | 8.80 | 2.290 | 3.62 | 4,5 |
| 061006 | 0.438 | 9.00 | 0.24 | 8.60 | 3.220 | 2.14 | 4,5 |
| 070724A | 0.457 | 10.10 | 0.20 | 8.90 | 3.640 | 1.73 | 4,5 |
| 071227 | 0.381 | 10.40 | 0.02 | 8.50 | 4.720 | 4.75 | 4,5 |
| 130603B | 0.356 | 9.70 | 0.34 | 8.70 | 2.020 | 14.36 | 4,5,6 |
5. Conclusions and Discussion
In this paper, we examined the duty cycle of lethal GRBs () in the Milky Way as well as observed galaxies at different redshifts. The duty cycle of lethal GRBs attacking Earth is about 1 per 500 Myr, consistent with the time scale of the Ordovician mass extinction. Our existence suggests that such a duty cycle is long enough to allow advanced life (such as human beings) to survive, so that such a duty cycle can be regarded as a conservative criterion for a benign environment. Adopting such a criterion, we investigated the fraction of benign galaxies as a function of redshift using the SDSS DR8 and SDSS/BOSS DR12 samples and through MC simulations. We find that this fraction is as high as 99% in the local universe, suggesting that the current era is most suitable to the development of advanced life. As expected, the benign galaxy fraction decreases with increasing redshift due to the increase of SFR and decrease of metallicity at progressively higher redshifts. However, contrary to the naive expectation that no life can survive beyond , we show that benign galaxies do exist at redshifts much higher than 0.5. In particular, the fraction is around , and is still even at . In view that the birth of Earth itself corresponds to , our results raise the exciting possibility that advanced civilizations are in principle not excluded even before the formation of the solar system, even though the fraction of “habitable” galaxies is smaller in the higher redshift universe.
Finally, we discuss some possible uncertainties inherent to this analysis. 1. Many uncertainties are involved in making the argument that a GRB is lethal. These include how the atmosphere reacts to intense -ray flux, how DNA/life reacts to exposure to UV light, and how alien life forms may be different from the ones of which we are aware. On the other hand, since our analysis focuses on how life survives a GRB, these uncertainties do not affect our argument. The only biological connection used in this paper is our existence, suggesting that the local lethal LGRB event rate (1 per 500 Myr) can be regarded as a safe (conservative) duty cycle for life to survive. If the GRB damage is less severe, as suggested by some recent studies (e.g. Thomas et al., 2015), or if advanced life can tolerate a higher lethal GRB rate (argument presented in the second to last paragraph in introduction), then the fraction of benigh galaxies at high- is even larger. 2. There exist uncertainties in the local GRB event rate density, which affect the estimated lethal GRB duty cycle at Earth. We used the latest results of Sun et al. (2015) with the largest LGRB sample. Adopting the GRB event rate results derived by other authors would give a local lethal GRB rate generally consistent with our value, with a difference at most a factor of 2-3. 3. The two galaxy samples included in our study are subject to substantial selection effects. The derived fractions, even with MC simulations, may not fully represent the true fractions due to some un-modeled biases. In any case, we have argued that the DR8 and DR12 samples would bracket the true population. The fact that at least some galaxies are benign against lethal GRBs at high redshifts is robust, which is the main conclusion of this paper. 4. The dependence of LGRBs on SFR and metallicity is evidenced by the observations, but the exact correction factors (especially the metallicity one ) are not fully constrained. In any case, the general conclusion of this paper does not depend on the concrete form of and . 5. We did not study the impact of SGRBs in other galaxies. For most star formation galaxies, their contribution to lethal GRB number is negligible. However, for early-type galaxies where SFR is extremely low, SGRBs may dominate the lethal GRB attacking duty cycle. In any case, is always much less than unity in these early-type galaxies. For the purpose of this paper (to claim the fraction of benign galaxies at high redshifts), ignoring the SGRB contribution does not affect the conclusions and is therefore justified. 6. We did not study the life-damaging effect of other transients such as supernovae, which may have comparable damaging effects as GRBs in the local universe (e.g. Melott & Thomas, 2011; Svensmark, 2012). While a more detailed study is needed to address the supernova effect, the general conclusion of this paper may not be modified when supernovae are considered. This is because supernovae also follow star formation history, so that they may be subject to the same correction factor. On the other hand, their metallicity dependence is less apparent than LGRBs, so that their correction factor, if any, should be smaller than that of LGRBs. Overall, their rate of increase with redshift is slower than LGRBs, so that their role in damaging life at high- would be less significant than LGRBs.
References
- Aihara et al. (2011) Aihara, H., Allende Prieto, C., An, D., et al. 2011, ApJS, 193, 29
- Alam et al. (2015) Alam, S., Albareti, F. D., Allende Prieto, C., et al. 2015, ArXiv e-prints, arXiv:1501.00963
- Bambach (2006) Bambach, R. K. 2006, Annual Review of Earth and Planetary Sciences, 34, 127
- Berger (2014) Berger, E. 2014, ARA&A, 52, 43
- Bertelli et al. (1994) Bertelli, G., Bressan, A., Chiosi, C., Fagotto, F., & Nasi, E. 1994, A&AS, 106, 275
- Bloom et al. (2002) Bloom, J. S., Kulkarni, S. R., & Djorgovski, S. G. 2002, AJ, 123, 1111
- Bolzonella et al. (2000) Bolzonella, M., Miralles, J.-M., & Pelló, R. 2000, A&A, 363, 476
- Bovy & Rix (2013) Bovy, J., & Rix, H.-W. 2013, ApJ, 779, 115
- Brenchley et al. (2003) Brenchley, P. J., Carden, G. A., Hints, L., et al. 2003, Geological Society of America Bulletin, 115, 89
- Casagrande et al. (2011) Casagrande, L., Schönrich, R., Asplund, M., et al. 2011, A&A, 530, A138
- Dar et al. (1998) Dar, A., Laor, A., & Shaviv, N. J. 1998, Physical Review Letters, 80, 5813
- de Ugarte Postigo et al. (2014) de Ugarte Postigo, A., Thöne, C. C., Rowlinson, A., et al. 2014, A&A, 563, A62
- Eisenhauer et al. (2003) Eisenhauer, F., Schödel, R., Genzel, R., et al. 2003, ApJ, 597, L121
- Fong & Berger (2013) Fong, W., & Berger, E. 2013, ApJ, 776, 18
- Fong et al. (2010) Fong, W., Berger, E., & Fox, D. B. 2010, ApJ, 708, 9
- Gallazzi et al. (2008) Gallazzi, A., Brinchmann, J., Charlot, S., & White, S. D. M. 2008, MNRAS, 383, 1439
- Gehrels et al. (2003) Gehrels, N., Laird, C. M., Jackman, C. H., et al. 2003, ApJ, 585, 1169
- Gillessen et al. (2009) Gillessen, S., Eisenhauer, F., Trippe, S., et al. 2009, ApJ, 692, 1075
- Ilbert et al. (2014) Ilbert, O., Arnouts, S., Le Floc’h, E., et al. 2014, ArXiv e-prints, arXiv:1410.4875
- Kimm et al. (2009) Kimm, T., Somerville, R. S., Yi, S. K., et al. 2009, MNRAS, 394, 1131
- Kroupa (2001) Kroupa, P. 2001, MNRAS, 322, 231
- Kumar & Zhang (2015) Kumar, P., & Zhang, B. 2015, Phys. Rep., 561, 1
- Leibler & Berger (2010) Leibler, C. N., & Berger, E. 2010, ApJ, 725, 1202
- Liang et al. (2007) Liang, E., Zhang, B., Virgili, F., & Dai, Z. G. 2007, ApJ, 662, 1111
- Licquia & Newman (2014) Licquia, T. C., & Newman, J. A. 2014, ArXiv e-prints, arXiv:1407.1078
- Madau & Dickinson (2014) Madau, P., & Dickinson, M. 2014, ARA&A, 52, 415
- Maiolino et al. (2008) Maiolino, R., Nagao, T., Grazian, A., et al. 2008, A&A, 488, 463
- Mannucci et al. (2010) Mannucci, F., Cresci, G., Maiolino, R., Marconi, A., & Gnerucci, A. 2010, MNRAS, 408, 2115
- Maraston (2005) Maraston, C. 2005, MNRAS, 362, 799
- Maraston et al. (2009) Maraston, C., Strömbäck, G., Thomas, D., Wake, D. A., & Nichol, R. C. 2009, MNRAS, 394, L107
- McMillan (2011) McMillan, P. J. 2011, MNRAS, 414, 2446
- Melott & Thomas (2008) Melott, A. L., & Thomas, B. C. 2008, Paleobiology 35, 311
- Melott & Thomas (2011) —. 2011, Astrobiology, 11, 343
- Melott et al. (2004) Melott, A. L., Lieberman, B. S., Laird, C. M., et al. 2004, International Journal of Astrobiology, 3, 55
- Mortlock et al. (2015) Mortlock, A., Conselice, C. J., Hartley, W. G., et al. 2015, MNRAS, 447, 2
- Muzzin et al. (2013) Muzzin, A., Marchesini, D., Stefanon, M., et al. 2013, ApJ, 777, 18
- Piran & Jimenez (2014) Piran, T., & Jimenez, R. 2014, Physical Review Letters, 113, 231102
- Reid (1993) Reid, M. J. 1993, ARA&A, 31, 345
- Ruderman (1974) Ruderman, M. A. 1974, Science, 184, 1079
- Savaglio et al. (2009) Savaglio, S., Glazebrook, K., & Le Borgne, D. 2009, ApJ, 691, 182
- Scalo & Wheeler (2002) Scalo, J., & Wheeler, J. C. 2002, ApJ, 566, 723
- Smee et al. (2013) Smee, S. A., Gunn, J. E., Uomoto, A., et al. 2013, AJ, 146, 32
- Strateva et al. (2001) Strateva, I., Ivezić, Ž., Knapp, G. R., et al. 2001, AJ, 122, 1861
- Sun et al. (2015) Sun, H., Zhang, B. & Li, Z., 2015, ApJ, submitted
- Sutcliffe et al. (2000) Sutcliffe, O. E., Dowdeswell, J. A., Whittington, R. J., Theron, J. N., & Craig, J. 2000, Geology, 28, 967
- Svensmark (2012) Svensmark, H. 2012, MNRAS, 423, 1234
- Thomas et al. (2005a) Thomas, B. C., Jackman, C. H., Melott, A. L., et al. 2005a, ApJ, 622, L153
- Thomas et al. (2015) Thomas, B. C., Neale, P. J., & Snyder, II, B. R. 2015, Astrobiology, 15, 207
- Thomas et al. (2005b) Thomas, B. C., Melott, A. L., Jackman, C. H., et al. 2005b, ApJ, 634, 509
- Thorsett (1995) Thorsett, S. E. 1995, ApJ, 444, L53
- Virgili et al. (2011) Virgili, F. J., Zhang, B., Nagamine, K., & Choi, J.-H. 2011, MNRAS, 417, 3025
- Wainwright et al. (2007) Wainwright, C., Berger, E., & Penprase, B. E. 2007, ApJ, 657, 367
- Wanderman & Piran (2010) Wanderman, D., & Piran, T. 2010, MNRAS, 406, 1944
- Weinmann et al. (2011) Weinmann, S. M., Neistein, E., & Dekel, A. 2011, MNRAS, 417, 2737
- Woosley & Bloom (2006) Woosley, S. E., & Bloom, J. S. 2006, ARA&A, 44, 507