The study of the thermal neutron flux in
the deep underground laboratory DULB-4900111
Talk at The International Workshop on Prospects of Particle Physics: ”Neutrino
Physics and Astrophysics” February 01 - Ferbuary 08, 2015, Valday, Russia
V.V. Alekseenko†, Yu.M. Gavrilyuk†, A.M. Gangapshev†, A.M. Gezhaev†,
D.D. Dzhappuev†, V.V. Kazalov†, A.U. Kudzhaev†, V.V. Kuzminov†,
S.I. Panasenko‡, S.S. Ratkevich‡, D.A. Tekueva†,
S.P. Yakimenko†, Yu.V. Sten ’kin†
† Institute for Nuclear Research, RAS, Moscow, Russia
‡ Kharkiv National University, Kharkiv, Ukraine
Abstract
We report on the study of thermal neutron flux using monitors based on mixture of ZnS(Ag) and LiF enriched with a lithium-6 isotope at the deep underground laboratory DULB-4900 at the Baksan Neutrino Observatory. An annual modulation of thermal neutron flux in DULB-4900 is observed. Experimental evidences were obtained of correlation between the long-term thermal neutron flux variations and the absolute humidity of the air in laboratory. The amplitude of the modulation exceed 5% of total neutron flux.
Keyword: Neutron background, Underground laboratory, Low-background measurements
1 Introduction
The characterization of the neutron fluence has become a critical issue for experiments that require these extreme low-background environments, such as -decay, dark matter searches, and solar neutrino experiments [1, 2, 3]. As direct detection dark matter experiments seek to detect WIMP dark matter by observing nuclear recoils produced by WIMP interactions with nuclei, and as single scatter neutron events can produce nuclear recoils that are indistinguishable from WIMP interactions, the issue of in situ background control is particularly relevant in considering neutron backgrounds. Annual modulation of neutron flux in underground facilities could mimic annual modulation of signal from WIMPs, due to elastic scattering on nuclei of target. The neutron flux could depend on parameters such as humidity, temperature, pressure and other meteorological conditions. The long term measurement of thermal neutron flux is performed to study these dependencies for underground facilities at the Baksan Neutrino Observatory of the Institute for Nuclear Researches Russian Academy of Science (BNO INR RAS) [4].
2 Experimental setup
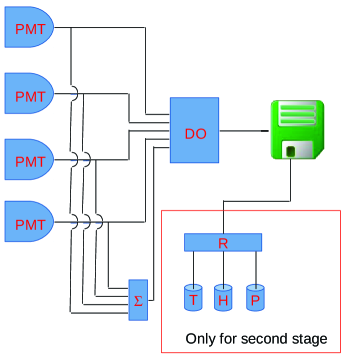
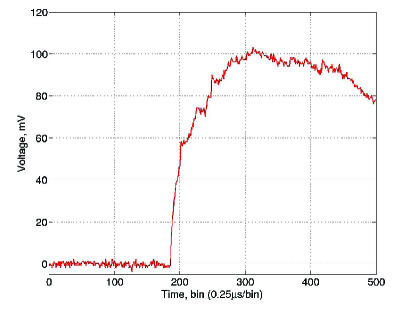
The measurements are performed in box A1 of deep underground laboratory DULB-4900 (at a depth of 4900 m w.e., cosmic ray flux is reduced by a factor ) [5]. Where the temperature of the air is C and is stable during the year. The experimental setup consist of four detectors (D1, D2, D3 and D4) and three sensors (temperature, humidity, pressure). The detectors are identical to that used in [6]. The schematic view of the setup is presented in Fig. 1. Each detector is an aluminium container with sizes mm3 which is viewed by photomultiplier tube (FEU-49), see Fig. 2. Thin scintillator made of solid granulated alloy 6LiF+ZnS(Ag) ( in mass, thickness is mg/cm2) with the area of mm2 is placed on the bottom of the container. The reaction 6Li+H + is used to detect thermal neutrons (Q=4.79 MeV, keV, keV, b at 300 K). The signals from each PMTs are splited after preamplifier, one goes to summator, another goes directly to input of digital oscilloscope. The signal after summator goes to input of digital oscilloscope as well. The sample of recorded signal is shown in Fig. 3.
Each detector is an aluminium container with sizes mm3 which is viewed by photomultiplier tube (FEU-49), see Fig. 2.
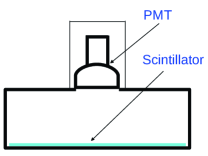
Thin scintillator made of solid granulated alloy 6LiF+ZnS(Ag) ( in mass, thickness is mg/cm2) with the area of mm2 is placed on the bottom of the container. Detectors are similar to that proposed in [6]. The reaction 6Li+H + is used to detect thermal neutrons (Q=4.79 MeV, keV, keV, b at 300 K). The signals from each PMTs are splited after preamplifier, one goes to summator, another goes directly to input of digital oscilloscope. The signal after summator goes to input of digital oscilloscope as well. The sample of recorded signal is shown in Fig. 3.
Between first and second stages, detectors were alternately calibrated with neutron source (-source). -source consisted of set of -sources (238Pu + 239Pu + 226Ra + triplet / 233U + 238Pu + 239Pu /, total activity - 131 kBq) covered with mm beryllium foil. Sources were placed inside cylindrical polyethylene box. The thickness of the box wall is cm. Neutrons come from reaction 9Be+ 12C + (Q=5.5 MeV, MeV, b, ). Estimated activity of -source is s h-1.
The -source was attached to the bottom of detectors (close to the scintillator), so % of neutrons cross the scintillator. But only small part of neutrons are thermalised after passing 5 cm of polyethylene. Spectra collected with detector D1 are presented in Fig. 4 as example. The response of all detectors on -source are similar, with increasing of count rate by 700 cts/day (see Fig. 5).
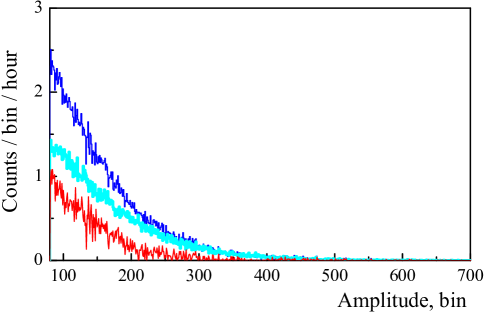
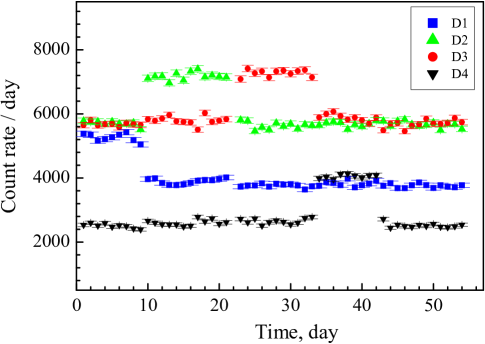
The difference in background count rate of detectors is due to different contamination of 210Pb in scintillators. Which appears in decay chain of 222Rn, when during production of scintillators daughter ions of 222Rn stick to the surface of the scintillator. The half-life of 210Pb is 22.3 y. It’s daughter nuclei 210Po decays due to -decay inside the scintillator giving a signal similar to that from neutron detection. Assuming that detector D4 has no intrinsic background from 210Po we may conclude that sum count rate of all detectors from neutrons cts/day at the beginning of calibration, rest cts/day - intrinsic background from 210Po.
3 Results
First stage of the main measurements started 08 August 2012 y and finished 25 September 2013. Second stage started 06 November 2013, with additional elements in the setup: temperature, humidity and pressure sensors. In total, at the moment, we collected data for years. The behaviour of the sum count rate of the detectors is presented in Fig. 6.
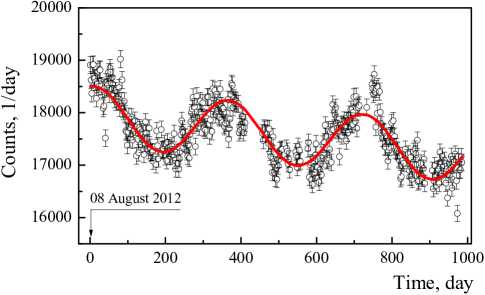
The data, when all conditions were stable are used (ventilation system of tunnel is working well, gates are closed). The count rate is well fitted with cosine function with decreasing base line:
| (1) |
where - count rate [cts/day], - time [day], , , , , . So, the amplitude of neutron flux modulation % taking into account the intrinsic background from 210Po.
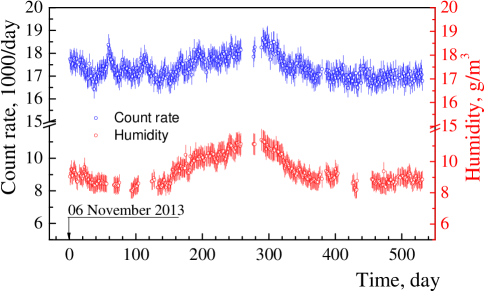
The behaviour of the count rate of the detectors and humidity is very similar to that measured in work [6]. The continuous decrease of count rate is due to decay of 210Pb. The maximums in count rate corresponds to summer, while minimum - winter. The explanation is, that the count rate depends on absolute humidity of the air in laboratory. Probably, humidity in air works as an additional moderator for neutrons coming from rock. The comparison of sum count rate of the setup with the humidity of the air in lab is presented in Fig. 7. It is well seen the strong correlation between count rate and humidity. In Fig. 8 the dependence of count rate from humidity of the air and fit result by linear function are shown. Thus, additional 1 g/m3 of humidity in air gives a rise in sum count rate of detectors cts/day. This value is similar to amplitude of the annual modulation of count rate.
It is well seen the strong correlation between count rate and humidity. In Fig. 8
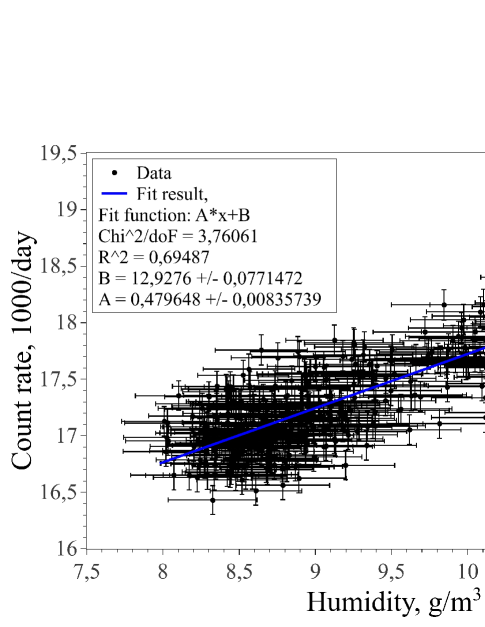
the dependence of count rate from humidity of the air and fit result by linear function are shown. Thus, additional 1 g/m3 of humidity in air gives a rise in sum count rate of detectors cts/day. This value is similar to amplitude of the annual modulation of count rate.
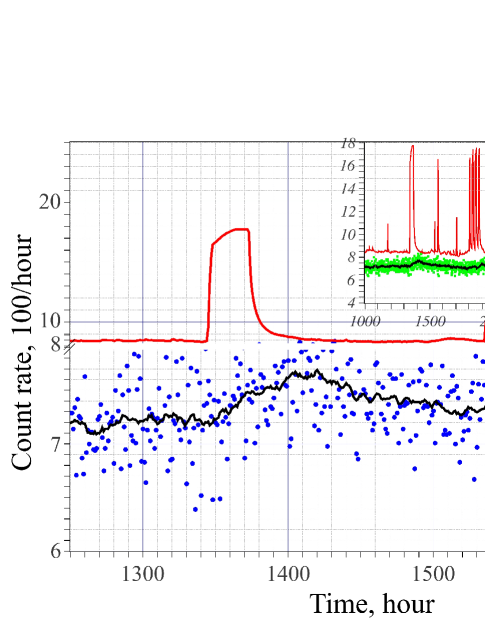
Another effect seen by our setup is, that in case of quick rise of humidity (for example ventilation of the tunnel is stopped) the count rate start to rise slowly (see Fig. 9). Assuming, that rise in count rate is 30 cts/h during 30 h and that additional humidity of 9 g/m3 should give rise in count rate cts/h, we may conclude, that it takes h to get equilibrium. Such delay could be explained by humidification of the rock surface in the lab. It means two possible effect: 1 - better thermalization (moderation) of the neutrons from the bulk rock crossing cracks filled with water (humidity), 2 - higher albedo (reflection, refraction) of the neutrons incoming in to the rock, thus the lab with the humid wall works as a neutron trap. As result total flux of neutrons in the lab become higher.
4 Conclusion.
We performed long time measurement the background thermal neutron flux at underground laboratory DULB-4900 of BNO INR RAS, which is located at 3670 m from the entrance to underground facilities. Total time of measurements was equal to 2.7 years. The correlation of the counting rate of thermal neutrons with humidity (high humidity increases the neutron thermalization probability in air) was detected. An observed annual modulation of thermal neutron flux at DULB-4900 exceed 5% of total neutron flux. Such effects mean, that, for example, experiments looking for WIMPs should be carried out in a labs with walls covered by neutron shield ( cm of polyethylene mm of cadmium sheet, or equivalent).
The measurements are continuing.
The work was made in accordance with INR RAS plan of the Research and Developments.
References
- [1] Gavrilyuk Yu.M., Gangapshev A.M., Kazalov V.V., et al., Indications of capture in 78Kr // Phys. Rev. C 2013. V.87, P.035501.
- [2] Gavrilyuk Yu.M., Gangapshev A.M., Kazalov V.V., et al., First Result of the Experimental Search for the -Capture of 124Xe with the Copper Proportional Counter // Physics of Particles and Nuclei, 2015, V.46, No.2, P.147.
- [3] Gavrin V.N., The Russian-American gallium experiment SAGE // Phys. Usp. 2011. V.54 P.941.
- [4] Kuzminov V.V., The Baksan Neutrino Observatory // Eur. Phys. J. Plus 2012. V.127. P.113.
- [5] Gavriljuk Ju.M., Gangapshev A.M., Gezhaev A.M. et al., Working characteristics of the New Low Background Laboratory (DULB-4900, Baksan Neutrino Observatory) // Nucl. Instr. Meth. A, 2013. V.729. P.576; arXiv: physics.ins-det/1204.6424; doi: 10.1016/j.nima.2013.07.090.
- [6] Alekseenko V.V., Gavriluk Yu.M., Kuzminov V.V., and Stenkin Yu.V., Tidal effect in the radon-due neutron flux from the Earth ’s crust // Journal of Physics: Conference Series 2010. V.203., 012045;