Electronic nematic correlations in the stress free tetragonal state of BaFe2-xNixAs2
Abstract
We use transport and neutron scattering to study electronic, structural, and magnetic properties of the electron-doped BaFe2-xNixAs2 iron pnictides in the external stress free detwinned state. Using a specially designed in-situ mechanical detwinning device, we demonstrate that the in-plane resistivity anisotropy observed in the uniaxial strained tetragonal state of BaFe2-xNixAs2 below a temperature , previously identified as a signature of the electronic nematic phase, is also present in the stress free tetragonal phase below (). By carrying out neutron scattering measurements on BaFe2As2 and BaFe1.97Ni0.03As2, we argue that the resistivity anisotropy in the stress free tetragonal state of iron pnictides arises from the magnetoelastic coupling associated with antiferromagnetic order. These results thus indicate that the local lattice distortion and nematic spin correlations are responsible for the resistivity anisotropy in the tetragonal state of iron pnictides.
pacs:
74.25.Ha, 74.70.-b, 78.70.NxThere is growing experimental evidence suggesting that the electronic nematic phase, a translationally invariant metallic phase (satisfy the -rotational or symmetry) with a spontaneously generated spatial electronic anisotropy, is intimately connected with high-transition (high-) temperature superconductivity fradkin . For iron pnictide superconductors such as BaFeAs2 ( Co, Ni) kamihara ; stewart ; dai ; cruz ; qhunag ; mgkim , their parent compound BaFe2As2 exhibits a tetragonal to orthorhombic structural phase transition at temperature , followed by a paramagnetic to antiferromagnetic (AF) phase transition at () with a collinear AF structure [Fig. 1(a)] cruz ; qhunag ; mgkim . Upon electron-doping via Co or Ni substitution for Fe, the and are gradually Figure1 Figure2 Figure3 Figure4 Supp1 Supp2 Supp3ressed and optimal superconductivity emerges near for BaFe2-xNixAs2 CLester09 ; Nandi ; Yoshizawa12 ; HQLuo12 ; XYLu13a . Due to the formation of twin domains in the orthorhombic state of BaFeAs2 below , the intrinsic electronic properties of these materials can be probed by applying a uniaxial pressure (strain) along one-axis of the orthorhombic lattice to detwin the single crystal jhchu ; matanatar ; fisher ; chu12 . While there is indeed a large in-plane resistivity anisotropy in the uniaxial strain detwinned BaFeAs2 below , the anisotropy persists in the paramagnetic tetragonal state below a characteristic temperature (), thus suggesting the presence of electronic nematic correlations above and below jhchu ; matanatar ; fisher ; chu12 ; HHKuo ; HHKuo15 . However, since the uniaxial strain necessary to detwin the sample also enhances Dhital and introduces an explicit symmetry breaking field, it is unclear if there will be resistivity anisotropy in the stress free tetragonal state below upon releasing the applied external uniaxial strain. From transport chu12 ; HHKuo ; HHKuo15 , inelastic neutron scattering xylu14 , and thermodynamic measurements XLuo15 , is believed to mark a temperature range of nematic fluctuations with structure and magnetic phase transitions occurring at and , respectively. On the other hand, magnetic torque and X-ray diffraction experiments on stress free samples of BaFe2As2 suggest that is a signature of a “true” second-order nametic phase transition from the high-temperature tetragonal phase to a low-energy orthorhombic phase Kasahara12 . To understand the role of electronic nematic phase in high- superconductivity, it is important to reveal the origin of the resistivity anisotropy above without external uniaxial strain and determine the nature of the nematic correlations below fernandes11 .
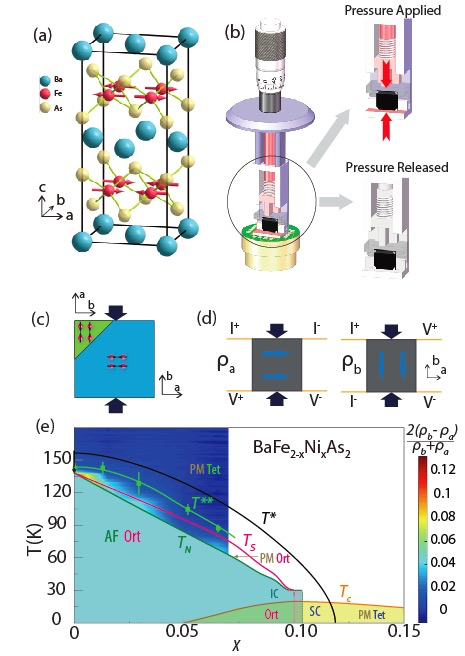
We use transport and neutron scattering to study the resistivity anisotropy, magnetic order, and lattice distortion in parent compound BaFe2As2 ( K) and electron-doped BaFe2-xNixAs2 (). In previous transport and neutron scattering measurements, the applied uniaxial pressure necessary to detwin the crystal in the orthorhombic AF phase remains in the paramagnetic tetragonal state (), thus complicating the interpretation of the observed in-plane resistivity and spin excitation anisotropy jhchu ; matanatar ; chu12 ; HHKuo ; HHKuo15 ; Dhital ; xylu14 . To avoid this problem, we have designed an in-situ mechanical sample clamp which can apply and release uniaxial pressure at any temperature, similar to the device used to study the anisotropic optical response in iron pnictides Mirri . Figure 1(b) shows the schematics of the sample stick with a micrometer on the top. The magnitude of the uniaxial pressure along the -axis direction of the orthorhombic lattice is applied by a spring that is controlled by the displacement of the micrometer (and external applied pressure) [Fig. 1(c)]. By applying uniaxial pressure at room temperature (above and ), cooling the sample to below , and then releasing the pressure, we can in principle obtain the single domain sample without external strain (stress free). To conclusively determine the sample detwinning ratio and compare them with the resistivity anisotropy measurement, we used two original sample sticks one for transport in a physical property measurement system (PPMS) and one for neutron scattering experiment on IN8 triple-axis spectrometer at Institut Laue-Langevin (ILL). Our key finding is that the resistivity anisotropy in BaFe2-xNixAs2 seen in the uniaxial strained tetragonal phase below is also present in the stress free tetragonal state, but at a lower temperature [Fig. 1(e)]. In addition, our neutron Larmor diffraction measurements Rekveldt2001 ; Pfleiderer on temperature dependence of the lattice spacing () and its distortion () in lightly electron-doped iron pnictides reveal that the lattice distortion increases on cooling, passes smoothly across , and enhances dramatically on approaching with no observable anomaly above . These results suggest that the resistivity anisotropy observed in the external uniaxial pressure free tetragonal state of BaFe2-xNixAs2 arises from a strong magnetoelastic coupling induced by AF order, and there are no additional thermodynamic phase transitions above Fernandes13 ; XLuo15 . Therefore, the Ising-nematic correlations, a state with no magnetic long-range order (staggered magnetization ) but with local broken symmetry lattice distortion CCL ; si ; jphu , is the driving force for the observed resistivity anisotropy fernandes11 ; CCL ; si ; jphu .
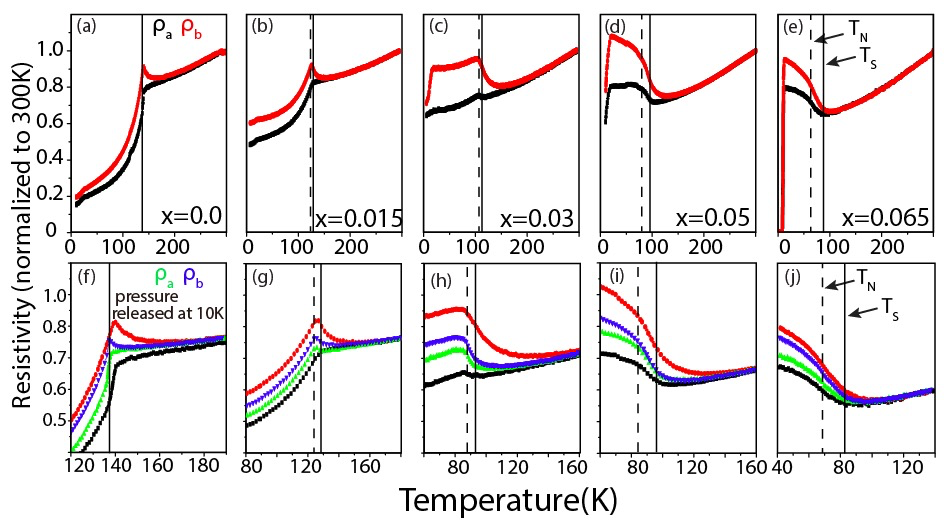
We first compare transport measurements obtained on single domain samples detwinned using a standard mechanical clamp and the new device [Fig. 1(b)]. The resistivity data along the orthorhombic and directions are measured via the Montgomery method Montgomery . Resistivity along the () and () directions are measured in the same cycle using different current directions with wiring diagram shown in Fig. 1(d). Two sets of resistivity data as a function of temperature were collected for the detwinned crystals of BaFe2-xNixAs2. Figure 2(a)-2(e) shows temperature dependence of and for , respectively, under 10 MPa of uniaxial pressure. Consistent with previous work fisher , we see clear resistivity anisotropy () at temperatures above the strain free and marked as vertical dashed and solid lines, respectively. The green and blue lines in Figures 2(f)-2(j) show and , respectively, on the warming cycle when the room-temperature applied strain is released at base temperature (10 K). The corresponding and under uniaxial strain in Fig. 2(a)-2(e) are shown as black and red lines in Fig. 2(f)-2(j).
In the undoped parent compound (), the uniaxial strain clearly increases the temperature below which the resistivity decreases with decreasing temperature [Fig. 2(f)], consistent with the notion that the uniaxial strain necessary for detwinning the sample also increases the of the system Dhital . In addition, we see that the uniaxial strain itself enhances the resistivity anisotropy both below and above (). Although much reduced, the resistivity anisotropy () is also present in the stress free tetragonal state above (). When the Ni-doping level is increased to , we find similar trend for strained and stress free resistivity [Figs. 2(g) and 2(h)]. Since and are now clearly separated, we can see that the resistivity reduction in the stress free sample happens below , and the resistivity anisotropy shows no observable anomaly across . Upon further increasing the Ni-doping levels to , the resistivity smoothly increases on cooling across and no longer displays a clear kink below . At all doping levels studied, we find resistivity anisotropy in stress free samples above and (Fig. 2).

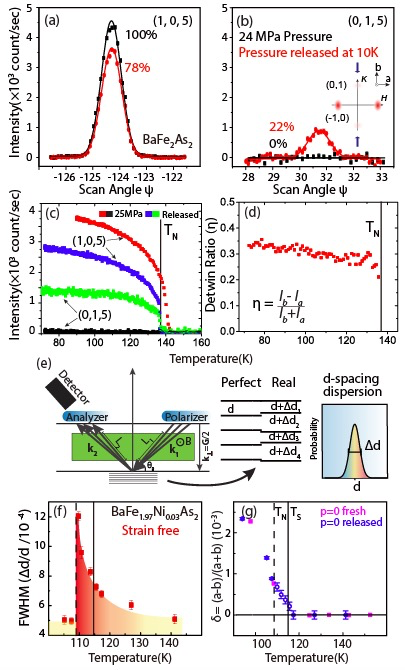
Although transport data in Fig. 2 revealed clear evidence for resistivity anisotropy in the stress free tetragonal state of underdoped BaFe2-xNixAs2 [Fig. 1(e)], these measurements cannot determine the sample detwinning ratio upon releasing the uniaxial strain at low temperature and microscopic origin of the resistivity anisotropy above . To address these questions, we carried out neutron diffraction experiments on BaFe2As2 using an in-situ detwinning device similar to Fig. 1(b) and the flat-cone option of the IN8 triple-axis spectrometer at ILL kulda . In addition, we performed neutron Larmor diffraction measurement on BaFe1.97Ni0.03As2 using the TRISP triple-axis at Heinz Maier-Leibnitz, Garching, Germany Rekveldt2001 ; Pfleiderer . We first describe neutron diffraction experiments on IN8 designed to study the detwinning ratio and its temperature dependence in strained and stress free BaFe2As2, as these results will allow us to determine if the detwinning ratio is maintained after releasing the uniaxial strain below . For the experiment, an annealed square-shaped single crystal of BaFe2As2 (220 mg) was mounted on a specially designed sample stick inside an orange cryostat. The momentum transfer in three-dimensional reciprocal space in Å-1 is defined as , where , , and are Miller Indies and , , XYLu13a . In the AF ordered state of a 100% detwinned sample, the AF Bragg peaks should occur at () positions in reciprocal space and be absent at . Our sample is aligned in the scattering plane. Using the flatcone setup on IN8 kulda , we can access both and Bragg positions. When a pressure of 24 MPa is applied along the direction of BaFe2As2, the sample is 100% detwinned with no magnetic scattering at (0, 1, 5) [Fig. 3(a) and 3(b)]. After releasing the uniaxial pressure at 10 K, we see that the sample becomes partially twinned again with magnetic scattering intensity at both and , giving a detwinning ratio of % (). This is consistent with transport measurements indicating a smaller resistivity anisotropy in the stress free BaFe2As2 [Fig. 2(f)]. Figure 3(c) shows temperature dependence of the magnetic scattering at and under 25 MPa uniaxial pressure and stress free. While the sample is 100% detwinned under 25 MPa below with no magnetic scattering at , the stress free sample has finite intensity at both and below . Figure 3(d) shows temperature dependence of , which reveals a decreasing detwinning ratio on warming to .
In previous studies of the neutron extinction effect on the nuclear Bragg peak of BaFe2As2 in zero pressure xylu14 , its intensity is found to deviate from normal behavior below 150 K before displaying a step like feature at K, suggesting the presence of fluctuating orthorhombic structural domains above . Using neutron Larmor diffraction with polarized neutrons [Fig. 3(e)], we can precisely determine temperature dependence of the lattice parameter and its distortion Rekveldt2001 ; Pfleiderer . Since transport measurements in Fig. 2 suggest that the resistivity anisotropy in stress free detwinned sample reduces dramatically above and shows no visible anomaly across for lightly electron-doped BaFe2-xNixAs2 [Fig. 2(g) and 2(h)], we decided to study temperature dependence of the lattice distortions and orthorhombicity in BaFe1.97Ni0.03As2 mgkim , where and are well separated as determined from transport and neutron diffraction experiments. For this purpose, we focus on (4,0,0) Bragg peak, which has a -spacing . In a classical second order magnetic phase transition, one would expect that spin-spin correlation length increases on cooling and diverges at , while the underlying lattice correlations remain long-ranged and temperature independent. Surprisingly, our neutron Larmor diffraction measurements on stress free BaFe1.97Ni0.03As2 reveal that the lattice distortion () of the system shows no visible anomaly across ( K), but increases continuously on cooling below before collapsing abruptly below ( K) [Fig. 3(f)] supplementary . Similarly, instead of being a temperature independent constant, the lattice correlation length decreases on cooling, changing smoothly from 2500 Å around 150 K to 1000 Å just above with no anomaly across supplementary . Figure 3(g) compares temperature dependence of the lattice orthorhombicity for BaFe1.97Ni0.03As2 without applying any external strain and in strain released sample. In both cases, we see that AF order induces a large change in lattice orthorhombicity, consistent with previous X-ray scattering work mgkim . Therefore, BaFe1.97Ni0.03As2 exhibits a strong magnetoelastic coupling near .
Figure 4 summarizes temperature dependence of the resistivity anisotropy, defined as , for uniaxial strained and stress free BaFe2-xNixAs2 with . Similar to previous work chu12 ; HHKuo ; HHKuo15 , we find that temperature dependence of the resistivity anisotropy in uniaxial strained samples can be well described by a Curie-Weiss functional form above the strain free and below [see solid lines in Fig. 4(a)-4(d)]. When uniaxial strain is released, the resistivity anisotropy and its appearance temperature are dramatically reduced. Nevertheless, it is clearly present above in the tetragonal phase. For strain free samples cooled from high-temperature paramagnetic tetragonal phase, there are no resistivity anisotropy above [see green data points in Fig. 4(a)]. The small resistivity anisotropy below is due to slight imbalance in the twin domain populations.
To understand the observed resistivity anisotropy behavior, we consider a microscopic scenario as shown in Fig. 4(e)-4(h). In the low-temperature uniaxial strained detwinned state, the undoped and underdoped BaFe2-xNixAs2 form a single domain homogeneous magnetic ordered state with intrinsic resistivity anisotropy that is weakly electron-doping dependent [Fig. 4(a)-4(d), ]. Upon releasing the uniaxial strain, the sample becomes partially detwinned AF ordered state with reduced resistivity anisotropy [Fig. 4(f)]. On further warming to temperatures above and , these materials exhibit a large lattice distortion across but much less anomaly across [Fig. 3(f) and 3(g)] mgkim . These results suggest that the resistivity anisotropy seen in the narrow temperature region above is due to the remnant local lattice distortions arising from the large magnetoelastic coupling across [Fig. 4(g)]. The system finally relaxes to the true homogeneous tetragonal state without resistivity anisotropy at temperatures above . Since our neutron Larmor diffraction measurements showed no additional anomaly in lattice parameters and lattice distortion above , we conclude that there is no thermodynamic phase transition at and in agreement with recent heat capacity measurements XLuo15 . The resistivity anisotropy seen in the stress free detwinned samples below on warming across is then due to local spin nematic correlations and associated lattice distortions arising from the magnetoelastic coupling through the collinear AF state below . The absence of such effect in strain free sample on cooling confirms this scenario and the weakly first order nature of the magnetic transition.
In summary, by using a specially designed in-situ detwinning device, we have discovered the presence of resistivity anisotropy in the tetragonal phase of stress free BaFe2-xNixAs2 below , a temperature lower than associated with resistivity anisotropy in uniaxial strained sample jhchu ; matanatar ; fisher ; chu12 . Our neutron diffraction experiments confirm the partially detwinned state in the stress free sample, thus indicating that the observed resistivity anisotropy arises from local spin nematic correlations and lattice distortions. Furthermore, our neutron Larmor diffraction experiments on lightly electron-doped BaFe1.97Ni0.03As2 indicate lattice distortions across and with no evidence of another phase transition above . These results thus establish that resistivity anisotropy in the tetragonal phase arises from the magnetoelastic coupling associated with static AF order, suggesting the presence of local Ising-nematic spin correlations and lattice distortions in the tetragonal state of electron-doped iron pnictides near .
We are grateful to Sebastien Turc, E. Bourgeat-Lami, E. Lelivre-Berna of ILL, France for designing and constructing the detwinning device used at IN8. The transport and neutron work at Rice is supported by the U.S. NSF-DMR-1362219 and DMR-143606 (P.D.). This work is also supported by the Robert A. Welch Foundation Grant Nos. C-1839 (P.D.) and C-1411 (Q.S.). Q.S. is supported by the U.S. NSF- DMR-1309531.
References
- (1) E. Fradkin, S. A. Kivelson, M. J. Lawler, J. P. Eisenstein, and A. P. Mackenzie, Annu. Rev. Condens. Matter Phys. 1, 153-178 (2010).
- (2) Y. Kamihara, T. Watanabe, M. Hirano, and H. Hosono, J. Am. Chem. Soc. 130, 3296-3297 (2008).
- (3) G. R. Stewart, Rev. Mod. Phys. 83, 1589-1652 (2011).
- (4) P. C. Dai, J. P., Hu, and E. Dagotto, Nature Phys. 8, 709 (2012).
- (5) C. de la Cruz et al., Nature 453, 899-902 (2008).
- (6) Q. Huang et al., Phys. Rev. Lett. 101, 257003 (2008).
- (7) M. G. Kim et al., Phys. Rev. B 83, 134522 (2011).
- (8) C. Lester, J.-H. Chu, J. G. Analytis, S. C. Capelli, A. S. Erickson, C. L. Condron, M. F. Toney, I.R. Fisher, and S. M. Hayden, Phys. Rev. B 79, 144523 (2009).
- (9) S. Nandi, M. G. Kim, A. Kreyssig, R.M. Fernandes, D. K. Pratt, A. Thaler, N. Ni, S. L. Bud’ko, P. C. Canfield, J. Schmalian, R. J. McQueeney, and A. I. Goldman, Phys. Rev. Lett. 104, 057006 (2010).
- (10) M. Yoshizawa, D. Kimura, T. Chiba, S. Simayi, Y. Nakanishi, K. Kihou, C.-H. Lee, A. Iyo, H. Eisaki, M. Nakajima, and S. Uchida, J. Phys. Soc. Jpn. 81, 024604 (2012).
- (11) H. Q. Luo, R. Zhang, M. Laver, Z. Yamani, M. Wang, X.Y. Lu, M.Y. Wang, Y. C. Chen, S. L. Li, S. Chang, J.W. Lynn, and P. Dai, Phys. Rev. Lett. 108, 247002 (2012).
- (12) X. Y. Lu et al., Phys. Rev. Lett. 110, 257001 (2013).
- (13) J. H. Chu et al., Science 329, 824 (2010).
- (14) M. A. Tanatar et al., Phys. Rev. B 81, 814508 (2010).
- (15) I. R. Fisher, L. Degiorgi, L., and Z. X. Shen, Rep. Prog. Phys. 74, 124506 (2011).
- (16) J. H. Chu, H. -H. Kuo, J. G. Analytis, I. R. Fisher, Science 337, 710 (2012).
- (17) H.-H Kuo, M. C. Shapiro, S. C. Riggs, I. R. Fisher, Phys. Rev. B 88, 085113 (2013).
- (18) H. -H. Kuo, J. -H. Chu, S. A. Kivelson, and I. R. Fisher, arXiv 1503.00402v1.
- (19) C. Dhital, T. Hogan, Z. Yamani, R. J. Birgeneau, W. Tian, M. Matsuda, A. S. Sefat, Z. Wang, and S. D. Wilson, Phys. Rev. B 89, 214404 (2014).
- (20) X. Y. Lu, J. T. Park, R. Zhang, H. Q. Luo, A. H. Nevidomskyy, Q. Si, and P. C. Dai, Science 345, 657 (2014).
- (21) X. Luo, V. Stanev, B. Shen, L. Fang, X. S. Ling, R. Osborn, S. Rosenkranz, T. M. Benseman, R. Divan, W.-K. Kwok, and U. Welp, Phys. Rev. B 91, 094512 (2015).
- (22) S. Kasahara, H. J. Shi, K. Hashimoto, S. Tonegawa, Y. Mizukami, T. Shibauchi, K. Sugimoto, T. Fukuda, T. Terashima, A. H. Nevidomskyy, and Y. Matsuda, Nature 486, 382 (2012).
- (23) R. M. Fernandes, A. V. Chubukov, and J. Schmalian, Nature Phys. 10, 97 (2014).
- (24) C. Mirri, A. Dusza, S. Bastelberger, J.-H. Chu, H.-H. Kuo, I. R. Fisher, and L. Degiorgi, Phys. Rev. B 89, 060501(R) (2014).
- (25) M. T. Rekveldt, T. Keller, and R. Golub, Europhys. Lett. 54, 342 (2001).
- (26) C. Pfleiderer, P. Bni, T. Keller, U. K. Rler, and A. Rosch, Science 316, 1871 (2007).
- (27) R. M. Fernandes, A. E. Bhmer, C. Meingast, and J. Schmalian, Phys. Rev. Lett. 111, 137001 (2013).
- (28) P. Chandra, P. Coleman, and A. I. Larkin, Phys. Rev. Lett. 64, 88-91 (1990).
- (29) J. Dai, Q. Si, J. X. Zhu, and E. Abrahams, PNAS 106, 4118 (2009).
- (30) J. P. Hu and C. K. Xu, Physica C 481, 215 (2012).
- (31) H. C. Montgomery, J. Appl. Phys. 42, 2971 (1971).
- (32) J. Kulda, Nuclear Engineering and Technology 38, 433 (2006).
- (33) For detailed data analysis and additional transport results, see supplementary material.
Appendix A Supplementary Materials for: Electronic nematic correlations in the stress free tetragonal state of BaFe2-xNixAs2
A.1 Sample Information
The BaFe2-xNi1-xAs2 single crystals were grown using self-flux method as described before ycchen . The crystal orientation was determined by X-ray Laue machine, and the square shaped samples were cut for Montgomery method resistivity measurements. The samples were annealed at 800 K for 2 days to reduce defects and disorder.
A.2 Resistivity measurement: Montgomery method
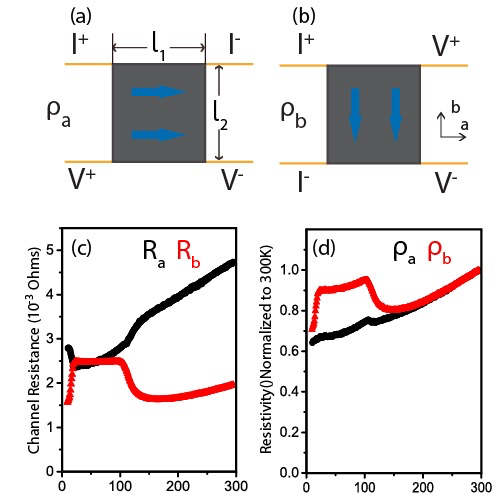
For sheet like samples, measurement of anisotropic in-plane resistivity can be carried out by Montgomery method Montgomery:2003bn . The samples are cut along the and axes directions into a squared shape with the -axis perpendicular to the squared surface. Current is applied through contacts at two adjacent corners of the planar face and the potential is measured at the other two corners at the same plane [SFig 1.(a)]. From the measurements, we can get . Similar measurements can be done with the electrical connections rotated 90∘ with respect to the original setup [SFig1.(b)], which gives . This will allow calculations of the resistivity anisotropy.
Results from an anisotropic sample with dimensions , , , and resistivity can be estimated from an isotropic sample with dimension , , with the transformation:
| (1) |
and
| (2) |
Through theoretical calculations, we can get for small / ratio:
| (3) |
and the anisotropic resistivity in the plane can be written as:
| (4) |
and
| (5) |
In the case of BaFe2-xNixAs2 , and are pre-factors that can be normalized as . Then and can be determined by resistance measurement and by two different channel on PPMS resistivity puck, as shown in SFig 1.(c) and (d). and derived from Montgomery method is the equivalent resistivity by the mixture of two domains angling with initial resistivity of and .
A.3 Pressure Dependence Measurements of the resistivity anisotropy
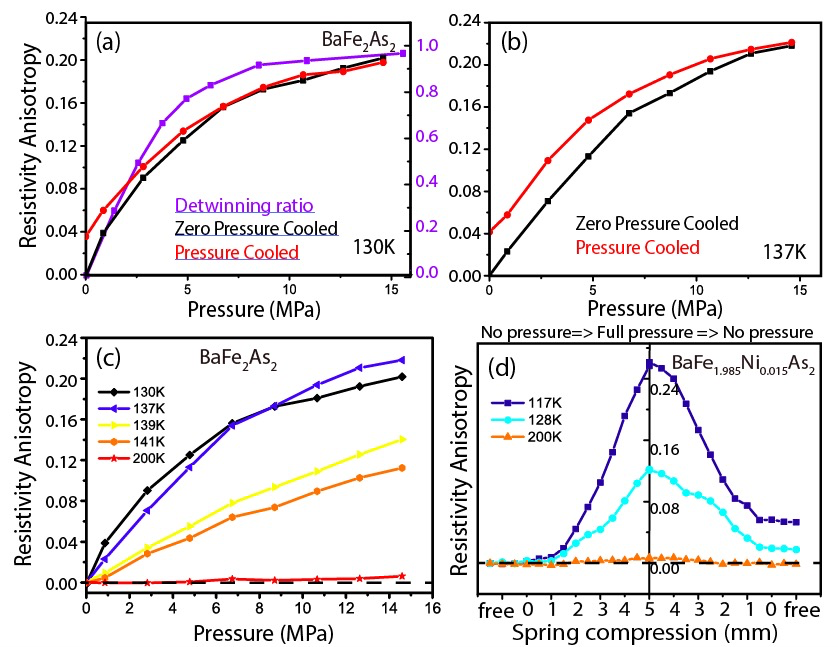
The pressure dependence of the in-plane resistivity was studied systematically both as a function of Ni-doping and temperature. The magnitude of the uniaxial pressure applied to the system is determined approximately by the length compression of the spring as shown in Fig. 1(b) of the main text. In SFig. 2(a), we show pressure dependence of the resistivity anisotropy defined as for zero pressure cooled and pressure cooled case of BaFe2As2. The pressure dependence of the detwinning ratio is also plotted. In the zero pressure cooled case, the sample was cooled down to 10 K with no pressure applied and then temperature was raised to the targeted temperature. In the pressure cooled case, the sample was cooled with maximum pressure ( 15 MPa) to 10 K, then the pressured is released at 10 K and temperature was raised to the targeted temperature. To the first order approximation, the resistivity anisotropy tracks the detwinning ratio of the system before the sample is fully detwinned. SFigure 2(b) shows similar data at 137 K. SFigure 2(c) shows pressure dependence of the resistivity anisotropy across the AF ordering () and structural () transitions. For temperatures above and , the pressure and resistivity anisotropy relationship becomes linear and the slope decreases with increasing temperature, consistent with previous work HHKuo15 . In SFigure 2(d), we plot the pressure dependence of the resistivity anisotropy at different temperatures below and above and for BaFe1.985Ni0.015As2. Clear hysteresis is seen in the data, suggesting a partially detwinned sample after releasing the pressure. For the pressure released partially detwined sample, the resistivity anisotropy and the detwinning ratio follow the same trend before , as shown in SFig. 2(a), which suggests the proximate proportionality of resistivity anisotropy with the detwinning ratio . SFigure 3(a) compares temperature dependence of the detwinning ratio with that of the resistivity anisotropy. The remarkable similarity in these data again confirms the notion that the reduced resistivity anisotropy in stress free sample is due to reduced detwinning ratio.
A.4 Neutron Larmor Diffraction Experiments
Neutron Larmor diffraction is an ideal technique for measuring lattice distortion and expansion, with a resolution better than for . The resolution is not affected by sample mosaicity or slight sample misalignment, enabling us to keep track of small changes in lattice spacing and its distortion . Detailed principles of Larmor diffraction technique can be found in references ldepl ; keller2 ; LDscience .
To determine the lattice orthorhombicity induced Bragg peak splitting in the unstrain sample between and , we assume the full-width-half-maximum (FWHM) of the peaks is unchanged across . The result is described in Fig. 3 of the main text.
As discussed in the main text, for a standard second order magnetic phase transition, one would expect that lattice distortion of the system () remains unchanged across . Since this is clearly not the case for electron underdoped BaFe1.97Ni0.03As2, one can estimate temperature dependence of the lattice correlation length , defined as Fourier transform of the Bragg peak width determined using Larmor diffraction xylu13 . Assuming that the -spacing spread follows a Gaussian distribution, the FWHM of of its Fourier transform gives the lattice correlation length. For typical triple-axis experiment, the instrument resolution is about 300 Å. Here the resolution is much better as shown in temperature dependence of the lattice correlation length in SFig. 3(b). As a function of decreasing temperature, the lattice correlation length reduces from 2500 Å at 150 K to 1000 Å at 110 K before becoming 2500 Å again in the AF ordered state.

References
- (1) Y. C. Chen, X. Y. Lu, M. Wang, H. Q. Luo, and S. L. Li, Supercond. Sci. Technol. 24, 065004 (2011).
- (2) H. C. Montgomery, J. Appl. Phys. 42, 2971 (2003).
- (3) H. -H. Kuo, J. -H. Chu, S. A. Kivelson, and I. R. Fisher, arXiv 1503.00402v1.
- (4) M. T. Rekveldt, T. Keller and R. Golub, Europhys. Lett 54, 342 (2001).
- (5) M. Ono, Y. Waku, K. Habicht, T. Keller, Appl. Phys. A 74[Suppl.], S73-S75 (2002); T. Keller, M. Th. Rekveldt, K. Habicht, , 74[Suppl.], S127-S129 (2002).
- (6) C. Pfleiderer, P. Bni, T. Keller, U. K. Rssler, A. Rosch, Science 316, 1871(2007).
- (7) X. Y. Lu, H. Gretarsson, R. Zhang, X. R. Liu, H. Q. Luo, W. Tian, M. Laver, Z. Yamani, Y.-J. Kim, A. H. Nevidomskyy, Q. Si, and P. C. Dai Phys. Rev. Lett. 110, 257001 (2013).