Near-infrared Extinction due to Cool Supernova Dust in Cassiopeia A
Abstract
We present the results of extinction measurements toward the main ejecta shell of the Cassiopeia A supernova (SN) remnant using the flux ratios between the two near-infrared (NIR) [Fe II] lines at 1.26 and 1.64 µm. We find a clear correlation between the NIR extinction () and the radial velocity of ejecta knots, showing that redshifted knots are systematically more obscured than blueshifted ones. This internal “self-extinction” strongly indicates that a large amount of SN dust resides inside and around the main ejecta shell. At one location in the southern part of the shell, we measure by the SN dust of mag. By analyzing the spectral energy distribution of thermal dust emission at that location, we show that there are warm ( K) and cool ( K) SN dust components and that the latter is responsible for the observed . We investigate the possible grain species and size of each component and find that the warm SN dust needs to be silicate grains such as MgSiO3, Mg2SiO4, and SiO2, whereas the cool dust could be either small () Fe or large () Si grains. We suggest that the warm and cool dust components in Cassiopeia A represent grain species produced in diffuse SN ejecta and in dense ejecta clumps, respectively.
1 Introduction
For the past decade, evidence for copious amounts of dust () in high-redshift galaxies and quasars with has been reported in many far-infrared (FIR) and sub-millimeter/millimeter studies (e.g., Wang et al., 2011; Leipski et al., 2013; Calura et al., 2014, and references therein), implying that dust should be produced within a very short timescale, less than 1 Gyr after the Big Bang. The most promising sites of dust formation in such an early universe are believed to be core-collapse supernovae (CCSNe), since their progenitors have very short lifetimes ( years) compared to asymptotic giant branch stars, which are major sources of dust in the local universe (Morgan & Edmunds, 2003; Marchenko, 2006).
To understand the dust formation process in expanding supernova (SN) ejecta, many theoretical studies have been conducted to date (Nozawa et al., 2003, 2008, 2010; Sarangi & Cherchneff, 2014). According to these theoretical studies, dust can form in an expanding He core with grain species determined by the elemental composition at the formation site. If an SN ejecta maintains its layered structure during expansion, a variety of grain species can form, e.g., carbon grains in the helium layer, silicate and oxide grains in the oxygen-rich layer, and Si/Fe grains in the innermost layer, the amounts of which depend on the progenitor mass. If the SN ejecta is mixed, however, it is mostly silicate and oxide grains that can form. The size of the grains depends on the gas density at the condensation time. In an SN IIP, which has a thick hydrogen envelope, the expansion is slow, so large grains with an average radius of can form (Nozawa et al., 2003). In an SN IIb with a low-mass hydrogen envelope as well as envelope-stripped SNe such as Type Ib/c, on the other hand, the SN ejecta expands rapidly, so only small grains with a size less than 0.01 µm can form (Nozawa et al., 2008, 2010). The size distribution and chemical composition of the dust, however, could be greatly affected by density enhancements due to clumping (Sarangi & Cherchneff, 2014). Theoretical studies predict that one CCSN can produce 0.1– of SN dust (Kozasa et al., 1991; Todini & Ferrara, 2001; Nozawa et al., 2003, 2008, 2010; Bianchi & Schneider, 2007), but the dust masses obtained from observations of nearby CCSNe are much smaller than this, e.g., (Meikle et al., 2007; Kotak et al., 2009; Sakon et al., 2009; Szalai et al., 2011). A significant () amount of dust has been observed in several young CC supernova remnants (SNRs), e.g., Cassiopeia A (Barlow et al., 2010; Sibthorpe et al., 2010; Arendt et al., 2014), Crab (Gomez et al., 2012; Owen & Barlow, 2015), and 1987A (Matsuura et al., 2011; Indebetouw et al., 2014), but the physical and chemical properties of the dust remain to be explored (see below).
Cassiopeia A (Cas A), which is a remnant of an SN IIb explosion (Krause et al., 2008), is an ideal target for examining the properties of SN dust. It is quite young ( years; Fesen et al., 2006), so the SN ejecta and freshly formed SN dust have not been significantly mixed with the circumstellar/interstellar medium (CSM/ISM), and it is relatively close (3.4 kpc; Reed et al., 1995), so the physical and chemical structures can be resolved. Therefore, Cas A has been a major target of infrared space missions. The first direct evidence for SN dust in Cas A came from the Infrared Space Observatory (ISO), which performed mid-infrared (MIR; 2.4–45 µm) spectroscopic observations toward the bright ejecta shell (Lagage et al., 1996; Arendt et al., 1999; Douvion et al., 2001). The continuum spectra had a strong bump peaking at 21 µm together with a relatively weak bump at 9.5 µm, and Douvion et al. (2001) showed that the spectra can be fitted by two dust components at different temperatures, one at 90 K and the other at 350 K, with pyroxene (MgSiO3), quartz (SiO2), and aluminum oxide (Al2O3) as major components. The composition and distribution of this “warm” SN dust heated by a reverse shock have been studied in detail using the spectral mapping data of the Spitzer Space Telescope (Ennis et al., 2006; Rho et al., 2008; Arendt et al., 2014). These studies showed that the dust emission exhibits distinct spectral characteristics depending on the SN material with which it is associated. The most prominent dust emission is that with strong 9 and 21 µm bumps, which is associated with SN ejecta having strong Ar emission lines. The spectral features agree with the ISO spectra and can be reproduced by Mg protosilicate/MgSiO3, Mg0.7SiO2.7, or SiO2. The dust emission associated with SN ejecta having strong Ne lines is smooth without any silicate features and can be reproduced by Al2O3 dust or C glass. There is yet another type of smooth dust emission associated with X-ray Fe emission, but it is probably from swept-up CSM (Arendt et al., 2014). Meanwhile, Nozawa et al. (2010) showed that the observed spectral energy distribution (SED) of dust emission can be fitted by a physical model in which the SNR is expanding into a dense CSM, and the MIR emission is mostly from silicate grains (e.g., MgSiO3, Mg2SiO4, and SiO2) and MgO. The estimated total mass of warm dust ranges from 0.008 to 0.054 .
A larger amount of SN dust, however, appears to reside in the interior of Cas A, where the SN ejecta is freely expanding. The first report was made by Dunne et al. (2003), who claimed the detection of 2–4 of cold (15–20 K) SN dust associated with Cas A from an 850 µm observation. It was found, however, that at least some of the 850 µm emission is from a foreground material (Krause et al., 2004; Dunne et al., 2009), and instead Sibthorpe et al. (2010) and Barlow et al. (2010), using the balloon-borne sub-millimeter telescope BLAST and infrared space telescopes AKARI and Herschel, showed that there is faint FIR and sub-millimeter emission from Cas A that can be fitted by dust at 35 K with a total mass of . Arendt et al. (2014) also identified the FIR emission from this “cool” dust associated with unshocked SN ejecta (their “[Si II]” dust group) using the Herschel FIR data and derived an upper limit of 0.1 for the dust mass. However, the composition of the cool dust has been undetermined so far because the absorption cross sections of dust grains in the FIR are mostly smooth without prominent spectral features.
In this paper, we show that one can explore the characteristics of the cool SN dust in the interior of Cas A using extinction in the near-infrared (NIR). Recently, we performed NIR spectroscopy toward the main ejecta shell of Cas A, where we obtained the spectral and kinematical properties of 63 knots bright in [Fe II] emission lines (Koo et al., 2013). Most of these knots are SN material, and the extinctions toward these knots show clear evidence for the SN dust, which can be combined with thermal infrared dust emission to infer the dust composition. This paper is organized as follows. In Section 2, we outline our NIR spectroscopic observations and data reduction and then briefly describe the public MIR and FIR imaging data that we used in the paper. In Section 3, we derive the NIR extinction toward the knots using [Fe II] line ratios and show that there is a correlation between the extinction and the line-of-sight velocity, which implies extinction by SN dust. Then, in Section 4, by comparing the NIR extinction and the thermal dust infrared SED, we constrain the possible compositions and sizes of the SN dust. We discuss the implication of our result for dust production in Cas A in Section 5 and summarize our paper in Section 6.
2 Observations and Data Reduction
2.1 Near-infrared Spectroscopy
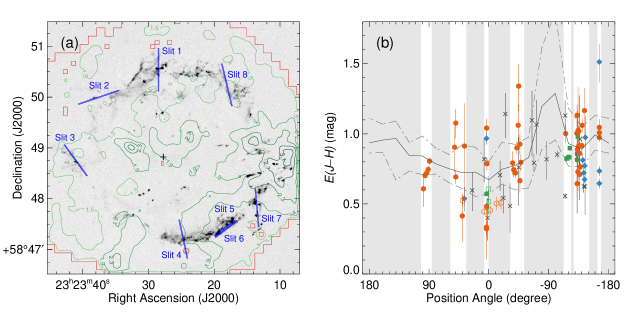
Eight long-slit NIR spectra of the main SN ejecta shell were obtained on 2008 June 29 and August 8 using TripleSpec mounted on the Palomar Hale 5 m telescope; this spectrograph provides a broadband spectrum simultaneously covering 0.94–2.46 µm with a moderate resolving power of . We also observed the spectra of an A0V standard star (HD 223386) for flux calibration just before and after the target observations. To subtract sky OH airglow emission as well as background continuum, the observations were made with either a consecutive ABBA pattern or On-Off mode depending on the complexity of the field. Figure 1(a) shows the position of the slits on the continuum-subtracted [Fe II] 1.64 µm narrow-band image obtained in 2008 August.
We followed a general reduction procedure to make a two-dimensional dispersed image. Numerous sky OH airglow emission lines were used for wavelength calibration, and then we corrected it to the heliocentric reference frame. The absolute photometric calibration was made by comparing the observed spectrum of the standard star with the Kurucz model spectrum (Kurucz, 2003). Even though the absolute flux uncertainty goes up to 30% depending on the centering accuracy of the standard star observation, the relative fluxes are quite robust.
We found a total of 63 infrared knots using a clump-finding algorithm (Williams et al., 1994) and performed a single Gaussian fit for all the detected emission lines to derive their fluxes and line-of-sight velocities. For detailed descriptions of the data reduction and analysis as well as the full list of parameters of the detected emission lines, please refer to Koo et al. (2013) and Y.-H. Lee et al. (2015, in preparation).
2.2 Mid- and Far-infrared Imaging Data
For an SED analysis of SN dust, we fully exploit the previously published archival data providing the highest spatial resolution and sensitivity in the MIR and FIR wavebands covering 10–500 µm, where the dust emission is dominant.
For short wavebands, we use the W3 channel image () of the Wide-field Infrared Survey Explorer (WISE: Wright et al., 2010) with an angular resolution of . We first retrieved all 36 single-exposure images (“Level-1b”) from the online service111http://irsa.ipac.caltech.edu/applications/wise/ and converted the pixel unit to MJy sr-1. After subtracting the predicted brightness of zodiacal light calculated from the interplanetary dust model from each frame (Kelsall et al., 1998), we co-added the individual frames using Montage software222http://montage.ipac.caltech.edu/ to obtain the final image. Instead of the WISE W4 channel image (), we use the 24 µm band image of the Multiband Imaging Photometer for Spitzer (MIPS: Rieke et al., 2004) obtained in 2007 January (AORKEY: 17657088, 17657344)333http://sha.ipac.caltech.edu/applications/Spitzer/SHA/, which provides better spatial resolution () than WISE W4. The data used here are the Post-BCD image (“Level 2”), which is automatically processed by the MIPS software pipeline (version: S18.12.0). As in the WISE data, zodiacal light is one of the significant sources of background radiation in this waveband. We therefore subtracted the background brightness from the mosaic image using the model calculation (Kelsall et al., 1998).
Recent FIR images of the remnant were observed with PACS and SPIRE on board Herschel Space Observatory (Pilbratt et al., 2010) in 2009 September and December. The two instruments have six photometric bands (70, 100, and 160 µm for PACS, and 250, 350, and 500 µm for SPIRE), and they provide spatial resolutions of , , , , , and , respectively. The fully calibrated data sets were downloaded from the Herschel Science Archive444http://www.cosmos.esa.int/web/herschel/science-archive/, and we use the data product levels of 2.5 and 2.0 for PACS and SPIRE, respectively. All imaging data have well-established zero-level brightness, whereas the PACS photometer images at level 2.5 do not (PACS Observer’s Manual - version 2.5.1). To obtain the true zero point of the images, we calibrated the zero level by comparison with reference images whose zero point is well established. For the reference photometric calibrator, we used 60 and 100 µm images from Improved Reprocessing of the IRAS Survey (IRIS: Miville-Deschênes & Lagache, 2005) together with DIRBE 140 and 240 µm and Planck 350 and 550 µm maps. In Cas A, synchrotron radiation is a dominant source in the FIR waveband. This nonthermal component is subtracted by using the VLA radio image at 6 cm (Delaney, 2004). The expected brightness at each isophotal wavelength is extrapolated from the power law (erg cm-2 s-1 Hz-1). In this paper, we adopt and erg cm-2 s-1 Hz-1, which are derived from the total brightness of the remnant at 30, 44, 70, and 100 GHz using Planck (Planck Collaboration et al., 2011) archival data555http://irsa.ipac.caltech.edu/applications/planck/.
3 NIR Extinction by SN Dust
3.1 NIR Extinction Measurement
We derive the selective extinction or “color excess” between 1.26 and 1.64 µm, , toward the infrared knots from
| (1) |
where and are the total extinctions at 1.26 and 1.64 µm, and and are the observed and intrinsic flux ratios of the [Fe II] 1.26 and 1.64 µm lines, respectively. These two strong [Fe II] lines share the same upper state (), so their intrinsic ratio is fixed by their Einstein coefficients and wavelengths, i.e., . The ratio has been derived from both theoretical calculations and observations, and it ranges from 0.94 to 1.49 in previous studies (e.g., Giannini et al., 2015; Koo & Lee, 2015, and references therein). This large uncertainty of the intrinsic flux ratio hampers accurate measurement of the absolute extinction toward the remnant (this issue will be addressed in Section 3.3). It is, however, worth noting that the uncertainty does not affect the difference in (Equation 1) among the knots, which gives the relative extinction to them. In this paper, we adopt the intrinsic line flux ratio of 1.36, which is the theoretical value proposed by Nussbaumer & Storey (1988) and Deb & Hibbert (2010).
3.2 Total Extinction to Cas A
In Figure 1(b), we plot for the 63 infrared knots as a function of position angle. The colors and symbols represent the characteristic groups classified by Koo et al. (2013): helium-rich knots in green squares, sulfur-rich knots in red circles, and iron-rich knots in blue diamonds. In short, helium-rich knots are slowly moving () knots with strong He I lines, the properties of which match those of “quasi-stationary flocculi” (QSFs), the circumstellar material swept up by an SN blast wave (van den Bergh, 1971; Lee et al., 2014). Sulfur-rich and iron-rich knots are fast-moving () knots with strong [S II] and strong [Fe II] lines, respectively. They are SN ejecta material synthesized in different layers of the SN and correspond to fast-moving knots (FMKs) in previous optical studies (e.g., van den Bergh, 1971; Hammell & Fesen, 2008). For more detailed explanations on the spectroscopic and kinematic properties of these knots, please refer to Koo et al. (2013). For comparison, we also plot for the optical and infrared knots measured in previous studies. Hurford & Fesen (1996) observed optical spectra of five FMKs and two QSFs located in the northern bright rim and measured using ratios of the [S II] and the Balmer lines, respectively. We converted it to assuming the general interstellar dust composition with of 3.1 (Draine, 2003), and the open red circles and green squares in the figure represent the FMKs and QSFs, respectively. Eriksen et al. (2009) performed NIR spectroscopy for four slit positions and derived the line ratio of [Fe II] 1.26–1.64 µm for 19 infrared knots without any classification of their origin. We obtained using Equation 1 and marked the results by black X marks.
The derived varies considerably over the remnant. It appears that the extinction toward the west is systematically larger than that toward the east, though there is a large scatter. This systematic variation is well known from previous radio and X-ray observations (e.g., Keohane et al., 1996; Reynoso & Goss, 2002; Hwang & Laming, 2012). For example, the green contours in Figure 1(a) show the column density () map of Hwang & Laming (2012) obtained from an analysis of the Chandra X-ray data. The column density is large ((2–3) ) toward the west and southwest directions, and molecular line studies showed that it is due to molecular clouds located in the Perseus Spiral Arm.
Figure 1(b) shows that the extinction varies considerably within a slit. For example, along Slit 4, varies from 0.6 to 1.5 mag even though the emission is from a thin filament. This variation is significantly larger than what we would expect from the variation in the foreground extinction. For example, the solid line in the figure represents an expected variation along the ejecta shell derived from the map in Figure 1(a). The ejecta shell is determined in the continuum-subtracted [Fe II] image where the brightness is greater than 3 of the background rms noise, and the mean is obtained at every in position angle. The column density is converted to using (Bohlin et al., 1978) and . The dashed-dotted lines represent the maximum and minimum at each position angle. It is obvious that, in several slits, the variation of within a slit is much larger than the range allowed from the map. As we show in the next section, this large variation is due to extinction within the SN ejecta.
3.3 Self-extinction within Cas A
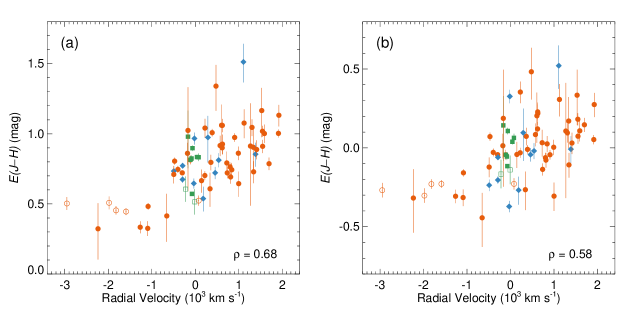
An interesting correlation is found when we plot as a function of radial velocity, which is shown in Figure 2(a). It is clear that the redshifted knots are generally more obscured than the blueshifted knots. Because we are observing an expanding shell, this suggests that the knots on the far side experience more extinction than those on the front side, or that there could be extinction originating within the remnant. To confirm this “self-extinction,” it is necessary to remove the spatially varying foreground interstellar extinction. We subtract the extinction derived from the X-ray observation (Figure 1), and the result is shown in Figure 2(b). The correlation becomes slightly weaker, but it is still obvious that the redshifted knots are more heavily obscured than the blueshifted knots. Therefore, our result implies that there is extinction, which might be due to newly formed SN dust within the remnant. The large scatter in extinction for the same velocity knots might reflect differences among different sight lines, i.e., non-uniform distribution of SN dust.
Note in Figure 2(b) that the minimum , which means that the derived from the map is higher than the derived from [Fe II] line ratios. We can think of two possibilities for the negative . First, it could be due to the uncertainty of the theoretical [Fe II] line ratio. To compensate for the of mag, however, the theoretical flux ratio of [Fe II] 1.26–1.64 µm should be more than 1.8, which is considerably higher than the numerical value obtained in previous studies (). Second, the derived from X-ray data could be overestimated. Indeed, the mean column density from the X-ray studies is (Willingale et al., 2002; Hwang & Laming, 2012), which is higher than those of radio observations, e.g., (Troland et al., 1985; Keohane et al., 1996). We also note that the column densities of Hwang & Laming (2012) are higher by (0.4–0.7) cm-2 than those of Lee et al. (2014), who carefully analyzed the X-ray spectra around the outer SNR shock. The difference of 0.3 mag in , which corresponds to , may therefore have resulted from the difficulty in background removal in the analysis of Hwang & Laming (2012). Another complication is that the X-ray-absorbing column also includes self-extinction, so the X-ray-based extinction overestimates the foreground extinction. Thus it appears difficult to obtain an accurate map of the foreground extinction from the X-ray data alone, but this uncertainty is not likely to erase the systematic correlation in Figure 2(b).
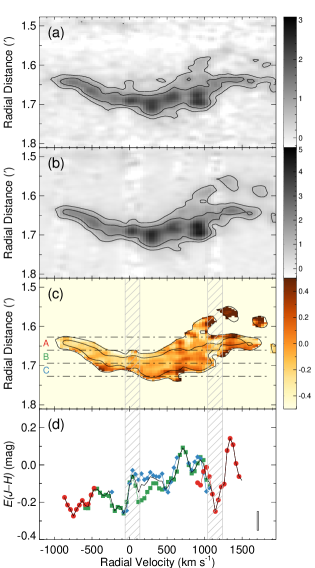
The non-uniform spatial distribution of SN dust and the uncertainty in the foreground extinction hamper the analysis of the correlation in Figure 2(b). However, in one slit (Slit 4), we detected convincing evidence for self-extinction without those sight-line-dependent complications. Figures 3(a) and (b) show that the velocity structure of the [Fe II]-line-emitting gas in Slit 4 is “arc”-like, suggesting that the slit crosses a portion of an expanding shell. This is consistent with the result of previous studies that the main ejecta shell is a thin shell expanding at 4000–5000 (e.g., DeLaney et al., 2010; Isensee et al., 2012). In Slit 4, therefore, we have both blue and redshifted Fe knots along a given sight line, and the uncertainty due to different sight lines disappears. Now Figure 3(c) shows the map obtained for pixels with an [Fe II] 1.64 µm brightness greater than 3 above the background noise. A systematic increase in the extinction toward the redshifted knots is apparent. We computed an intensity-weighted as a function of radial velocity, which is shown by the black solid line in Figure 3(d). We also divided the iron filament into three subregions along the slit (A–C in Figure 3(c)), and their mean values are over-plotted on the figure with red, green, and blue solid lines. The total within the ejecta shell from Figure 3(d) is mag with a systematic gradient of mag per 1000 km s-1. This should be mostly, if not entirely, due to SN dust because the blue and redshifted ejecta materials in the slit are essentially along the same sight line. There are small-scale variations in in Figure 3(d). They could be due to either incomplete subtraction of OH airglow emissions (e.g., gray-hatched areas in the figure) or very small dust clumps within the slit, or both.
The obtained can be converted to the dust column density () with an appropriate (cm2 g-1), where and are the mass absorption coefficients at 1.26 and 1.64 µm, respectively:
| (2) |
This equation yields the column density of a given dust species required to explain the observed NIR self-extinction. For example, if it is Fe dust, which has cm2 g-1 (Semenov et al., 2003, see Figure 7), the required dust column is g cm-2.
4 FIR Emission and SN Dust Composition
4.1 FIR Emission from SN Dust
What dust species would produce the of 0.2 mag detected in Slit 4? In this section, we constrain the dust species by investigating the FIR emission properties of SN dust.
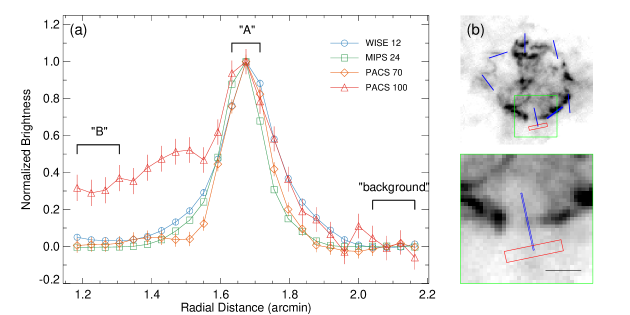
Figure 4(a) shows the one-dimensional (1D) brightness profiles at 12, 24, 70, and 100 µm along the slit length in Slit 4. Note that these data have similar angular resolutions of – (Section 2.2). The profiles are background-subtracted using the mean brightnesses of an area just outside the ejecta shell (red square in Figure 4(b)) and are normalized by their peak brightnesses. All four profiles have maxima at where the iron filament is located (Figure 3). All emission drops to zero inside of the ejecta shell except for the 100 µm emission, which remains constant at % of its peak brightness. This excess emission at 100 µm must be mostly from the unshocked cool SN dust detected previously in the FIR (Barlow et al., 2010; Arendt et al., 2014).
We examine the SEDs at two positions (see Figure 4(a)): (1) the peak brightness position at with aperture (hereafter position A) and (2) the inner 100 µm excess region between and (hereafter position B). For comparison, we also derive an interstellar dust SED just outside of the shell (red square in Figure 4(b)) where the radiation from the remnant is almost negligible. To derive accurate parameters for the SN dust, we first have to subtract the contributions of line emissions from the measured brightnesses. For this purpose, we retrieved the archival MIR and FIR spectra from Spitzer IRS666http://sha.ipac.caltech.edu/applications/Spitzer/SHA/ and ISO LWS777http://iso.esac.esa.int/ida/ observations, respectively. We produced an IRS spectral data cube using CUBISM (Smith et al., 2007) and extracted 1D spectra within a aperture at positions A and B as well as the background position. The strong emission lines falling in the WISE W3 and MIPS 24 µm bands are the [Ar II] 8.99 µm, [S IV] 10.5 µm, [Ne II] 12.8 µm, [Ne III] 15.6 µm, and [O IV]+[Fe II] 25.9 µm lines, and their contributions to the fluxes in the two bands have been estimated as 8.9% and 4.8% for position A, 4.6% and 16% for position B, and 2.0% and 1.8% for the background position, respectively. There are no corresponding FIR spectroscopic data, but an ISO LWS 1D spectrum (43–190 µm) from an area close () to Slit 4 is available (#3 spectrum of Docenko & Sunyaev (2010)). According to this ISO spectrum, the strong emission lines falling in the PACS 70 and 100 µm bands are the [O I] 63.2 and [O III] 88.4 µm lines, respectively. Estimation of the contribution of these lines to the observed surface brightnesses at our positions is tricky because the ISO LWS beam is large, i.e., (Lloyd, 2003), and covers both the Cas A ejecta shell and the background area. We estimated the line contribution by assuming that both emission lines come from the ejecta shell, not from the interstellar material. This assumption is plausible because the two lines are detected at several positions along the ejecta shell to show similar broad profiles, whereas there is little emission outside of the remnant (Docenko & Sunyaev, 2010). Under this assumption, the two lines contribute only to the brightness of A, which is estimated as 3.8% and 4.5% in the PACS 70 and 100 µm bands, respectively. In the PACS 160 µm band, there is the [O I] 146 µm line, but its contribution is almost negligible. The observed and line-subtracted dust continuum brightnesses at the three positions are listed in Table 1.
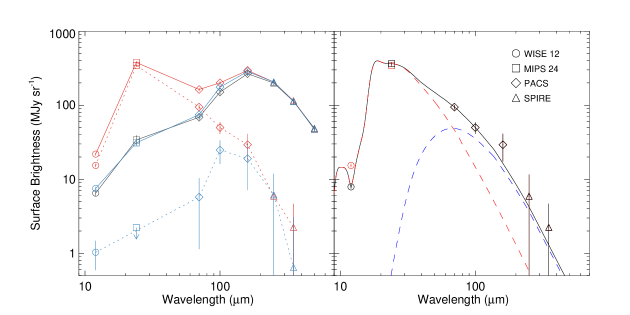
Figure 5 shows the line-emission-subtracted SEDs at positions A and B in red and blue solid lines, respectively. Both SEDs have broad thermal emission bumps peaking at 160 µm, which arise from the line-of-sight interstellar dust component at a temperature of K. This FIR SED matches well the SED of the background area outside the shell (black solid line), which represents the interstellar dust SED. The background-subtracted SEDs, which presumably represent “pure” SN dust SEDs, are shown in red and blue dotted lines in Figure 5. The SED at A now shows maximum brightness at 24 µm, and the brightness decreases toward longer wavelengths. On the other hand, that at B peaks at 100 µm, which implies that the dust temperature is much lower than that at A. These two SEDs should represent the SEDs of shocked (+unshocked) and unshocked dust species, respectively. We will analyze the SED at position A, where we obtained self-extinction of .
Before doing a detailed analysis in the next section, we first show that the shocked warm dust component emitting the MIR emission cannot explain the NIR color excess that we detected. Previous observations showed that the warm dust is silicate grains (e.g., Arendt et al., 2014), and we assume that it is MgSiO3 grains with a size of 0.001–0.1 µm, which has cm2 g-1 (Dorschner et al., 1995). (As we will show in the next section, assuming other silicate dust species will yield the same conclusion.) The SED at A has excess emission in the FIR, and we perform a two-temperature modified blackbody fit assuming that the cool dust has the optical properties of general interstellar dust (Draine, 2003), as in Sibthorpe et al. (2010). The surface brightness of each component at temperature is calculated from
| (3) |
where is the mass absorption coefficient, and is the Planck function. We used MPFIT (Markwardt, 2009), which is a nonlinear least-squares fitting routine within IDL, to derive the values of and at which is minimum as well as their formal 1 uncertainties. The SED is well fitted with warm dust at K plus cool dust at K (Figure 5). From this two-component fitting, we found that almost all of the brightnesses at 12 and 24 µm arise from the warm dust component, whereas more than 80% of the brightness in the FIR longer than 100 µm is from the cool dust component. The warm and cool dust components yield g cm-2 and g cm-2, respectively. From Equation 2, therefore, the corresponding of the warm dust with a size of 0.001–0.1 µm is mag, and that of the cool dust is mag. The column density of warm dust required to explain the MIR emission is very small, and the resulting NIR extinction is several orders of magnitude smaller than the value we derived ( mag). Therefore, it must be the cool dust component that is responsible for the NIR extinction. (Note that the grain species of the warm dust component and therefore its contribution to the NIR extinction are rather well constrained.) However, the above result suggests that the cool dust component cannot have the optical properties of the general interstellar dust because then the NIR extinction is again two orders of magnitude less than the value we derived. The grain species of the cool dust should have large and/or small FIR opacity () compared to that of general interstellar dust.
4.2 SN Dust Composition
4.2.1 Dust Species and Their Optical Properties
For the composition of SN dust, we consider the grain species predicted by previous theoretical models for CCSNe (Todini & Ferrara, 2001; Nozawa et al., 2003, 2008, 2010). The grain species considered in this paper are summarized in Table 2 with references for their optical constants ( and ). Note that carbon grains are formed in the He layer, silicates (MgSiO3, Mg2SiO4, and SiO2) and oxides (Al2O3 and MgO) in the O-rich layer, and other heavy-element (Si, Fe, FeS) grains in the Si–S–Fe layer. In addition, various types of oxide grains (SiO2, MgSiO3, Mg2SiO4, Al2O3, and Fe3O4) are produced in the mixed SN models. According to Rho et al. (2008), the MIR spectra of Cas A are well fitted by the combination of these grain opacity curves, which implies that these are the major dust species produced by the SN explosion. We calculated the absorption and extinction coefficients ( and ) using the Mie theory (Bohren & Huffman, 1983) assuming a spherical grain with a radius of 0.001, 0.01, or 0.1 µm.
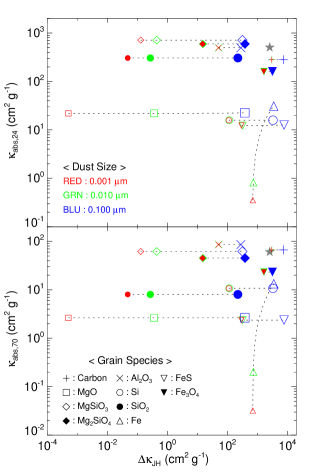
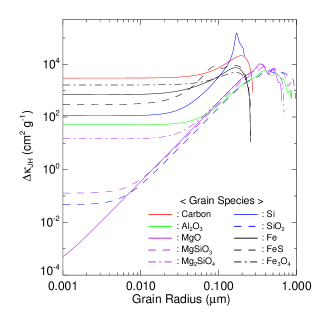
Figure 6 shows and at 24 and 70 µm for the grain species with different sizes. As expected, the values of dust species at 24 and 70 µm do not depend on the grain size except for Fe dust. For Fe dust, which is a metallic dust, not only the electric dipole but also the magnetic dipole is important for grains larger than 0.006 µm, the efficiency () of which is proportional to the volume and not the size (Tanabe et al., 1984). Therefore, the FIR opacity (, where is the absorption efficiency) of Fe dust is proportional to the square of the size for large grains. Note that small Fe dust () has an FIR dust opacity much smaller than those of the other dust grains, e.g., cm2 g-1 versus 2–100 cm2 g-1 at 70 µm. in general does not depend on the grain size for and increases with for larger grains up to (Figure 7). This is the result of standard grain extinction properties: for small grains, i.e., , () is dominated by , which is proportional to , so () is independent of the grain radius (except for Fe dust, which has ). For larger grains up to , the scattering with is more important, so increases. Because, in general, increases to a value of near , where is the complex refractive index, and then converges to 2 (Draine, 2011), reaches a maximum near and then rapidly drops to zero. For grains of , – cm2 g-1. Fe grains have cm2 g-1 almost independent of their sizes. As discussed in the previous section, the dust grains responsible for the NIR extinction should have large and/or small FIR compared to the general interstellar dust composition. In this sense, small Fe (or other metallic) dust grains seem to be a candidate for the cool dust.
4.2.2 Spectral Modeling
We now perform spectral fitting to the SN dust SED at position A. We assume that the SN dust is composed of two temperature components, i.e., warm and cool dust, as noted in Section 4.1. A single component cannot explain both the MIR peak and the FIR excess. We found that essentially all of the MIR emission is from the warm dust. Therefore, we simply assume that the 12 and 24 µm brightnesses are from the warm dust, which then yields the temperature and surface density of warm dust without fitting the entire SED. Color correction was made using the filter response curve at each band and the spectral shape of each grain model.
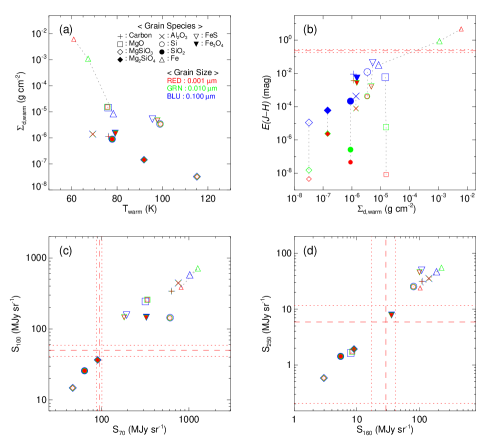
Figure 8(a) shows the derived temperature and surface density of warm dust for different species. Because the FIR values of dust grains, except for Fe dust, do not depend on their sizes (Figure 6), the derived temperature and column density of dust species are independent of the grain size. Not all of these dust species can match the FIR part of the SED. This is shown in Figures 8(c) and (d), where we compare the expected FIR brightnesses to the observed brightnesses (the red dashed and dotted lines). Note that it is acceptable if the expected brightness is less than the observed brightness because the difference can be contributed by cool dust, but not vice versa. Therefore, only three dust species can match the FIR part of the SED: MgSiO3, Mg2SiO4, and SiO2. The temperature and column density of the three grain models are 80 K 120 K and g cm g cm-2, respectively. The compositions and corresponding temperatures of this warm dust component are well consistent with previous observational and theoretical results (Rho et al., 2008; Nozawa et al., 2010). Figure 8(b) shows the expected of warm dust estimated from their surface density using Equation 2. Note that the values of the three dust species are less than mag, which is a few orders of magnitude smaller than the observed , as we already pointed out in Section 4.1.
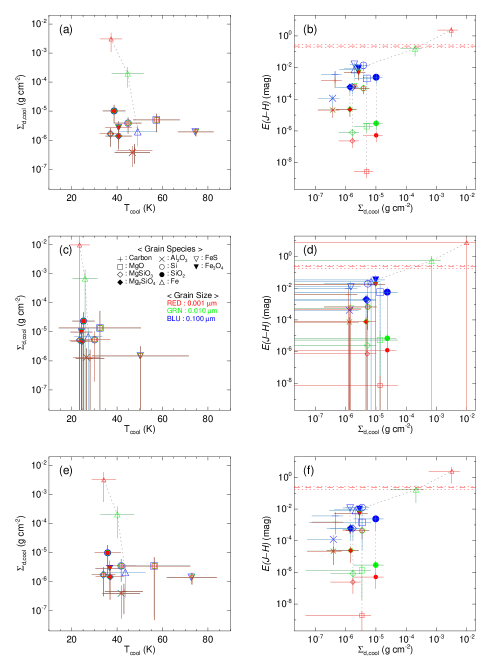
With the warm dust component constrained, we can now search for possible candidates for the cool dust component. We perform a two-temperature modified blackbody fit of the SED for each of the three possible warm dust species above, the temperature and surface density of which are fixed. The left column of Figure 9 shows the derived temperature and surface density of the cool dust for each warm dust species. All combinations can fit the observed SED within the 1 uncertainty of the measured brightness except when the cool dust is MgO grains. The opacity of MgO has a small bump peaking at 100 µm, so it cannot properly fit the observed brightness at either 100 or 160 µm. The temperature of the cool dust ranges from 30 to 70 K depending on its composition. When the warm dust is Mg2SiO4, the cool dust temperature is systematically lower. The right column of Figure 9 shows the expected color excess of each cool dust species. We see that small () Fe grains can match the observed mag for any warm dust species with g cm-2. None the other grain species can produce sufficient extinction.
Figure 9, however, shows that as the grain size increases, increases because larger grains have higher (Figure 6), so perhaps grains larger than 0.1 µm might also produce mag. Figure 7 shows for each grain species as a function of grain radius. For oxide grains (i.e., MgO, MgSiO3, Mg2SiO4, Al2O3, and SiO2), reaches a maximum at and then drops abruptly at , whereas for metallic grains (i.e., Si, Fe, FeS, and Fe3O4) and amorphous carbon, the transition occurs at somewhat shorter wavelengths. We find that pure Si grains with a radius of 0.16–0.21 µm can also explain the color excess we observed because of their large (Figure 7), although the permitted size range appears to be too narrow. Table 3 summarizes the parameters of the warm and cold dust grains that can explain both the FIR SED and the NIR extinction.
5 Discussion
5.1 Cool SN Dust Responsible for the NIR Extinction
According to our result, the cool dust that can explain the observed NIR extinction in the southern part of Cas A (i.e., in Slit 4) could be either small () Fe or large ( ) Si grains. In this section, we discuss these two possibilities.
In the Slit 4 position, the reverse shock is now encountering pure Fe ejecta in the innermost region (Koo et al., 2013). Considering this, cool SN dust mainly consisting of Fe grains seems to be reasonable. The small size also appears to be consistent with the theoretical prediction that the average radius of newly formed SN dust grains in SN IIb is smaller than 0.01 µm because of low gas density in the expanding SN ejecta (Kozasa et al., 2009; Nozawa et al., 2010). On the other hand, theory also predicts that the gas density of the innermost ejecta is too low to produce pure Fe grains when the temperature of the region drops to 800 K, at which Fe grains can start to coagulate, so pure Fe dust is not expected to form in SNe IIb (Kozasa et al., 2009; Nozawa et al., 2010). However, the above conclusion assumes a spherically symmetric explosion with homogeneous and stratified ejecta. If the gas density is inhomogeneous and/or the SN explosion is asymmetric, we cannot rule out the possibility of pure Fe grain formation in the innermost SN ejecta, where the gas density is relatively high (Sarangi & Cherchneff, 2014). Indeed, the ejecta material emitting [Fe II] lines is dense, with electron densities of cm-3 (Koo et al., 2013).
Another possible grain species responsible for the large mag is large Si grains. This possibility may be supported by previous infrared studies; Spitzer spectral mapping observations found strong [Si II] emission together with [O IV] and [S III] lines in the interior of the remnant, which arises from the unshocked SN ejecta photoionized by UV and X-ray emission from the Bright Rim (e.g., Smith et al., 2009; Isensee et al., 2010; Arendt et al., 2014; Milisavljevic & Fesen, 2015). The presence of ionized silicon in the interior supports the suggestion that the cool dust could be Si and/or silicate grains. Theoretically, pure Si grains can form in the Si-rich layer, but the grain size is very small, i.e., (Nozawa et al., 2010). However, again if the SN ejecta is clumped, grains larger than 0.1 µm can form in dense clumps (Sarangi & Cherchneff, 2014), so large Si grains are not implausible.
5.2 Composition of SN Dust in Cas A
From previous studies, it is reasonably well established that there are two SN dust components in Cas A: warm ( K) dust swept up by the reverse shock and cool (30–40 K), unshocked dust residing in the interior of the remnant. The composition of the warm dust is relatively well specified from its MIR spectral features: Mg-silicates, SiO2, Al2O3, and/or C glass. The estimated total mass of warm dust ranges from 0.008 to 0.054 . The composition of the cool dust has been essentially unknown because in the FIR, the SED is mostly smooth without prominent spectral features. Assuming the FIR absorption coefficients of the general interstellar dust (Sibthorpe et al., 2010) or silicates (Barlow et al., 2010), a total mass of has been obtained.
Our analysis also showed that there are warm and cool dust components in the southern ejecta shell. The derived temperature (80–120 K) and composition (MgSiO3, Mg2SiO4, or SiO2) of the warm dust are consistent with previous results. For the cool dust, we were able to show for the first time that its composition is either small Fe or large Si grains. Their temperatures are 30–50 K. These grains are not expected in uniformly expanding stratified SN ejecta, but they can possibly form in dense clumps.
At first glance, the different compositions of warm and cool dust appear to be incompatible if we consider that the cool dust is swept up by the reverse shock and subsequently turns into warm dust with a temperature of K. However, this can be understood if we consider that the SN ejecta is clumped. As we pointed out above, the cool dust responsible for the NIR extinction resides in dense clumps. When the dense clumps are swept up by the reverse shock, the shock speed is slow (e.g., ), and the gas temperature is below K (Koo et al., 2013), so the dust grains in the clumps are not heated to high temperature. On the other hand, when the diffuse ejecta is swept up by the reverse shock, the gas is heated to X-ray-emitting temperature ( K), and the dust grains there are heated by collisions with electrons to high temperature. Therefore, it is the shock-heated warm grains in the diffuse ejecta that emit most of the MIR and FIR () emission (Figure 5), and their compositions could be different from those of grains in dense clumps. In summary, our observation can be explained if the SN ejecta is clumped and the grain species in diffuse material and dense clumps are different, i.e., silicate grains in the diffuse material and small Fe or large Si grains in the dense clumps. The cool dust that we detected could reside either in unshocked or shocked clumps, and it is these cool grains that are responsible for the NIR extinction.
When the cool dust is pure Fe grains, we can make a crude estimation of the dust formation efficiency from our observation. The required Fe dust mass density of (2–5) g cm-2 corresponds to an Fe nucleus column density of (2–5) cm-2. For comparison, the characteristic size of [Fe II]-line-emitting clumps is or 0.08 pc at 3.4 kpc, and their average electron density is cm-3 (Koo et al., 2013). For pure Fe ejecta clumps, because Fe is mostly in Fe+, it means that the number density of Fe atoms is cm-3, and the characteristic Fe column density in the gas phase of Fe ejecta clumps is cm-2. Therefore, if there are such clumps along the sight line where in Slit 4, we obtain a dust-to-gas ratio of .
The total flux of cool dust at 100 µm in the global SED is Jy (Barlow et al., 2010). The mass has been estimated to be if we adopt the FIR absorption coefficients for silicates from Dorschner et al. (1995). The contribution of small Fe or large Si grains to this mass budget would depend on the volume filling factor of the clumps but is probably not large. To address this issue, one may carry out an analysis similar to that in this paper toward the entire ejecta shell.
6 Summary
We performed NIR spectroscopic observations of Cas A in which we obtained the spectral and kinematical properties of 63 [Fe II]-line-emitting knots spread over the main ejecta shell. All of the knots show strong [Fe II] 1.26 and 1.64 µm lines, the ratio of which provides a direct measure of the extinction. From an analysis of the extinction toward individual knots, we showed that the NIR extinction is due in part to SN dust within the remnant. We explored the nature of the SN dust responsible for the NIR extinction by analyzing its thermal infrared emission. Our main results are summarized below.
1. We found that [Fe II] emission from redshifted SN ejecta is in general more heavily obscured than that from blueshifted SN ejecta (Figure 2). We interpret the correlation as evidence for newly formed SN dust within the remnant. The amount of excess extinction varies considerably from one sight line to another, which suggests a highly non-uniform distribution of SN dust.
2. One slit (Slit 4) is located across the southern [Fe II] ejecta filament, which has the velocity structure of an expanding shell. Along this particular sight line, we measured an excess NIR extinction of mag between the front and back sides of the shell, which must be entirely due to SN dust (Figure 3).
3. We analyzed the SED of thermal dust emission toward Slit 4 to show that there are warm ( K) and cool ( K) SN dust components along the sight line (Figure 5). Among the grain species predicted from theoretical dust formation models in CCSNe, only silicate grains (i.e., MgSiO3, Mg2SiO4, SiO2) can match the SED of warm SN dust which has a sharp 24 µm peak. The NIR extinction due to these warm silicate dust grains is negligible, so the observed excess NIR extinction should be due to the cool SN dust.
4. According to our analysis, only two grain species can explain both the SEDs of cool dust and the NIR excess extinction: (1) small () Fe grains or (2) large () Si grains. However, neither would be consistent with the dust formation theory for SN IIb with uniformly expanding, layered ejecta (e.g., Nozawa et al., 2010), which predicts the formation of only small () Si grains and no Fe grains. However, if the SN ejecta is clumpy, we might expect that Fe grains and large Si grains can be produced in dense clumps.
5. We suggest that the unshocked SN ejecta is clumpy and the grain species in diffuse material and dense clumps are different, i.e., silicate grains in diffuse material and small Fe or large Si grains in dense clumps. In the shocked ejecta, both still exist, but it is the shock-heated warm grains in the diffuse ejecta that emit most of the MIR and FIR () emission. The cool dust that we detected could reside in either unshocked or shocked clumps, and it is these cool grains that are responsible for the NIR extinction. The contribution of each grain species to the total mass () of cool SN dust in Cas A remains to be explored.
References
- Arendt et al. (2014) Arendt, R. G., Dwek, E., Kober, G., Rho, J., & Hwang, U. 2014, ApJ, 786, 55
- Arendt et al. (1999) Arendt, R. G., Dwek, E., & Moseley, S. H. 1999, ApJ, 521, 234
- Barlow et al. (2010) Barlow, M. J., Krause, O., Swinyard, B. M., et al. 2010, A&A, 518, L138
- Begemann et al. (1997) Begemann, B., Dorschner, J., Henning, T., et al. 1997, ApJ, 476, 199
- Bianchi & Schneider (2007) Bianchi, S., & Schneider, R. 2007, MNRAS, 378, 973
- Bohlin et al. (1978) Bohlin, R. C., Savage, B. D., & Drake, J. F. 1978, ApJ, 224, 132
- Bohren & Huffman (1983) Bohren, C. F., & Huffman, D. R. 1983, Absorption and Scattering of Light by Small Particles (New York: Wiley)
- Calura et al. (2014) Calura, F., Gilli, R., Vignali, C., et al. 2014, MNRAS, 438, 2765
- Deb & Hibbert (2010) Deb, N. C., & Hibbert, A. 2010, ApJ, 711, L104
- Delaney (2004) Delaney, T. A. 2004, Ph.D. Thesis, Univ. Minnesota
- DeLaney et al. (2010) DeLaney, T., Rudnick, L., Stage, M. D., et al. 2010, ApJ, 725, 2038
- Docenko & Sunyaev (2010) Docenko, D., & Sunyaev, R. A. 2010, A&A, 509, AA59
- Dorschner et al. (1995) Dorschner, J., Begemann, B., Henning, T., Jaeger, C., & Mutschke, H. 1995, A&A, 300, 503
- Douvion et al. (2001) Douvion, T., Lagage, P. O., & Pantin, E. 2001, A&A, 369, 589
- Draine (2003) Draine, B. T. 2003, ApJ, 598, 1017
- Draine (2011) Draine, B. T. 2011, Physics of the Interstellar and Intergalactic Medium (Princeton: Princeton University Press), ISBN: 978-0-691-12214-4
- Dunne et al. (2003) Dunne, L., Eales, S., Ivison, R., Morgan, H., & Edmunds, M. 2003, Nature, 424, 285
- Dunne et al. (2009) Dunne, L., Maddox, S. J., Ivison, R. J., et al. 2009, MNRAS, 394, 1307
- Ennis et al. (2006) Ennis, J. A., Rudnick, L., Reach, W. T., et al. 2006, ApJ, 652, 376
- Eriksen et al. (2009) Eriksen, K. A., Arnett, D., McCarthy, D. W., & Young, P. 2009, ApJ, 697, 29
- Fesen et al. (2006) Fesen, R. A., Hammell, M. C., Morse, J., et al. 2006, ApJ, 645, 283
- Giannini et al. (2015) Giannini, T., Antoniucci, S., Nisini, B., et al. 2015, ApJ, 798, 33
- Gomez et al. (2012) Gomez, H. L., Krause, O., Barlow, M. J., et al. 2012, ApJ, 760, 96
- Hammell & Fesen (2008) Hammell, M. C., & Fesen, R. A. 2008, ApJS, 179, 195
- Hurford & Fesen (1996) Hurford, A. P., & Fesen, R. A. 1996, ApJ, 469, 246
- Hwang & Laming (2012) Hwang, U., & Laming, J. M. 2012, ApJ, 746, 130
- Indebetouw et al. (2014) Indebetouw, R., Matsuura, M., Dwek, E., et al. 2014, ApJ, 782, LL2
- Isensee et al. (2012) Isensee, K., Olmschenk, G., Rudnick, L., et al. 2012, ApJ, 757, 126
- Isensee et al. (2010) Isensee, K., Rudnick, L., DeLaney, T., et al. 2010, ApJ, 725, 2059
- Kelsall et al. (1998) Kelsall, T., Weiland, J. L., Franz, B. A., et al. 1998, ApJ, 508, 44
- Keohane et al. (1996) Keohane, J. W., Rudnick, L., & Anderson, M. C. 1996, ApJ, 466, 309
- Koike et al. (1995) Koike, C., Kaito, C., Yamamoto, T., et al. 1995, Icarus, 114, 203
- Koo et al. (2013) Koo, B.-C., Lee, Y.-H., Moon, D.-S., Yoon, S.-C., & Raymond, J. C. 2013, Science, 342, 1346
- Koo & Lee (2015) Koo, B.-C., & Lee, Y.-H. 2015, arXiv:1502.00048
- Kotak et al. (2009) Kotak, R., Meikle, W. P. S., Farrah, D., et al. 2009, ApJ, 704, 306
- Kozasa et al. (2009) Kozasa, T., Nozawa, T., Tominaga, N., et al. 2009, in ASP Conf. Ser. 414, Cosmic Dust—Near and Far, ed. T. Henning, E. Grün, & J. Steinacker (San Francisco, CA: ASP), 43
- Kozasa et al. (1991) Kozasa, T., Hasegawa, H., & Nomoto, K. 1991, A&A, 249, 474
- Krause et al. (2004) Krause, O., Birkmann, S. M., Rieke, G. H., et al. 2004, Nature, 432, 596
- Krause et al. (2008) Krause, O., Birkmann, S. M., Usuda, T., et al. 2008, Science, 320, 1195
- Kurucz (2003) Kurucz, R. L. 2003, http://kurucz.harvard.edu/
- Lagage et al. (1996) Lagage, P. O., Claret, A., Ballet, J., et al. 1996, A&A, 315, L273
- Lee et al. (2014) Lee, J.-J., Park, S., Hughes, J. P., & Slane, P. O. 2014, ApJ, 789, 7
- Leipski et al. (2013) Leipski, C., Meisenheimer, K., Walter, F., et al. 2013, ApJ, 772, 103
- Lloyd (2003) Lloyd, C. 2003, in ESA SP-481, in The Calibration Legacy of the ISO Mission, ed. L. Metcalfe, A. Salama, S. B. Peschke, & M. F. Kessler (Noordwijk: European Space Agency), 399
- Marchenko (2006) Marchenko, S. V. 2006, in ASP Conf. Ser. 353, Stellar Evolution at Low Metallicity: Mass Loss, Explosions, Cosmology, ed. H. J. G. L. M. Lamers, N. Langer, T. Nugis, & K. Annuk (San Francisco, CA: ASP), 299
- Markwardt (2009) Markwardt, C. B. 2009, in ASP Conf. Ser. 411, Astronomical Data Analysis Software and Systems XVIII, ed. D. A. Bohlender, D. Durand, & P. Dowler (San Francisco, CA: ASP), 251
- Matsuura et al. (2011) Matsuura, M., Dwek, E., Meixner, M., et al. 2011, Science, 333, 1258
- Meikle et al. (2007) Meikle, W. P. S., Mattila, S., Pastorello, A., et al. 2007, ApJ, 665, 608
- Milisavljevic & Fesen (2015) Milisavljevic, D., & Fesen, R. A. 2015, Science, 347, 526
- Miville-Deschênes & Lagache (2005) Miville-Deschênes, M.-A., & Lagache, G. 2005, ApJS, 157, 302
- Morgan & Edmunds (2003) Morgan, H. L., & Edmunds, M. G. 2003, MNRAS, 343, 427
- Nozawa et al. (2008) Nozawa, T., Kozasa, T., Tominaga, N., et al. 2008, ApJ, 684, 1343
- Nozawa et al. (2010) Nozawa, T., Kozasa, T., Tominaga, N., et al. 2010, ApJ, 713, 356
- Nozawa et al. (2003) Nozawa, T., Kozasa, T., Umeda, H., Maeda, K., & Nomoto, K. 2003, ApJ, 598, 785
- Nussbaumer & Storey (1988) Nussbaumer, H., & Storey, P. J. 1988, A&A, 193, 327
- Owen & Barlow (2015) Owen, P. J., & Barlow, M. J. 2015, ApJ, 801, 141
- Philipp (1985) Philipp, H. R. 1985, in Handbook of Optical Constants of Solids, ed. E. D. Palik (San Diego, CA: Academic), 719
- Pilbratt et al. (2010) Pilbratt, G. L., Riedinger, J. R., Passvogel, T., et al. 2010, A&A, 518, L1
- Piller (1985) Piller, H. 1985, in Handbook of Optical Constants of Solids, ed. E. D. Palik (San Diego, CA: Academic), 571
- Planck Collaboration et al. (2011) Planck Collaboration, Ade, P. A. R., Aghanim, N., et al. 2011, A&A, 536, AA1
- Reed et al. (1995) Reed, J. E., Hester, J. J., Fabian, A. C., & Winkler, P. F. 1995, ApJ, 440, 706
- Reynoso & Goss (2002) Reynoso, E. M., & Goss, W. M. 2002, ApJ, 575, 871
- Rho et al. (2008) Rho, J., Kozasa, T., Reach, W. T., et al. 2008, ApJ, 673, 271
- Rieke et al. (2004) Rieke, G. H., Young, E. T., Engelbracht, C. W., et al. 2004, ApJS, 154, 25
- Roessler & Huffman (1991) Roessler, D. M., & Huffman, D. R. 1991, in Handbook of Optical Constants of Solids II, ed. E. D. Palik (San Diego, CA: Academic), 919
- Sakon et al. (2009) Sakon, I., Onaka, T., Wada, T., et al. 2009, ApJ, 692, 546
- Sarangi & Cherchneff (2014) Sarangi, A., & Cherchneff, I. 2014, arXiv:1412.5522
- Semenov et al. (2003) Semenov, D., Henning, T., Helling, C., Ilgner, M., & Sedlmayr, E. 2003, A&A, 410, 611
- Sibthorpe et al. (2010) Sibthorpe, B., Ade, P. A. R., Bock, J. J., et al. 2010, ApJ, 719, 1553
- Smith et al. (2007) Smith, J. D. T., Armus, L., Dale, D. A., et al. 2007, PASP, 119, 1133
- Smith et al. (2009) Smith, J. D. T., Rudnick, L., Delaney, T., et al. 2009, ApJ, 693, 713
- Szalai et al. (2011) Szalai, T., Vinkó, J., Balog, Z., et al. 2011, A&A, 527, AA61
- Tanabe et al. (1984) Tanabe, T., Onaka, T., & Kamijo, F. 1984, Ap&SS, 98, 323
- Thorstensen et al. (2001) Thorstensen, J. R., Fesen, R. A., & van den Bergh, S. 2001, AJ, 122, 297
- Todini & Ferrara (2001) Todini, P., & Ferrara, A. 2001, MNRAS, 325, 726
- Troland et al. (1985) Troland, T. H., Crutcher, R. M., & Heiles, C. 1985, ApJ, 298, 808
- van den Bergh (1971) van den Bergh, S. 1971, ApJ, 165, 457
- Wang et al. (2011) Wang, R., Wagg, J., Carilli, C. L., et al. 2011, AJ, 142, 101
- Williams et al. (1994) Williams, J. P., de Geus, E. J., & Blitz, L. 1994, ApJ, 428, 693
- Willingale et al. (2002) Willingale, R., Bleeker, J. A. M., van der Heyden, K. J., Kaastra, J. S., & Vink, J. 2002, A&A, 381, 1039
- Wright et al. (2010) Wright, E. L., Eisenhardt, P. R. M., Mainzer, A. K., et al. 2010, AJ, 140, 1868
- Zubko et al. (1996) Zubko, V. G., Mennella, V., Colangeli, L., & Bussoletti, E. 1996, MNRAS, 282, 1321
| Waveband | ObservedaaThe observed brightnesses include contribution from emission lines. | Dust-continuum | ||||
|---|---|---|---|---|---|---|
| A | B | Background | A | B | Background | |
| WISE 12 | 24.01.1 | 7.90.4 | 6.60.5 | 21.91.0 | 7.50.3 | 6.50.5 |
| MIPS 24 | 39716 | 37.11.5 | 34.65.3 | 37815 | 31.01.2 | 33.95.3 |
| PACS 70 | 1708 | 74.53.7 | 68.85.7 | 1638 | 74.53.7 | 68.85.7 |
| PACS 100 | 21011 | 1759 | 15111 | 20110 | 1759 | 15111 |
| PACS 160 | 29615 | 28514 | 26618 | 29615 | 28514 | 26618 |
| SPIRE 250 | 20514 | 20614 | 20015 | 20514 | 20614 | 20015 |
| SPIRE 350 | 1158 | 1138 | 1138 | 1158 | 1138 | 1138 |
| SPIRE 500 | 48.03.4 | 47.03.3 | 48.53.4 | 48.03.4 | 47.03.3 | 48.53.4 |
Note. — Brightnesses in units of MJy sr-1. The uncertainties are derived from a quadrature sum of the photometric uncertainty and the brightness variation within the aperture.
| Species | Conditionaau = unmixed SN explosion model, m = mixed SN explosion model | Type | Density | Coverage | References |
|---|---|---|---|---|---|
| (g cm-3) | (µm) | ||||
| C | u | Amorphous | 2.28 | 4E-2 2E3 | 1 |
| MgO | u | Crystalline | 3.59 | 2E-3 625 | 2 |
| MgSiO3 | m/u | Glassy | 3.20 | 2E-1 500 | 3 |
| Mg2SiO4 | m/u | … | 3.23 | 1E-1 1E5 | 4 |
| Al2O3 | m/u | Amorphous | 4.01 | 2E-1 500 | 5 |
| Si | u | Amorphous | 2.34 | 1E-2 148bb The maximum of coverage is limited to 148 µm. In this case, we assume that the optical properties, and , do not vary at longer wavelengths. | 6 |
| SiO2 | m/u | Amorphous | 2.66 | 1E-4 500 | 7 |
| Fe | u | … | 7.95 | 1E-1 1E5 | 4 |
| FeS | u | … | 4.87 | 1E-1 1E5 | 4 |
| Fe3O4 | m | … | 5.25 | 1E-1 1E3 | 8 |
References. — (1) Zubko et al. (1996), (2) Roessler & Huffman (1991), (3) Dorschner et al. (1995), (4) Semenov et al. (2003), (5) Koike et al. (1995) for and Begemann et al. (1997) for , (6) Piller (1985), (7) Philipp (1985), (8) A. Triaud and H. Mutschke (unpublished; see http://www.astro.uni-jena.de/Laboratory/OCDB/mgfeoxides.html).
| Warm Dust | Cool Dust | ||||||
|---|---|---|---|---|---|---|---|
| Species | Species | ||||||
| (K) | (10-6 g cm-2) | (10-4 mag) | (K) | (10-4 g cm-2) | (mag) | ||
| Si | |||||||
| MgSiO3 | () | ||||||
| () | Fe | ||||||
| () | |||||||
| Si | |||||||
| Mg2SiO4 | () | ||||||
| () | Fe | ||||||
| () | |||||||
| Si | |||||||
| SiO2 | () | ||||||
| () | Fe | ||||||
| () | |||||||