Six General Ecosystem Properties are more Intense in Biogeochemical Cycling Networks than Food Webs
Abstract
Network analysis has revealed several whole-network properties hypothesized to be general characteristics of ecosystems. These include pathway proliferation, and network non-locality, homogenization, amplification, mutualism, and synergism. Collectively these properties characterize the impact of indirect interactions among ecosystem elements. While ecosystem networks generally trace a thermodynamically conserved unit through the system, there appear to be several model classes. For example, trophic (TRO) networks are built around a food web, usually follow energy or carbon, and are the most abundant models in the literature. Biogeochemical cycling (BGC) networks trace nutrients like nitrogen or phosphorus and tend to have more aggregated nodes, less dissipation, and more recycling than TRO. We tested (1) the hypothesized generality of the properties in BGC networks and (2) that they tend to be more strongly expressed in BGC networks than in the TRO networks due to increased recycling. We compared the properties in 22 biogeochemical and 57 trophic ecosystem networks from the literature using enaR. We also evaluated the robustness of these results with an uncertainty analysis. The results generally support the hypotheses. First, five of the properties occurred in varying degrees in all 22 BGC models, while network mutualism occurred in 86% of the models. Further, these results were generally robust to a 50% uncertainty in the model parameters. Second, the average network statistics for the six properties were statistically significantly greater in the BGC models than the TRO models. These results (1) confirm the general presence of these properties in ecosystem networks, (2) highlight the significance of different model types in determining property intensities, (3) reinforce the importance of recycling, and (4) provide a set of indicator benchmarks for future systems comparisons. Further, this work highlights how indirect effects distributed by network connectivity can transform whole-ecosystem functioning, and adds to the growing domain of network ecology. Keywords: network environ analysis; ecological network analysis; indirect effects; input–output analysis; systems ecology; network science
1 Introduction
Complex systems are comprised of reticulated exchanges of energy, matter, and information that let members influence each other directly and indirectly. These connections can define member characteristics [71, 26, 68, 97] and create whole-system properties such as stability [73, 94] and tolerance to failure [1, 29]. The degree of connectivity is important, but patterns of connectivity are critical for these effects [6, 29, 31, 90]. Network models are ideal for mapping these exchanges, and network analyses characterize the subsequent relationships and quantify the connectivity patterns [72, 21, 7].
Ecosystems can be modeled as a network in which nodes represent species, functional groups of species, or non-living components, and directed edges trace the direct transactions of energy or matter among the nodes (Fig. 1). Thus, this network model is like a road map for the physical exchange of resources. Ecologists then analyze the network model to understand the consequences of whole-ecosystem organization and the often hidden relationships among species and the external environment [97, 49, 39, 10, 7, 47, 85]. For example, Grami et al. [45] found that in a food web model of Lake Pavin the fungal parasites of phytoplankton (chytrids) generally reduced the carbon lost from the pelagic zone. This effect was due in part because the chytrids increased the average path length that the carbon molecules traveled in the system, which they further hypothesized created greater system stability. Small et al. [91] used ecosystem networks to compare nitrogen cycling in the Laurentian Great Lakes, and discovered that Lake Superior had a higher denitrification efficiency than Lake Huran or Lake Erie despite its having a low areal denitrification rate. This ecosystem network analysis (ENA) builds our understanding of the importance of connectivity patterns in ecosystems, contributes to the rise of network ecology [15, 8], and more broadly contributes to the emerging domain of network science and its approach to studying complex systems in general [72, 70, 7, 22].
While ecosystem networks are formed by tracing a thermodynamically conservative unit through the system [42], there appear to be several classes of ecosystem network models with distinctive features [24, 1, 19]. Trophic networks (TRO) are the most common class of ecosystem networks. They are built around a food web, and typically trace either energy or carbon. The South Carolina oyster reef model [9] and Chesapeake Bay ecosystem models [7] are typical examples of this class. A second class of ecosystem network model focuses on biogeochemical cycling (BGC), and typically traces a key nutrient like nitrogen or phosphorus. Christian et al. [24] suggested that by comparison to the trophic models, biogeochemical cycling models tend to have more aggregated nodes, less dissipation and more recycling. Models of nitrogen cycling in the Laurentian Great Lakes [91], Neuse River Estuary [4], and the Cape Fear River Estuary [6, 7] are examples of this class. In this work, we investigate the generality of selected ecosystem network properties in the two most abundant classes (TRO and BGC).
1.1 Six Hypothesized Characteristics of Ecosystem Networks
Through the development and application of ENA, several hypotheses regarding the organization of whole ecosystems have emerged [25, 41, 55, 54]. Here, we focus on six of these hypotheses: pathway proliferation, network non-locality, network homogenization, network amplification, network mutualism, and network synergism.
Pathway proliferation occurs when the number of pathways in an ecosystem tends to rapidly increase as path length increases [76, 17, 12]. In this literature a pathway is defined as a sequence of nodes and edges (e.g., Detritus Detritivore Consumer in Fig. 1a), and the length of the pathway is the number of edges , where in the example. This is sometimes called a walk in graph theory as both nodes and edges can be repeated [20]. These longer pathways create a reticulated web of possible routes of influence. Pathway proliferation is illustrated in Fig. 1c.
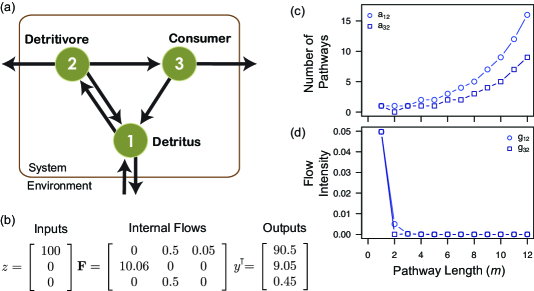
Network non-locality is the tendency for indirect flows (flows over pathways where ) to cumulatively exceed direct flows in ecosystems [75, 49, 86]. This occurs despite the diminishing flow intensity as path length increases (Fig. 1d) due to the thermodynamically open nature of ecosystems. The implications of this property are that organisms not only have the ability to influence each other indirectly, but that these indirect relations may be both quantitatively and qualitatively dominant. Further research has shown that these indirect interactions have the power to transform the nature of the relationships among species. For example, Bondavalli and Ulanowicz [10] found that due to indirect interactions across the trophic network in the Everglades the American alligator was more beneficial to some of its prey like frogs than they were detrimental. This complicates environmental management and restoration [74, 10].
Network homogenization is the tendency of the indirect flows to more evenly distribute resources in the system. Patten et al. [77] observed that when they applied ENA flow analysis, the integral (boundary + direct + indirect) flow intensities were more evenly distributed than the direct flow intensities alone. They inferred that the indirect flow intensities must be spreading the resource exchange.
Network amplification is defined as “the increase of energy–matter ultimately utilized at destination compartments compared to the quantities originally introduced at source compartments” [50]. Though it may at first seem counter intuitive, this property is made possible by energy and matter recycling [81, 50]. It implies that some exchanges are quite important for the system function.
Network mutualism and Network synergism both reflect the tendency for indirect interactions to make the relationships among the network nodes more positive than they appear from the direct interactions [82, 39, 35], as with the previously mentioned case of the frog and alligator. Network mutualism examines the number of positive and negative interactions, while network synergism compares the magnitudes of the positive and negative interactions.
1.2 Existing Evidence
These hypothesized general ecosystem properties were first identified in relatively small, well-connected, trophic-based ecosystem models (e.g., oyster reef model [9]), but subsequent research has shown that four of the six properties appear to be general in trophic models. For example, pathway proliferation is known to occur in all well connected models [12]. Higashi and Patten [48, 49] showed algebraically why network non-locality is likely to occur in ecosystem networks. Fath and Patten [40] introduced a statistic to quantify network homogenization and showed that the property occurred in two ecosystem models and a set of arbitrary networks. Subsequently, Fath [34] and Fath and Killian [38] found evidence to support the network non-locality and homogenization hypotheses in large-scale hypothetical model ecosystems built from an ecosystem assembly algorithm; however, they found that network amplification occurred only rarely. Salas and Borrett [86] found that the network non-locality hypothesis held in 74% of 50 empirically-based trophic ecosystem networks, and Borrett and Salas [18] showed that network homogenization occurred in 100% of the same 50 models. Fath and Patten [39] provided an algebraic proof for why network synergism should always occur in ecosystem models. Thus, the existing evidence supports the claim that pathway proliferation, network non-locality, network homogenization, and synergism are general properties of trophic-based ecosystem models, while network amplification is an occasional property or possibly a modeling artifact. Network mutualism has rarely been investigated.
The majority of evidence for these ecosystem properties is based on trophic ecosystem models. We posit that each ecosystem model class may have different characteristic network properties or intensities of the properties. That said, the ENA framework predicts that all six described ecosystem properties are general across the model classes because these models still represent an ecosystem at their core.
1.3 Objectives
We investigated whether these six ENA properties generally occur in biogeochemical cycling ecosystem networks. We specifically tested two hypotheses. First, we hypothesized that the pathway proliferation, non-locality, homogenization, amplification, mutualism, and synergism properties tend to occur in the BGC models because the properties are purportedly general to ecosystems. Second, we hypothesized that these six properties would tend to have a greater intensity in BGC models than in TRO models because (1) BGC models tend to have higher rates of recycling, and (2) all of the properties tend to increase with recycling [77, 34, 86]. If these hypotheses hold, then this work extends the generality of the hypothesized ecosystem properties across both the trophic and biogeochemical cycling model classes, and provides evidence that differences between model classes can be functionally significant.
2 Materials and Methods
2.1 Ecosystem Network Selection
Our approach to testing the generality of the ecosystem properties was to apply ENA to a set of ecosystem network models and compare the results. As such, this study has characteristics of a systematic review and meta-analysis, and we can characterize our model selection for the study with an adaptation of the PRISMA (Preferred Reporting Items for Systematic reviews and Meta-Analyses) guidelines [67]. Figure 2 provides an overview of this decision process.
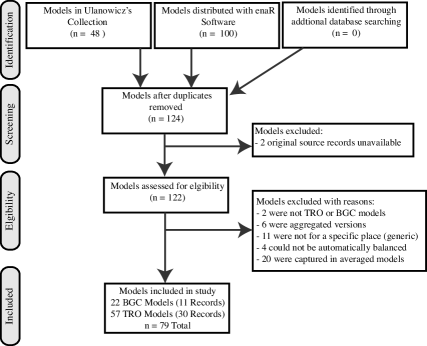
To identify ecosystem networks for this study, we started with two existing collections. The first set of 48 models was compiled by Dr. Robert Ulanowicz http://www.cbl.umces.edu/~ulan/ntwk/network.html over the course of his career developing and promoting ENA. The second is a collection of 100 ecosystem models extracted from the literature and distributed with the enaR R package for ENA [14]. These were collected from colleagues and periodic literature searches (2000 – 2014). Together, this identified 124 unique ecosystem networks. In an initial screening step we excluded two of these networks because the original model sources were unavailable for review.
We then assessed the eligibility of the remaining 122 ecosystem networks for our study. To be included, the models must have met five inclusion criteria. First, the models needed to fit the characteristics of a trophic or biogeochemical cycling network. We excluded two models based on this criteria – one was modeled a network of water flow in a watershed, and another was for the Polish economy. Second, we included only the highest resolution (least aggregated) networks for a particular system. This criteria is necessary because some systems have been modeled multiple times with differing network order (number of nodes used to partition the system). Third, to be included in our study, the model had to be empirically-based in the sense that the investigators were attempting to model a specific ecosystem and a portion of the model was parameterized with empirical measurements from that system. Fourth, for analytical reasons (see next section) the models included had to be at steady-state (inputs equal outputs). Thus, we excluded models that were not initially at steady-state that could not be automatically balanced using enaR. Fifth, there were several cases where there were multiple models of the same system for different times or conditions. If an averaged model was also initially identified for the site, we included only the averaged model to limit the bias of any particular system. In some cases a similar conceptual model was parameterized for different elements (e.g., C, N, P, Mg). We included this variety because we expected this to provide alternative views of the same system.
Through this process we selected 79 ecosystem network models from 41 records. This includes 22 biogeochemical cycling ecosystem networks (Table S1) and 57 trophic networks (Table S2). Eight distinct systems are modeled in the set of biogeochemical network class and there are 40 separate systems in the trophic network class. This set of trophic models overlaps (49 of 50) with those analyzed for network non-locality and network homogenization [18, 86].
2.2 Ecological Network Analysis
While the specifics of the ENA algorithms have been presented in the literature [25, 41, 61, 89] and made available in software packages [37, 58, 14], the techniques are not well known. Further, in some cases we modified the traditional ENA network statistics to facilitate their consideration across networks with different numbers of nodes. Thus, this section describes the analyses used in detail.
2.2.1 Ecosystem Network Models
Like network models of any complex system, ecosystem networks represent the system with a set of nodes and edges (Fig. 1). Nodes represent biological species, groups of species, or non-living components. For example, a living node could represent detritivores, which is a functional grouping of species based on their eating habits, and non-living nodes might be particulate organic matter (POM) or inorganic nitrogen in the form of ammonium (NH4+). Edges are directed and weighted. They indicate the flow of energy or matter from one node to another over some time period, . These networks allow only one edge from any node to any other node, and self-loops may occur (e.g., cannibalism in a food web). These models typically focus on tracing a single thermodynamically conservative tracer. Thus, an edge may capture the effect of many physical, chemical, and biological processes including feeding, excretion, death, and chemical conversions.
Ecosystems are thermodynamically open systems. This implies that the systems have inputs and outputs from their environment, which are modeled as a second class of directed edges. Input edges, do not have a specified starting node and output edges have no terminal node. Alternatively we could assign a node to represent the environment, but this is uncommon in the ENA literature.
2.2.2 Structural Analysis
Structural analysis in ENA focuses on properties of the network topology. This topology is specified by the existence of connections among the nodes; node and edge weights are ignored. The analysis also typically focuses on the within system connections, so the boundary inputs and outputs are also ignored. Thus, the analysis primarily operates on the binary adjacency matrix, , induced from . If there is a flow from to , ; otherwise, .
A number of network statistics are used to characterize the digraph structure. The most common are the total number of nodes (graph order), the number of edges or links , and connectance (network density). These statistics are a necessary starting point, but they do not describe the pattern of connections among the nodes.
Structural analysis is also concerned with features of the network connectivity, which are characterized with graph theory and matrix algebra [9, 21]. A strongly connected network is one in which every node is reachable by a pathway of some length from every other node. Some networks can be decomposed into one or more strongly connected components (SCC). These SCCs are the largest subset of nodes that are still reachable from each other [9]. Most food webs and ecosystem networks are composed of one or sometimes two SCCs with more than one node, which we call large SCCs [12, 19]. Often these networks also have a set of additional nodes that are weakly connected to the others; they are only reachable if we ignore the edge directions. For example, a plant node in a trophic network tracing carbon typically has an edge showing consumption by one or more herbivores; however, there is typically no input of carbon to the plants from within the system since they take it up from the atmosphere. We can quantify these aspects of network connectedness by counting the number of large () SCCs in the network and the percent of network nodes that participate in the SCCs.
Pathway proliferation appears when we count the number of pathways or walks between any two nodes as we increment the pathway length (Fig. 1c) [80, 76]. Raising the adjacency matrix to the power returns a matrix whose elements provide the walk count from to . In strongly connected networks, as .
The rate of pathway proliferation varies among ecological networks [17, 12]. This variation is due to the size of the network, its direct connectance, and the topological arrangement of the direct edges [17]. The asymptotic rate of pathway proliferation in an SCC is equivalent to the dominant eigenvalue of the adjacency matrix associated with the SCC, [12]. If a network contains only one SCC, then the pathway proliferation rate for the network and the SCC are identical. may also serve as a measure of the topological cyclicity in the network [32, 36]. As scales between 0 and , we used a re-scaled pathway proliferation rate to compare the pathway proliferation rates among networks of different sizes. Notice that .
2.2.3 Flow Analysis
Flow analysis characterizes the geometry of the ecological networks, taking into consideration the flow weights [46, 98]. Further, it requires the boundary flux information. Given its origination in economic Input-Output Analysis, flow analysis can have either an input or output orientation; we focus on the output orientation for this paper. The input analysis typically generates qualitatively similar results [13].
The ENA flow analyses we applied have four key steps. The first step is to calculate the node throughflows, which are a sum of the total amount of energy or matter flowing into or out of each node. This can be calculated as
| (1) | ||||
| (2) |
The flow analysis applied here assumes the network model is at steady-state, which implies that = .
The second step in flow analysis is to calculate the direct flow intensities among nodes (). For the output orientation, these values are defined as
| (3) |
Elements of indicate the flow intensity from to over pathways of length .
The third step in our analysis is to find the integral flow intensity matrix . This matrix satisfies the following equation.
| (4) |
The elements are effectively the sum of the flow intensities from to across pathways of all lengths (). Thus, we can re-represent as the sum of the following series:
| (5) | ||||
| (6) |
The elements of indicate the flow intensity from to over all pathways of length . Notice that when equation 6 is substituted back into equation 4, the elements of map the boundary inputs into , are the direct flows, and where are the indirect flows. Given that ecosystems are thermodynamically open and the specification of our model, this infinite series is convergent. Therefore, we can find using the identity , where is the identity matrix.
From this primary flow analysis, we derive several whole-network statistics relevant to this paper. The first two are based on the throughflow vector. Total system throughflow (TST) is the sum of the node throughflows () and is an indicator of the size or activity of the system [83, 43]. Average path length () indicates the average amount of activity generated by a unit of input into the system [43]. This is similar in concept to the multiplier effect in economics [88] and has been termed network aggradation in ecology [56]. The third indicator we used is the Finn Cycling Index (FCI), which indicates the fraction of throughflow derived from recycling as opposed to acyclic flows [43, 44].
The remaining flow-based network statistics quantify three of the remaining ENA properties of interest (Table 1). Network non-locality is characterized by the ratio of indirect-to-direct flows in the network (); when , indirect effects are said to dominate direct effects and network non-locality is present. Network homogenization is a ratio of the coefficient of variation in the direct flow intensity matrix to the coefficient of variation in the integral flow matrix (). When the flows are more evenly distributed (lower variance) in the integral than in the flow matrix, which implies that the indirect flows are more evenly distributing the system activity across the network and network homogenization is present. Network amplification occurs when an off-diagonal element in the integral flow matrix exceeds 1, which indicates that the flow is amplified from the initial boundary input. The strength of amplification () is quantified by counting the number of non-diagonal elements are greater than one. To allow comparison across network models of different sizes, we divide this count by the total number of possible off diagonal elements.
| ENA Property | Symbol | Statistic |
|---|---|---|
| Pathway Proliferation | PPR | |
| Network Non-locality | I/D | |
| Network Homogenization | ||
| Network Amplification | ||
| Network Mutualism | ||
| Network Synergism |
2.2.4 Utility Analysis
The network mutualism and network synergism properties appear from the application of ENA utility analysis. This technique determines the net relationships among nodes in the network that are derived from the direct transactions [82, 39, 35]. Here, we use the flow based utility analysis [37, 14]. The first step in this analysis is to calculate the direct utility matrix as
| (7) |
such that . Further, shows the direct utility intensity from to over pathways of length . As in flow analysis, the integral utility intensity matrix is then computed as
| (8) | ||||
| (9) |
The elements of indicate the integral utility intensity from to . When the dominant eigenvalue of is less than one, this power series converges such that . When the convergence criteria fails, the identity relationship should not be mathematically appropriate. Despite this mathematical problem, use of the identity has been common in the literature and it appears to return ecologically meaningful results. Why this appears to work despite the mathematical issue is an open problem in ENA. As such, in this paper we complete the utility analysis even when the convergence criteria fails, but identify the results as mathematically suspect.
The next step in utility analysis is to re-scale and dimensionalize both the direct and integral utility matrix by multiplying them by the node throughflows,
| (10) | ||||
| (11) |
where is a matrix with the node throughflows on the principle diagonal and zeros elsewhere. Thus, is the dimensionalized [M L-2 T-1] direct utility receives from , and is the dimensionalized integral utility.
The tests for network mutualism and network synergism involve the ratios of positive and negative utilities in , which have been termed the benefit–cost ratios (Table 1). In both cases, the property is said to occur if the ratios are greater than 1, indicating that the positive utilities exceed the negative utilities.
2.3 Data Analysis
Our primary data analysis for this paper had three main components. First we used the enaR package to apply ENA to the selected BGC models to test the hypothesized generality of the properties in the biogeochemical cycling ecosystem networks. We evaluated the presence of each ecosystem property as expressed in the network statistics described (Table 1). Second, we used a two-sample Wilcoxan signed rank test to compare the intensity of each ecosystem property between the BGC and TRO sets of models (significance criterion ). Third, to test the effect of model size and recycling on the ENA properties, we applied the non-parametric Spearman Rank correlation.
2.4 Uncertainty Analysis
To evaluate the effect of flux uncertainty on the ENA results, we applied an inverse linear modeling technique [99, 60]. We used the limSolve R package [92] to generate an ensemble of 10,000 plausible models for each network by simultaneously but independently perturbing the model fluxes by a random amount up to drawn from a uniform distribution. These perturbed models were constrained to meet the steady-state assumption of ENA. We then applied ENA to the ensemble of models and calculated the 95% confidence interval for each network statistic.
3 Results
The results of this study generally support the hypotheses. We report the results in four stages. We first present the results of the ENA network statistics in the biogeochemical cycling models, and then we show the values for the trophic based models. The third subsection compares the distribution of these properties between the two model classes. In part four, we confirm the importance of cycling intensity for these six ecosystem properties.
3.1 ENA properties in Biogeochemical Cycling Ecosystem Networks
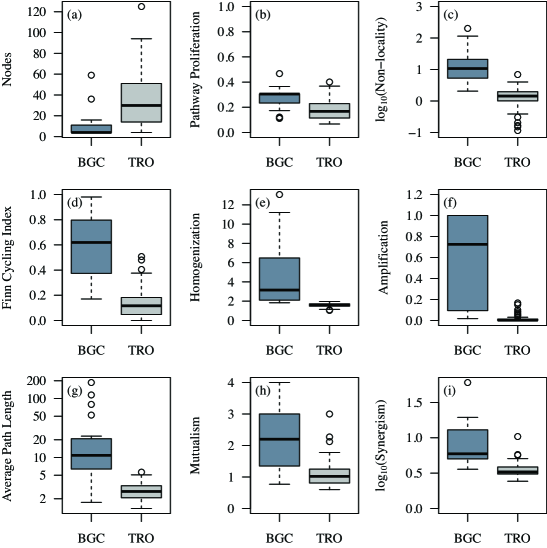
Pathway proliferation, non-locality, homogenization, amplification, and synergism occurred to varying degrees in all 22 BGC models analyzed (Fig. 3). Network mutualisms occurred 86% of the models. Thus, the results support the first hypothesis that these are general properties of ecosystems.
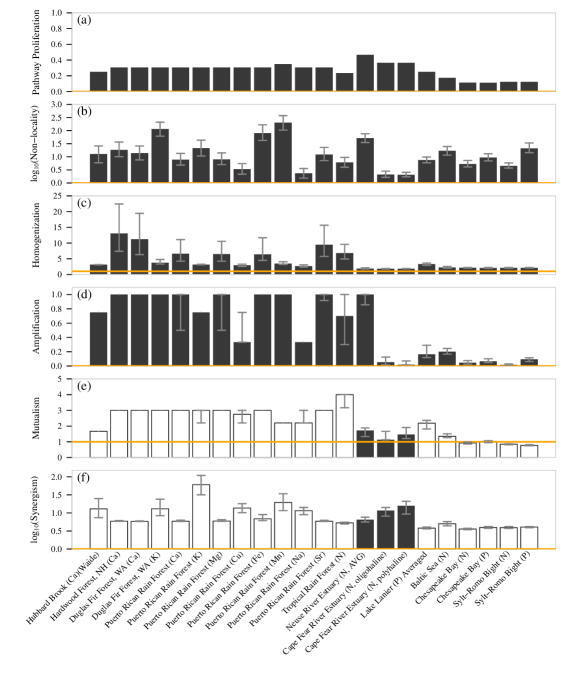
The relative rate of pathway proliferation ranged from 0.11 to 0.47 (Fig. 3a). This proliferation rate reflects the results for the whole network because the models each contain a single large () strongly connected component. Furthermore, all of the nodes participate in the model’s large SCC except in the Hubbard Brook Ca model in which only 3/4 do. As this is purely a topological property, the flux uncertainty analysis did not affect these results.
In all of the BGC, models (). This indicates the dominance of indirect flows and the presence of network non-locality. The median realized was 12.2 in the BGC models, but it ranged between 2.07 in the polyhaline model of N cycling in the Cape Fear River Estuary to 201.1 in the Mn cycling model in the Puerto Rican rain forest model. The 95% CI intervals from the uncertainty analysis (error bars) indicate a range of uncertainties for the specific values for each network, but none of these intervals cross the interpretation threshold of .
Likewise, the homogenization statistic exceeded one in all BGC models (). This indicates that the integral flow intensity matrices were less variable than the direct flow intensity matrices. When the pathways of increasing length were considered, the particular nutrient being traced through the network was more evenly distributed between the nodes. ranged from 1.84 to 13. Again, the 95% CI do not cross the interpretation threshold of .
Network amplification occurred () in all 23 BGC models; the median value faction of possible off-diagonal positions with elements greater than 1 was 0.75. The lowest level of amplification was 2% in the polyhaline Cape Fear Estuary model of the N cycle and amplification peaked at 100% in nine of the networks. The 95% CIs reinforced this result.
The network mutualism statistic ranged from 0.77 to 4 in the BGC models, where 86% of them had a value larger than one. Only the Chesapeake Bay N model and the Sylt-Rømø Bight N and P models failed to exhibit the network mutualism property. Notice, however, that the 95% uncertainty interval for the Chesapeake Bay N model includes one. As expected all of the models exhibited network synergism. The synergism statistic ranged from 0.55 to 1.78 on a log scale. However, the Utility matrix failed the convergence criterion () in all but three models, making these results mathematically suspect (Fig. 3).
3.2 ENA Properties in Trophic Ecosystem Networks
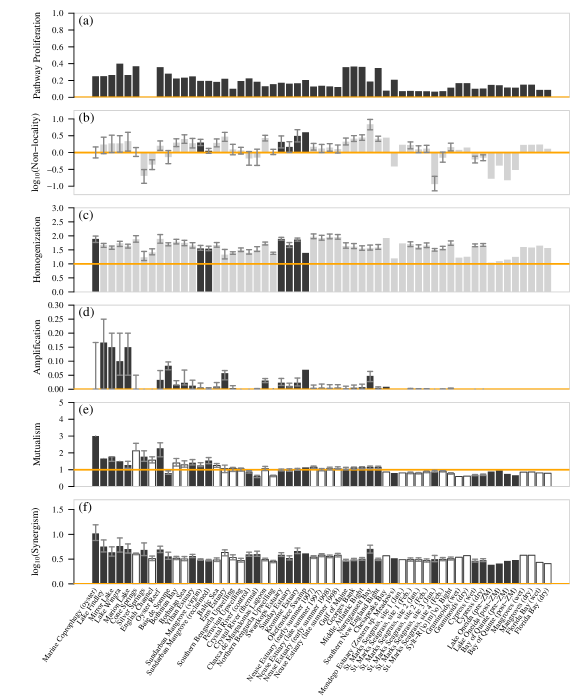
There is also general support for five of the six ENA hypotheses in the 57 TRO models (Fig. 4), though these results are tempered by the uncertainty analysis. Note that the uncertainty analysis technique failed to build an ensemble of perturbed models for 14 of the TRO models due to “incompatible constraints” that made the solutions impossible to identify [99], including the eight largest models.
Pathway proliferation occurred in all but two models: the Silver Springs and the English Channel. The maximum relative pathway proliferation rate was 0.4. Non-locality occurred in 75.4% of the initial models, including all 4 of the models not previously considered. However, with the 50% flux uncertainty the 95% CI of the non-locality statistics for 14 of the models crossed the existence threshold, which leaves us uncertain of their status. Network homogenization occurred in all 57 TRO models with values ranging from 1.04 to 1.96. Network amplification was found in 75% of the trophic models, with values ranging from 0.01% to 17%. Network synergism occurred in all 57 models with transformed parameter values ranging from 0.38 to 1.02. The 95% CI for network homogenization, amplification, and synergism all exceeded the exceeded the property existence thresholds.
The evidence for the generality of network mutualism was not strong; the network statistic ranged from 0.60 to 3 in the TRO models. The network mutualism parameter only exceeded one, indicating the ENA property presence, in 28 of the 57 models (49%). Further, the uncertainty analysis showed that the evidence was inconclusive for 7 of these 28 models. Also notice that 47.4% of the TRO models failed to meet the convergence criterion for the utility power series, which makes these results mathematically suspect.
The results for non-locality and homogenization are not surprising given the known results on 49 of these models [18, 86]. However, these two properties were found in all seven of the unique models in this set.
3.3 BGC versus TRO network models
When we compared the distributions of the ENA statistics between the two classes of ecosystem models (BGC vs TRO), we found a significant difference for each metric (Fig. 5). As expected from our class definitions, these distributions indicate that the BGC models in our data set tended to have fewer nodes, connectance, and a higher degree of recycling. They also tended to have a higher average path length. Further, as we hypothesized the relative pathway proliferation rate, network non-locality, network homogenization, network amplification, network mutualism, and network synergism tended to be greater in the BGC models. A non-parametric Wilcoxan rank sum test showed a statistically significant difference between BGC and TRO models for the ten metrics compared (Table 2). The p-values are all below the critical value of 0.05, which indicates that there is sufficient evidence to reject the statistical null hypotheses of no difference.
| Network Statistic | W | p-value | Significance |
|---|---|---|---|
| 240 | 1.28e-05 | * | |
| 912 | 3.92e-03 | * | |
| 1,218 | 6.05e-10 | * | |
| 1,118 | 3.22e-07 | * | |
| 985 | 2.35e-04 | * | |
| 1,243 | 1.06e-10 | * | |
| 1,260 | 3.09e-11 | * | |
| 1,234 | 1.72e-10 | * | |
| 1,041 | 5.86e-06 | * | |
| 1,163 | 4.72e-06 | * |
3.4 Importance of Cycling
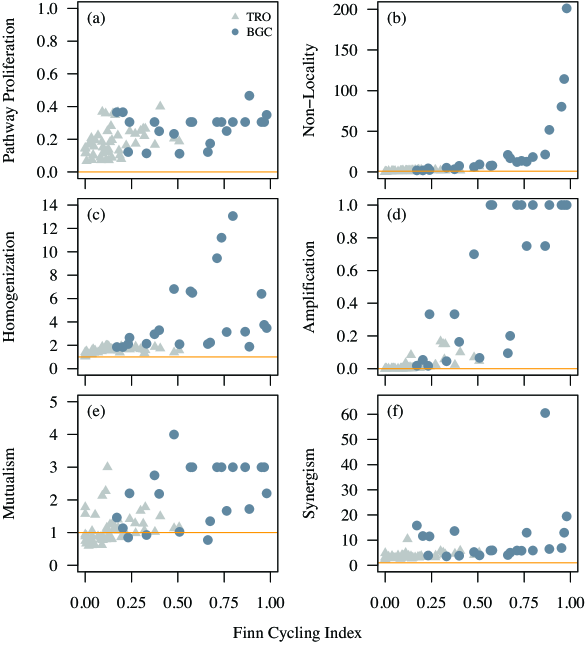
We hypothesized that the explanation for why the ENA properties would be more intense in the BGC models was due to their tendency to have greater cycling. Figure 6 confirms for this data set that all six properties tend to increase with the Finn Cycling Index, though the shape and intensity of the relationship varies. The correlations between FCI and the ENA property indicators was statistically significant (Table 3).
| Network Statistic | rho | t | p-value | Significance |
|---|---|---|---|---|
| PPR | 0.51 | 37588.97 | 2.69e-06 | * |
| I/D | 0.94 | 5211.53 | 8.40e-37 | * |
| HMG | 0.74 | 21543.63 | 8.77e-15 | * |
| AMP | 0.93 | 5811.33 | 4.85e-35 | * |
| MUT | 0.62 | 31595.33 | 1.58e-09 | * |
| SYN | 0.71 | 23824.64 | 2.36e-13 | * |
4 Discussion
4.1 Ecological Significance
Ecosystem network analysis and its associated environ theory have been developing since the mid 1970s [46, 83, 41, 11]. Today, these techniques and theory appear to be in a maturation phase. This work makes two primary contributions to this maturing systems ecology understanding of ecosystems.
First, the results presented here extend the evidence in support of five of the hypothesized general ecosystem properties: pathway proliferation, network non-locality, network homogenization, network amplification, and network synergism. Theses properties tend to occur in empirically-based network models of two classes: trophic and biogeochemical cycling. Network mutualism was more variable, especially in the BGC models, and strength of network amplification did decline with network size as it did in simulated ecosystem networks [34]. This evidence adds to the work from studies of empirically-based ecosystem networks [78, 86, 33] as well as generative ecosystem models [34, 38]. Further, these results were generally (but not always) robust to the uncertainty introduced into the flux estimates.
Second, the results suggest that the lens used to view the ecosystem – trophic or biogeochemistry – can influence the intensity of the observed network properties. In general, models with more cycling tend to have a more intense expression of these properties. This concern with analytical point of view is similar to Reiners’ [86] recognition of multiple complimentary models for ecosystems.
When considered in aggregate, these six hypothesized general properties of ecosystems reveal some of the ecological consequences of ecosystem connectivity through the lens of a single transactive currency. The intensity and pattern of direct connections among ecosystem members leads to indirect interactions that alter the ultimate nature of the interactions.
4.2 Limitations and Opportunities
A limitation of this study concerns the two sets of ecosystem network models. While the models themselves likely vary in quality, there are fewer BGC models in our sample than TRO models and the BGC models tended to have fewer nodes. This likely effects our inference about the differences between the two network classes; however, we expect the general trends reported in this paper to hold. This claim is supported by the general increase in the ecosystem network properties in the nitrogen and phosphorus models when compared to the related carbon models of both the Chesapeake Bay and Sylt-Rømø Bight models (Figs 3-4).
To determine the robustness of our results to potential parameter uncertainty, we applied an uncertainty analysis based on inverse linear modeling [99, 60, 92]. While this kind of global uncertainty analysis [87] is useful for estimating our confidence in the results, it has some limitations. First, the technique assumes the model parameters are independent when we might expect that some of the parameters may have natural inter-dependencies. Because the technique misses the potential covariances, the technique as applied is conservative, leading to potential type II statistical inference errors. Second, in the absence of better parameter uncertainties, we applied a uniform 50% parameter perturbation. In reality, some of the parameters may be more and less certain [7]. The effect of this heterogeneity of natural variability and uncertainty is an issue that needs further exploration.
While this second issue could increase or decrease the estimated 95% confidence intervals, we expect that when combined with the first issue that the confidence intervals are over estimates of the true uncertainty. If true, this bolsters the evidence presented in this paper for the support of the six ecosystem properties. A third issue that will affect the potential broad applicability of the inverse linear modeling based uncertainty analysis is the occasional failure of the procedure to identify models that meet the mathematical constraints. This is a known challenge for the technique [99].
4.3 Network Science
Network models and analyses are useful in a wide range of disciplines including medicine and genetics [30, 105], ecology [29, 2, 15], sociology [100], education [69], and business [28, 103, 53]. From these domain specific theoretical and methodological developments, a network science is emerging [72, 22, 70]. Brandes et al. [22] define network science broadly as the “study of the collection, management, analysis, interpretation, and presentation of relational data” as used to study a wide range of complex systems. While some expect that this approach will identify properties, structuring forces, and organizational consequences of connectance common to complex systems in general [7], Brandes et al. [22] claim a more modest goal for network theory. They suggest that network theory will focus on how to abstract systems into useful network representations and suggest appropriate ways of querying these models.
Ecosystems have all of the hallmarks of complex adaptive systems [65, 84]. This paper highlights a network model to investigate ecosystem energy and matter transactions and what appear to be common properties of this system class. We suspect that this has a broader relevance for network science. This abstraction and subsequent analysis was initially built upon economic Input-Output Analysis [46, 64], but has developed substantially to meet the demands of ecological and environmental questions. Thus, this ecosystem network model and analysis maybe relevant for other kinds of complex systems that can be modeled similarly.
The network science type proposition that ecosystem network models can be divided into two (or more) distinct classes is pivotal for the work presented in this manuscript. The evidence in Fig. 5 suggests that the models generally follow the expected differences between the proposed classes. Further, the hypothesized systems properties do seem to be general in both groups. Other possible classes include hydrologic models [79] and urban metabolism or industrial material flow models [3, 104, 66, 23].
Unfortunately, the distinction between TRO and BGC models is not always crisp. For example, the core conceptual model for the Sylt-Rømø Bight TRO ecosystem was only slightly modified to build the BGC models. For example, the node representing dissolved organic carbon (DOC) was re-purposed to represent dissolved nitrogen, and then the edge weights were estimated for the nitrogen fluxes rather than the carbon fluxes. Thus, the model topology is still largely that of the original trophic model, while the geometry responds to the different currency. In many cases this kind of transition makes sense because multiple nutrients (currencies) travel together in some ecosystem transactions. For example, when deer eat grass they obtain energy, carbon, and nutrients like nitrogen and phosphorus through the same process, though the stoichiometric ratios may vary in time and space [93, 62]. Thus, some of the TRO and BGC models are not strictly independent, and perhaps in the future they could be combined through the multilayer network framework recently introduced [60]. Despite this issue, we assert that the ecosystem model classification is a useful analytical technique that can capture important differences among the ecosystem model types. We look forward to the extension of these ideas to other classes of ecosystem models like the urban metabolism models [59, 23, 66] or other kinds of input-output systems [63, 101].
Funding
This work was supported by the University of North Carolina Wilmington and the National Science Foundation [DEB-1020944].
Acknowledgments
This research and manuscript benefited from critiques by colleagues in the Systems Ecology and Ecoinformatics Laboratory at UNCW.
Supporting Information
S1 Table
Twenty-two empirically-based ecosystem network models of biogeochemical cycling
S2 Table
Fifty-seven empirically-based trophic ecosystem network
References
- [1] Albert, R., Jeong, H. & Barabási, A. L. (2000) Error and attack tolerance of complex networks. Nature, 406, 378–382.
- [2] Anderson, T. K. & Sukhdeo, M. V. K. (2011) Host centrality in food web networks determines parasite diversity. PLoS ONE, 6(10), e26798.
- [3] Bailey, R., Allen, J. & Bras, B. (2004) Applying Ecological Input-Output Flow Analysis to Material Flows in Industrial Systems: Part I: Tracing Flows. J. Ind. Ecol., 8(1-2), 45–68.
- [4] Baird, D., Asmus, H. & Asmus, R. (2008) Nutrient dynamics in the Sylt-Rømø Bight ecosystem, German Wadden Sea: an ecological network analysis approach. Estuar. Coast. Shelf Sci., 80, 339–356.
- [5] Baird, D. & Ulanowicz, R. E. (1989) The seasonal dynamics of the Chesapeake Bay ecosystem. Ecol. Monogr., 59, 329–364.
- [6] Barabási, A. L. (2002) Linked: The new science of networks. Perseus, Cambridge, Mass.
- [7] Barabási, A. L. (2012) The network takeover. Nat. Phys., 8(1), 14–16.
- [8] Bascompte, J. & Jordano, P. (2007) Plant-animal mutualistic networks: the architecture of biodiversity. Ann. Rev. Ecol. Evol. Syst., 38, 567–593.
- [9] Berman, A. & Plemmons, R. J. (1979) Nonnegative Matrices in the Mathematical Sciences. Academic Press, New York.
- [10] Bondavalli, C. & Ulanowicz, R. E. (1999) Unexpected effects of predators upon their prey: The case of the American alligator. Ecosystems, 2, 49–63.
- [11] Borrett, S. R., Christian, R. R. & Ulanowicz, R. E. (2012) Network Ecology. In El-Shaarawi, A. H. & Piegorsch, W. W., editors, Encyclopedia of Environmetrics, pages 1767–1772. John Wiley & Sons, 2nd edition.
- [12] Borrett, S. R., Fath, B. D. & Patten, B. C. (2007) Functional integration of ecological networks through pathway proliferation. J. Theor. Biol., 245, 98–111.
- [13] Borrett, S. R. & Freeze, M. A. (2011) Reconnecting Environs to their Environment. Ecol. Model., 222, 2393–2403.
- [14] Borrett, S. R. & Lau, M. K. (2014) enaR: An R package for Ecosystem Network Analysis. Methods. Ecol. Evol., 11, 1206–1213.
- [15] Borrett, S. R., Moody, J. & Edelmann, A. (2014) The rise of network ecology: maps of the topic diversity and scientific collaboration. Ecol. Model., 294, 111–127.
- [16] Borrett, S. R. & Osidele, O. O. (2007) Environ indicator sensitivity to flux uncertainty in a phosphorus model of Lake Sidney Lanier, USA. Ecol. Model., 200, 371–383.
- [17] Borrett, S. R. & Patten, B. C. (2003) Structure of pathways in ecological networks: relationships between length and number. Ecol. Model., 170, 173–184.
- [18] Borrett, S. R. & Salas, A. K. (2010) Evidence for resource homogenization in 50 trophic ecosystem networks. Ecol. Model., 221, 1710–1716.
- [19] Borrett, S. R., Whipple, S. J. & Patten, B. C. (2010) Rapid Development of Indirect Effects in Ecological Networks. Oikos, 119, 1136–1148.
- [20] Brandes, U. & Erlebach, T. (2005a) Fundamentals. In Brandes, U. & Erlebach, T., editors, Network analysis: methodological foundations, LNCS 3418, pages 7–15. Springer–Verlag, Berlin Heidelberg.
- [21] Brandes, U. & Erlebach, T., editors (2005b) Network Analysis: Methodological Foundations. Springer-Verlag, Berlin, Heidelberg.
- [22] Brandes, U., Robins, G., McCranie, A. & Wasserman, S. (2013) What is network science?. Network Sci., 1(01), 1–15.
- [23] Chen, S. & Chen, B. (2012) Network environ perspective for urban metabolism and carbon emissions: a case study of Vienna, Austria. Environ. Sci. Tech., 46(8), 4498–4506.
- [24] Christian, R. R., Fores, E., Comin, F., Viaroli, P., Naldi, M. & Ferrari, I. (1996) Nitrogen cycling networks of coastal ecosystems: Influence of trophic status and primary producer form. Ecol. Model., 87, 111–129.
- [25] Christian, R. R. & Thomas, C. R. (2003) Network analysis of nitrogen inputs and cycling in the Neuse River Estuary, North Carolina, USA. Estuaries, 26, 815–828.
- [26] Csermely, P., London, A., Wu, L.-Y. & Uzzi, B. (2013) Structure and dynamics of core/periphery networks. J. Complex Net., 1(2), 93–123.
- [27] Dame, R. F. & Patten, B. C. (1981) Analysis of energy flows in an intertidal oyster reef. Mar. Ecol. Prog. Ser., 5, 115–124.
- [28] Davis, G. (1996) The significance of board interlocks for corporate governance. Corporate Governance: An International Review, 4(3), 154–159.
- [29] Dunne, J. A., Williams, R. J. & Martinez, N. D. (2002) Network topology and biodiversity loss in food webs: Robustness increases with connectance. Ecol. Lett., 5, 558–567.
- [30] Ennett, S. T. & Bauman, K. E. (1993) Peer group structure and adolescent cigarette smoking: A social network analysis. J. Health. Soc. Behav., pages 226–236.
- [31] Estrada, E. (2007) Food webs robustness to biodiversity loss: The roles of connectance, expansibility and degree distribution. J. Theor. Biol., 244(2), 296 – 307.
- [32] Fath, B. & Halnes, G. (2007) Cyclic energy pathways in ecological food webs. Ecol. Model., 208(1), 17–24.
- [33] Fath, B., Scharler, U. & Baird, D. (2013) Dependence of network metrics on model aggregation and throughflow calculations: Demonstration using the Sylt–Rømø Bight Ecosystem. Ecol. Model., 252, 214–219.
- [34] Fath, B. D. (2004) Network analysis applied to large-scale cyber-ecosystems. Ecol. Model., 171, 329–337.
- [35] Fath, B. D. (2007a) Network mututalism: Positive community-level relations in ecosystems. Ecol. Model., 208, 56–67.
- [36] Fath, B. D. (2007b) Structural food web regimes. Ecol. Model., 208(2), 391–394.
- [37] Fath, B. D. & Borrett, S. R. (2006) A Matlab© function for Network Environ Analysis. Environ. Model. Softw., 21, 375–405.
- [38] Fath, B. D. & Killian, M. C. (2007) The relevance of ecological pyramids in community assemblages. Ecol. Model., 208, 286–294.
- [39] Fath, B. D. & Patten, B. C. (1998) Network synergism: emergence of positive relations in ecological systems. Ecol. Model., 107, 127–143.
- [40] Fath, B. D. & Patten, B. C. (1999a) Quantifying resource homogenization using network flow analysis. Ecol. Model., 107, 193–205.
- [41] Fath, B. D. & Patten, B. C. (1999b) Review of the foundations of network environ analysis. Ecosystems, 2, 167–179.
- [42] Fath, B. D., Scharler, U. M., Ulanowicz, R. E. & Hannon, B. (2007) Ecological network analysis: Network construction. Ecol. Model., 208, 49–55.
- [43] Finn, J. T. (1976) Measures of ecosystem structure and function derived from analysis of flows. J. Theor. Biol., 56, 363–380.
- [44] Finn, J. T. (1980) Flow analysis of models of the Hubbard Brook ecosystem. Ecology, 61, 562–571.
- [45] Grami, B., Rasconi, S., Niquil, N., Jobard, M., Saint-Béat, B. & Sime-Ngando, T. (2011) Functional effects of parasites on food web properties during the spring diatom bloom in Lake Pavin: a linear inverse modeling analysis. PLoS ONE, 6(8), e23273.
- [46] Hannon, B. (1973) The structure of ecosystems. J. Theor. Biol., 41, 535–546.
- [47] Heymans, J. J., Coll, M., Libralato, S., Morissette, L. & Christensen, V. (2014) Global patterns in ecological indicators of marine food webs: a modelling approach. PLoS ONE, 9(4), e95845.
- [48] Higashi, M. & Patten, B. C. (1986) Further aspects of the analysis of indirect effects in ecosystems. Ecol. Model., 31, 69–77.
- [49] Higashi, M. & Patten, B. C. (1989) Dominance of indirect causality in ecosystems. Am. Nat., 133, 288–302.
- [50] Higashi, M., Patten, B. C. & Burns, T. P. (1993) Network trophic dynamics: the modes of energy utilization in ecosystems. Ecol. Model., 66(1), 1–42.
- [51] Hines, D. E., Lisa, J. A., Song, B., Tobias, C. R. & Borrett, S. R. (2012) A network model shows the importance of coupled processes in the microbial N cycle in the Cape Fear River estuary. Estuar. Coast. Shelf Sci., 106, 45–57.
- [52] Hines, D. E., Lisa, J. A., Song, B., Tobias, C. R. & Borrett, S. R. (2015) Estimating the effects of seawater intrusion on an estuarine nitrogen cycle by comparative network analysis. Mar. Ecol. Prog. Ser., 524, 137–154.
- [53] Huang, X., Vodenska, I., Wang, F., Havlin, S. & Stanley, H. E. (2011) Identifying influential directors in the United States corporate governance network. Phys. Rev. E, 84(4), 046101.
- [54] Jørgensen, S. E. (2012) Introduction to Systems Ecology. CRC Press.
- [55] Jørgensen, S. E., Fath, B. D., Bastianoni, S., Marques, J. C., Müller, F., Nielsen, S., Patten, B. C., Tiezzi, E. & Ulanowicz, R. E. (2007) A new ecology: Systems perspective. Elsevier, Amsterdam.
- [56] Jørgensen, S. E., Patten, B. C. & Straškraba, M. (2000) Ecosystems emerging: 4. Growth. Ecol. Model., 126, 249–284.
- [57] Kaufman, A. G. & Borrett, S. R. (2010) Ecosystem network analysis indicators are generally robust to parameter uncertainty in a phosphorus model of Lake Sidney Lanier, USA. Ecol. Model., 221, 1230–1238.
- [58] Kazanci, C. (2007) EcoNet: A new software for ecological modeling, simulation and network analysis. Ecol. Model., 208, 3–8.
- [59] Kennedy, C., Pincetl, S. & Bunje, P. (2011) The study of urban metabolism and its applications to urban planning and design. Environ. Pollut., 159(8), 1965–1973.
- [60] Kivelä, M., Arenas, A., Barthelemy, M., Gleeson, J. P., Moreno, Y. & Porter, M. A. (2014) Multilayer networks. J. Complex Net., 2(3), 203–271.
- [61] Kones, J. K., Soetaert, K., van Oevelen, D. & Owino, J. O. (2009) Are network indices robust indicators of food web functioning? a Monte Carlo approach. Ecol. Model., 220(3), 370–382.
- [62] Latham II, L. G. (2006) Network flow analysis algorithms. Ecol. Model., 192(3), 586–600.
- [63] Lauridsen, R. B., Edwards, F. K., Cross, W. F., Woodward, G., Hildrew, A. G. & Jones, J. I. (2014) Consequences of inferring diet from feeding guilds when estimating and interpreting consumer–resource stoichiometry. Freshwater. Biol., 59(7), 1497–1508.
- [64] Layton, A., Reap, J., Bras, B. & Weissburg, M. (2012) Correlation between thermodynamic efficiency and ecological cyclicity for thermodynamic power cycles. PLoS ONE, 7(12), e51841.
- [65] Leontief, W. W. (1965) The structure of the American economy. Sci. Am., 212, 25–35.
- [66] Levin, S. A. (1998) Ecosystems and the biosphere as complex adaptive systems. Ecosystems, 1, 431–436.
- [67] Li, S., Zhang, Y., Yang, Z., Liu, H. & Zhang, J. (2012) Ecological relationship analysis of the urban metabolic system of Beijing, China. Environ. Pollut., 170, 169–176.
- [68] Liberati, A., Altman, D. G., Tetzlaff, J., Mulrow, C., Gøtzsche, P. C., Ioannidis, J. P. A., Clarke, M., Devereaux, P. J., Kleijnen, J. & Moher, D. (2009) The PRISMA statement for reporting systematic reviews and meta-analyses of studies that evaluate health care interventions: explanation and elaboration. PLOS Med, 6(7), e1000100.
- [69] Luczkovich, J. J., Borgatti, S. P., Johnson, J. C. & Everett, M. G. (2003) Defining and measuring trophic role similarity in food webs using regular equivalence. J. Theor. Biol., 220, 303–321.
- [70] Martınez, A., Dimitriadis, Y., Rubia, B., Gómez, E. & De La Fuente, P. (2003) Combining qualitative evaluation and social network analysis for the study of classroom social interactions. Comput. Educ., 41(4), 353–368.
- [71] National Research Council, Committee on Network Science for Army Applications (2006) Network Science. The National Academies Press, Washington, DC.
- [72] Newman, M. E. J. (2001) Scientific collaboration networks. I. Network construction and fundamental results. Phys. Rev. E, 64(1), 016131.
- [73] Newman, M. E. J. (2010) Networks: An Introduction. Oxford University Press, Oxford.
- [74] Otto, S. B., Rall, B. C. & Brose, U. (2007) Allometric degree distributions facilitate food-web stability. Nature, 450(7173), 1226–1229.
- [75] Patten, B. (1982) Indirect causality in ecosystems: its significance for environmental protection. In Mason, W. T. & Iker, S., editors, Research on Fish and Wildlife. Commemorative Monograph in Honor of the First Decade of the US Environmental Protection Agency, pages 92–107. Office of Research and Development, US Environmental Protection Agency, Washington, D.C.
- [76] Patten, B. (1983) On the quantitative dominance of indirect effects in ecosystems. In Lauenroth, W. K., Skogerboe, G. V. & Flug, M., editors, Analysis of Ecological Systems: State-of-the-art in Ecological Modelling, pages 27–37. Elsevier, Amsterdam.
- [77] Patten, B. (1985a) Energy cycling, length of food chains, and direct versus indirect effects in ecosystems. Can. Bull. Fish. Aqu. Sci., 213, 119–138.
- [78] Patten, B. (1990) Environ theory and indirect effects: A reply to Loehle. Ecology, 71, 2386–2393.
- [79] Patten, B., Higashi, M. & Burns, T. (1990) Trophic dynamics in ecosystem networks: significance of cycles and storage. Ecol. Model., 51, 1–28.
- [80] Patten, B. & Matis, J. (1982) The water environs of the Okefenokee swamp: an application of static linear environ analysis. Ecol. Model., 16, 1–50.
- [81] Patten, B., Richardson, T. & Barber, M. (1982) Path analysis of a reservoir ecosystem model. Can. Water Res. J., 7, 252–282.
- [82] Patten, B. C. (1985b) Energy cycling in the ecosystem. Ecol. Model., 28, 1–71.
- [83] Patten, B. C. (1991) Network ecology: Indirect determination of the life–environment relationship in ecosystems. In Higashi, M. & Burns, T., editors, Theoretical Studies of Ecosystems: The Network Perspective, pages 288–351. Cambridge University Press, New York.
- [84] Patten, B. C., Bosserman, R. W., Finn, J. T. & Cale, W. G. (1976) Propagation of cause in ecosystems. In Patten, B. C., editor, Systems Analysis and Simulation in Ecology, Vol. IV, pages 457–579. Academic Press, New York.
- [85] Patten, B. C., Fath, B. D., Choi, J. S., Bastianoni, S., Borrett, S. R., Brandt-Williams, S., Debeljak, M., Fonseca, J., Grant, W. E., Karnawati, D., Marques, J. C., Moser, A., Müller, F., Pahl-Wostl, C., Seppelt, R., Seinborn, W. H. & Svirezhev, Y. M. (2002) Complex adaptive hierarchical systems. In Costanza, R. & Jørgensen, S. E., editors, Understanding and Solving Environmental Problems in the 21st Century: Toward a New, Integrated Hard Problem Science, pages 41–87. Elsevier Science, Ltd, Oxford.
- [86] Reiners, W. A. (1986) Complementary models for ecosystems. Am. Nat., pages 59–73.
- [87] Saint-Béat, B., Baird, D., Asmus, H., Asmus, R., Bacher, C., Pacella, S. R., Johnson, G. A., David, V., Vézina, A. F. & Niquil, N. (2015) Trophic networks: How do theories link ecosystem structure and functioning to stability properties? A review. Ecol. Indic., 52, 458–471.
- [88] Salas, A. K. & Borrett, S. R. (2011) Evidence for dominance of indirect effects in 50 trophic ecosystem networks. Ecol. Model., 222, 1192–1204.
- [89] Saltelli, A., Ratto, M., Andres, T., Campolongo, F., Cariboni, J., Gatelli, D., Saisana, M. & Tarantola, S. (2008) Global sensitivity analysis: The primer. John Wiley & Sons.
- [90] Samuelson, P. A. (1948) Economics: An Introductory Analysis. McGraw–Hill Book Co., New York,.
- [91] Schramski, J. R., Kazanci, C. & Tollner, E. W. (2011) Network environ theory, simulation and EcoNet© 2.0. Environ. Model. Softw., 26, 419–428.
- [92] Scotti, M., Ciocchetta, F. & Jordán, F. (2013) Social and landscape effects on food webs: A multi-level network simulation model. J. Complex Net., 1(2), 160–182.
- [93] Small, G. E., Sterner, R. W. & Finlay, J. C. (2014) An Ecological Network Analysis of nitrogen cycling in the Laurentian Great Lakes. Ecol. Model., 293, 150–160.
- [94] Soetaert, K., Van den Meersche, K. & van Oevelen, D. (2009) limSolve: Solving Linear Inverse Models. R package version 1.5.1.
- [95] Sterner, R. W. & Elser, J. J. (2002) Ecological Stoichiometry: The Biology of Elements from Molecules to the Biosphere. Princeton University Press.
- [96] Thébault, E. & Fontaine, C. (2010) Stability of ecological communities and the architecture of mutualistic and trophic networks. Science, 329(5993), 853–856.
- [97] Ulanowicz, R. E. (1986) Growth and Development: Ecosystems Phenomenology. Springer–Verlag, New York.
- [98] Ulanowicz, R. E. (2004) Quantitative methods for ecological network analysis. Comput. Biol. Chem., 28, 321–339.
- [99] Ulanowicz, R. E., Holt, R. D. & Barfield, M. (2014) Limits on ecosystem trophic complexity: insights from ecological network analysis. Ecol. Lett., 17(2), 127–136.
- [100] Ulanowicz, R. E. & Kay, J. (1991) A package for the analysis of ecosystem flow networks. Envir. Soft., 6, 131–142.
- [101] Vézina, A. F. & Platt, T. (1988) Food web dynamics in the ocean. 1. Best-estimates of flow networks using inverse methods. Mar. Ecol. Prog. Ser., 42(3), 269–287.
- [102] Wasserman, S. & Faust, K. (1994) Social network analysis: Methods and applications. Cambridge University Press, Cambridge; New York.
- [103] Wiedmann, T. O., Schandl, H., Lenzen, M., Moran, D., Suh, S., West, J. & Kanemoto, K. (2013) The material footprint of nations. Proc. Nat. Acad. Sci. USA, 112, 6271–6276.
- [104] Wuellner, D. R., Roy, S. & D’Souza, R. M. (2010) Resilience and rewiring of the passenger airline networks in the United States. Phys. Rev. E, 82(5, Part 2).
- [105] Zhang, Y., Yang, Z. & Fath, B. (2010) Ecological network analysis of an urban water metabolic system: Model development, and a case study for Beijing. Sci. Total Env., 408, 4702–4711.
- [106] Zhao, J., Yang, T.-H., Huang, Y. & Holme, P. (2011) Ranking Candidate Disease Genes from Gene Expression and Protein Interaction: A Katz-Centrality Based Approach. PLoS ONE, 6(9), e24306.
Supporting Information
S1 Table
Twenty-two empirically-based ecosystem network models of biogeochemical cycling
S2 Table
Fifty-seven empirically-based trophic ecosystem network
Acknowledgments
This research and manuscript benefited from critiques by colleagues in the Systems Ecology and Ecoinformatics Laboratory at UNCW.
References
- [1] Albert, R., Jeong, H. & Barabási, A. L. (2000) Error and attack tolerance of complex networks. Nature, 406, 378–382.
- [2] Anderson, T. K. & Sukhdeo, M. V. K. (2011) Host centrality in food web networks determines parasite diversity. PLoS ONE, 6(10), e26798.
- [3] Bailey, R., Allen, J. & Bras, B. (2004) Applying Ecological Input-Output Flow Analysis to Material Flows in Industrial Systems: Part I: Tracing Flows. Journal of Industrial Ecology, 8(1-2), 45–68.
- [4] Baird, D., Asmus, H. & Asmus, R. (2008) Nutrient dynamics in the Sylt-Rømø Bight ecosystem, German Wadden Sea: an ecological network analysis approach. Estuar. Coast. Shelf Sci., 80, 339–356.
- [5] Baird, D. & Ulanowicz, R. E. (1989) The seasonal dynamics of the Chesapeake Bay ecosystem. Ecol. Monogr., 59, 329–364.
- [6] Barabási, A. L. (2002) Linked: The new science of networks. Perseus, Cambridge, Mass.
- [7] Barabási, A. L. (2012) The network takeover. Nat. Phys., 8(1), 14–16.
- [8] Bascompte, J. & Jordano, P. (2007) Plant-animal mutualistic networks: the architecture of biodiversity. Ann. Rev. Ecol. Evol. Syst., 38, 567–593.
- [9] Berman, A. & Plemmons, R. J. (1979) Nonnegative Matrices in the Mathematical Sciences. Academic Press, New York.
- [10] Bondavalli, C. & Ulanowicz, R. E. (1999) Unexpected effects of predators upon their prey: The case of the American alligator. Ecosystems, 2, 49–63.
- [11] Borrett, S. R., Christian, R. R. & Ulanowicz, R. E. (2012) Network Ecology. In El-Shaarawi, A. H. & Piegorsch, W. W., editors, Encyclopedia of Environmetrics, pages 1767–1772. John Wiley & Sons, 2nd edition.
- [12] Borrett, S. R., Fath, B. D. & Patten, B. C. (2007) Functional integration of ecological networks through pathway proliferation. J. Theor. Biol., 245, 98–111.
- [13] Borrett, S. R. & Freeze, M. A. (2011) Reconnecting Environs to their Environment. Ecol. Model., 222, 2393–2403.
- [14] Borrett, S. R. & Lau, M. K. (2014) enaR: An R package for Ecological Network Analysis. Methods. Ecol. Evol., 11, 1206–1213.
- [15] Borrett, S. R., Moody, J. & Edelmann, A. (2014) The rise of network ecology: maps of the topic diversity and scientific collaboration. Ecol. Model., 294, 111–127.
- [16] Borrett, S. R. & Osidele, O. O. (2007) Environ indicator sensitivity to flux uncertainty in a phosphorus model of Lake Sidney Lanier, USA. Ecol. Model., 200, 371–383.
- [17] Borrett, S. R. & Patten, B. C. (2003) Structure of pathways in ecological networks: relationships between length and number. Ecol. Model., 170, 173–184.
- [18] Borrett, S. R. & Salas, A. K. (2010) Evidence for resource homogenization in 50 trophic ecosystem networks. Ecol. Model., 221, 1710–1716.
- [19] Borrett, S. R., Whipple, S. J. & Patten, B. C. (2010) Rapid Development of Indirect Effects in Ecological Networks. Oikos, 119, 1136–1148.
- [20] Brandes, U. & Erlebach, T. (2005a) Fundamentals. In Brandes, U. & Erlebach, T., editors, Network analysis: methodological foundations, LNCS 3418, pages 7–15. Springer–Verlag, Berlin Heidelberg.
- [21] Brandes, U. & Erlebach, T., editors (2005b) Network Analysis: Methodological Foundations. Springer-Verlag, Berlin, Heidelberg.
- [22] Brandes, U., Robins, G., McCranie, A. & Wasserman, S. (2013) What is network science?. Network Sci., 1(01), 1–15.
- [23] Chen, S. & Chen, B. (2012) Network environ perspective for urban metabolism and carbon emissions: a case study of Vienna, Austria. Environ. Sci. Tech., 46(8), 4498–4506.
- [24] Christian, R. R., Fores, E., Comin, F., Viaroli, P., Naldi, M. & Ferrari, I. (1996) Nitrogen cycling networks of coastal ecosystems: Influence of trophic status and primary producer form. Ecol. Model., 87, 111–129.
- [25] Christian, R. R. & Thomas, C. R. (2003) Network analysis of nitrogen inputs and cycling in the Neuse River Estuary, North Carolina, USA. Estuaries, 26, 815–828.
- [26] Csermely, P., London, A., Wu, L.-Y. & Uzzi, B. (2013) Structure and dynamics of core/periphery networks. J. Complex Net., 1(2), 93–123.
- [27] Dame, R. F. & Patten, B. C. (1981) Analysis of energy flows in an intertidal oyster reef. Mar. Ecol. Prog. Ser., 5, 115–124.
- [28] Davis, G. (1996) The significance of board interlocks for corporate governance. Corporate Governance: An International Review, 4(3), 154–159.
- [29] Dunne, J. A., Williams, R. J. & Martinez, N. D. (2002) Network topology and biodiversity loss in food webs: Robustness increases with connectance. Ecol. Lett., 5, 558–567.
- [30] Ennett, S. T. & Bauman, K. E. (1993) Peer group structure and adolescent cigarette smoking: A social network analysis. J. Health. Soc. Behav., pages 226–236.
- [31] Estrada, E. (2007) Food webs robustness to biodiversity loss: The roles of connectance, expansibility and degree distribution. J. Theor. Biol., 244(2), 296 – 307.
- [32] Fath, B. & Halnes, G. (2007) Cyclic energy pathways in ecological food webs. Ecol. Model., 208(1), 17–24.
- [33] Fath, B., Scharler, U. & Baird, D. (2013) Dependence of network metrics on model aggregation and throughflow calculations: Demonstration using the Sylt–Rømø Bight Ecosystem. Ecol. Model., 252, 214–219.
- [34] Fath, B. D. (2004) Network analysis applied to large-scale cyber-ecosystems. Ecol. Model., 171, 329–337.
- [35] Fath, B. D. (2007a) Network mututalism: Positive community-level relations in ecosystems. Ecol. Model., 208, 56–67.
- [36] Fath, B. D. (2007b) Structural food web regimes. Ecol. Model., 208(2), 391–394.
- [37] Fath, B. D. & Borrett, S. R. (2006) A Matlab© function for Network Environ Analysis. Environ. Model. Softw., 21, 375–405.
- [38] Fath, B. D. & Killian, M. C. (2007) The relevance of ecological pyramids in community assemblages. Ecol. Model., 208, 286–294.
- [39] Fath, B. D. & Patten, B. C. (1998) Network synergism: emergence of positive relations in ecological systems. Ecol. Model., 107, 127–143.
- [40] Fath, B. D. & Patten, B. C. (1999a) Quantifying resource homogenization using network flow analysis. Ecol. Model., 107, 193–205.
- [41] Fath, B. D. & Patten, B. C. (1999b) Review of the foundations of network environ analysis. Ecosystems, 2, 167–179.
- [42] Fath, B. D., Scharler, U. M., Ulanowicz, R. E. & Hannon, B. (2007) Ecological network analysis: Network construction. Ecol. Model., 208, 49–55.
- [43] Finn, J. T. (1976) Measures of ecosystem structure and function derived from analysis of flows. J. Theor. Biol., 56, 363–380.
- [44] Finn, J. T. (1980) Flow analysis of models of the Hubbard Brook ecosystem. Ecology, 61, 562–571.
- [45] Grami, B., Rasconi, S., Niquil, N., Jobard, M., Saint-Béat, B. & Sime-Ngando, T. (2011) Functional effects of parasites on food web properties during the spring diatom bloom in Lake Pavin: a linear inverse modeling analysis. PLoS One, 6(8), e23273.
- [46] Hannon, B. (1973) The structure of ecosystems. J. Theor. Biol., 41, 535–546.
- [47] Heymans, J. J., Coll, M., Libralato, S., Morissette, L. & Christensen, V. (2014) Global patterns in ecological indicators of marine food webs: a modelling approach. PLoS ONE, 9(4), e95845.
- [48] Higashi, M. & Patten, B. C. (1986) Further aspects of the analysis of indirect effects in ecosystems. Ecol. Model., 31, 69–77.
- [49] Higashi, M. & Patten, B. C. (1989) Dominance of indirect causality in ecosystems. Am. Nat., 133, 288–302.
- [50] Higashi, M., Patten, B. C. & Burns, T. P. (1993) Network trophic dynamics: the modes of energy utilization in ecosystems. Ecol. Model., 66(1), 1–42.
- [51] Hines, D. E., Lisa, J. A., Song, B., Tobias, C. R. & Borrett, S. R. (2012) A network model shows the importance of coupled processes in the microbial N cycle in the Cape Fear River estuary. Estuar. Coast. Shelf Sci., 106, 45–57.
- [52] Hines, D. E., Lisa, J. A., Song, B., Tobias, C. R. & Borrett, S. R. (2015) Estimating the effects of seawater intrusion on an estuarine nitrogen cycle by comparative network analysis. Mar. Ecol. Prog. Ser., 524, 137–154.
- [53] Huang, X., Vodenska, I., Wang, F., Havlin, S. & Stanley, H. E. (2011) Identifying influential directors in the United States corporate governance network. Phys. Rev. E, 84(4), 046101.
- [54] Jørgensen, S. E. (2012) Introduction to Systems Ecology. CRC Press.
- [55] Jørgensen, S. E., Fath, B. D., Bastianoni, S., Marques, J. C., Müller, F., Nielsen, S., Patten, B. C., Tiezzi, E. & Ulanowicz, R. E. (2007) A new ecology: Systems perspective. Elsevier, Amsterdam.
- [56] Jørgensen, S. E., Patten, B. C. & Straškraba, M. (2000) Ecosystems emerging: 4. Growth. Ecol. Model., 126, 249–284.
- [57] Kaufman, A. G. & Borrett, S. R. (2010) Ecosystem network analysis indicators are generally robust to parameter uncertainty in a phosphorus model of Lake Sidney Lanier, USA. Ecol. Model., 221, 1230–1238.
- [58] Kazanci, C. (2007) EcoNet: A new software for ecological modeling, simulation and network analysis. Ecol. Model., 208, 3–8.
- [59] Kennedy, C., Pincetl, S. & Bunje, P. (2011) The study of urban metabolism and its applications to urban planning and design. Environ. Pollut., 159(8), 1965–1973.
- [60] Kones, J. K., Soetaert, K., van Oevelen, D. & Owino, J. O. (2009) Are network indices robust indicators of food web functioning? a Monte Carlo approach. Ecol. Model., 220(3), 370–382.
- [61] Latham II, L. G. (2006) Network flow analysis algorithms. Ecol. Model., 192(3), 586–600.
- [62] Lauridsen, R. B., Edwards, F. K., Cross, W. F., Woodward, G., Hildrew, A. G. & Jones, J. I. (2014) Consequences of inferring diet from feeding guilds when estimating and interpreting consumer–resource stoichiometry. Freshwater. Biol., 59(7), 1497–1508.
- [63] Layton, A., Reap, J., Bras, B. & Weissburg, M. (2012) Correlation between thermodynamic efficiency and ecological cyclicity for thermodynamic power cycles. PLoS ONE, 7(12), e51841.
- [64] Leontief, W. W. (1965) The structure of the American economy. Sci. Am., 212, 25–35.
- [65] Levin, S. A. (1998) Ecosystems and the biosphere as complex adaptive systems. Ecosystems, 1, 431–436.
- [66] Li, S., Zhang, Y., Yang, Z., Liu, H. & Zhang, J. (2012) Ecological relationship analysis of the urban metabolic system of Beijing, China. Environmental Pollution, 170, 169–176.
- [67] Liberati, A., Altman, D. G., Tetzlaff, J., Mulrow, C., Gøtzsche, P. C., Ioannidis, J. P. A., Clarke, M., Devereaux, P. J., Kleijnen, J. & Moher, D. (2009) The PRISMA statement for reporting systematic reviews and meta-analyses of studies that evaluate health care interventions: explanation and elaboration. PLOS Med, 6(7), e1000100.
- [68] Luczkovich, J. J., Borgatti, S. P., Johnson, J. C. & Everett, M. G. (2003) Defining and measuring trophic role similarity in food webs using regular equivalence. J. Theor. Biol., 220, 303–321.
- [69] Martınez, A., Dimitriadis, Y., Rubia, B., Gómez, E. & De La Fuente, P. (2003) Combining qualitative evaluation and social network analysis for the study of classroom social interactions. Computers & Education, 41(4), 353–368.
- [70] National Research Council, Committee on Network Science for Army Applications (2006) Network Science. The National Academies Press, Washington, DC.
- [71] Newman, M. E. J. (2001) Scientific collaboration networks. I. Network construction and fundamental results. Phys. Rev. E, 64(1), 016131.
- [72] Newman, M. E. J. (2010) Networks: An Introduction. Oxford University Press, Oxford.
- [73] Otto, S. B., Rall, B. C. & Brose, U. (2007) Allometric degree distributions facilitate food-web stability. Nature, 450(7173), 1226–1229.
- [74] Patten, B. (1982) Indirect causality in ecosystems: its significance for environmental protection. In Mason, W. T. & Iker, S., editors, Research on Fish and Wildlife. Commemorative Monograph in Honor of the First Decade of the US Environmental Protection Agency, pages 92–107. Office of Research and Development, US Environmental Protection Agency, Washington, D.C.
- [75] Patten, B. (1983) On the quantitative dominance of indirect effects in ecosystems. In Lauenroth, W. K., Skogerboe, G. V. & Flug, M., editors, Analysis of Ecological Systems: State-of-the-art in Ecological Modelling, pages 27–37. Elsevier, Amsterdam.
- [76] Patten, B. (1985a) Energy cycling, length of food chains, and direct versus indirect effects in ecosystems. Can. Bull. Fish. Aqu. Sci., 213, 119–138.
- [77] Patten, B. (1990) Environ theory and indirect effects: A reply to Loehle. Ecology, 71, 2386–2393.
- [78] Patten, B., Higashi, M. & Burns, T. (1990) Trophic dynamics in ecosystem networks: significance of cycles and storage. Ecol. Model., 51, 1–28.
- [79] Patten, B. & Matis, J. (1982) The water environs of the Okefenokee swamp: an application of static linear environ analysis. Ecol. Model., 16, 1–50.
- [80] Patten, B., Richardson, T. & Barber, M. (1982) Path analysis of a reservoir ecosystem model. Can. Water Res. J., 7, 252–282.
- [81] Patten, B. C. (1985b) Energy cycling in the ecosystem. Ecol. Model., 28, 1–71.
- [82] Patten, B. C. (1991) Network ecology: Indirect determination of the life–environment relationship in ecosystems. In Higashi, M. & Burns, T., editors, Theoretical Studies of Ecosystems: The Network Perspective, pages 288–351. Cambridge University Press, New York.
- [83] Patten, B. C., Bosserman, R. W., Finn, J. T. & Cale, W. G. (1976) Propagation of cause in ecosystems. In Patten, B. C., editor, Systems Analysis and Simulation in Ecology, Vol. IV, pages 457–579. Academic Press, New York.
- [84] Patten, B. C., Fath, B. D., Choi, J. S., Bastianoni, S., Borrett, S. R., Brandt-Williams, S., Debeljak, M., Fonseca, J., Grant, W. E., Karnawati, D., Marques, J. C., Moser, A., Müller, F., Pahl-Wostl, C., Seppelt, R., Seinborn, W. H. & Svirezhev, Y. M. (2002) Complex adaptive hierarchical systems. In Costanza, R. & Jørgensen, S. E., editors, Understanding and Solving Environmental Problems in the 21st Century: Toward a New, Integrated Hard Problem Science, pages 41–87. Elsevier Science, Ltd, Oxford.
- [85] Saint-Béat, B., Baird, D., Asmus, H., Asmus, R., Bacher, C., Pacella, S. R., Johnson, G. A., David, V., Vézina, A. F. & Niquil, N. (2015) Trophic networks: How do theories link ecosystem structure and functioning to stability properties? A review. Ecol. Indic., 52, 458–471.
- [86] Salas, A. K. & Borrett, S. R. (2011) Evidence for dominance of indirect effects in 50 trophic ecosystem networks. Ecol. Model., 222, 1192–1204.
- [87] Saltelli, A., Ratto, M., Andres, T., Campolongo, F., Cariboni, J., Gatelli, D., Saisana, M. & Tarantola, S. (2008) Global sensitivity analysis: The primer. John Wiley & Sons.
- [88] Samuelson, P. A. (1948) Economics: An Introductory Analysis. McGraw–Hill Book Co., New York,.
- [89] Schramski, J. R., Kazanci, C. & Tollner, E. W. (2011) Network environ theory, simulation and EcoNet© 2.0. Environ. Model. Softw., 26, 419–428.
- [90] Scotti, M., Ciocchetta, F. & Jordán, F. (2013) Social and landscape effects on food webs: A multi-level network simulation model. J. Complex Net., 1(2), 160–182.
- [91] Small, G. E., Sterner, R. W. & Finlay, J. C. (2014) An Ecological Network Analysis of nitrogen cycling in the Laurentian Great Lakes. Ecol. Model., 293, 150–160.
- [92] Soetaert, K., Van den Meersche, K. & van Oevelen, D. (2009) limSolve: Solving Linear Inverse Models. R package version 1.5.1.
- [93] Sterner, R. W. & Elser, J. J. (2002) Ecological Stoichiometry: The Biology of Elements from Molecules to the Biosphere. Princeton University Press.
- [94] Thébault, E. & Fontaine, C. (2010) Stability of ecological communities and the architecture of mutualistic and trophic networks. Science, 329(5993), 853–856.
- [95] Ulanowicz, R. E. (1986) Growth and Development: Ecosystems Phenomenology. Springer–Verlag, New York.
- [96] Ulanowicz, R. E. (2004) Quantitative methods for ecological network analysis. Comput. Biol. Chem., 28, 321–339.
- [97] Ulanowicz, R. E., Holt, R. D. & Barfield, M. (2014) Limits on ecosystem trophic complexity: insights from ecological network analysis. Ecol. Lett., 17(2), 127–136.
- [98] Ulanowicz, R. E. & Kay, J. (1991) A package for the analysis of ecosystem flow networks. Environmental Software, 6, 131–142.
- [99] Vézina, A. F. & Platt, T. (1988) Food web dynamics in the ocean. 1. Best-estimates of flow networks using inverse methods. Mar. Ecol. Prog. Ser., 42(3), 269–287.
- [100] Wasserman, S. & Faust, K. (1994) Social network analysis: Methods and applications. Cambridge University Press, Cambridge; New York.
- [101] Wiedmann, T. O., Schandl, H., Lenzen, M., Moran, D., Suh, S., West, J. & Kanemoto, K. (2013) The material footprint of nations. Proc. Nat. Acad. Sci. USA, 112, 6271–6276.
- [102] Williams, R. J., Berlow, E. L., Dunne, J. A., Barabasi, A.-L. & Martinez, N. D. (2002) Two degrees of separation in complex food webs. Proc. Nat. Acad. Sci. USA, 99, 12913–12916.
- [103] Wuellner, D. R., Roy, S. & D’Souza, R. M. (2010) Resilience and rewiring of the passenger airline networks in the United States. Phys. Rev. E, 82(5, Part 2).
- [104] Zhang, Y., Yang, Z. & Fath, B. (2010) Ecological network analysis of an urban water metabolic system: Model development, and a case study for Beijing. Sci. Total Env., 408, 4702–4711.
- [105] Zhao, J., Yang, T.-H., Huang, Y. & Holme, P. (2011) Ranking Candidate Disease Genes from Gene Expression and Protein Interaction: A Katz-Centrality Based Approach. PLoS ONE, 6(9), e24306.
| Model | Units | Reference | |||||
|---|---|---|---|---|---|---|---|
| Hubbard Brook (Ca)(Waide) | kg Ca Ha-1 yr-1 | 4 | 0.25 | 11 | 168 | 0.76 | [11] |
| Hardwood Forest, NH (Ca) | kg Ca Ha-1 yr-1 | 4 | 0.31 | 11 | 200 | 0.80 | [9] |
| Duglas Fir Forest, WA (Ca) | kg Ca Ha-1 yr-1 | 4 | 0.31 | 4 | 54 | 0.74 | [9] |
| Duglas Fir Forest, WA (K) | kg K Ha-1 yr-1 | 4 | 0.31 | 0 | 45 | 0.97 | [9] |
| Puerto Rican Rain Forest (Ca) | kg Ca Ha-1 yr-1 | 4 | 0.31 | 43 | 274 | 0.57 | [9] |
| Puerto Rican Rain Forest (K) | kg K Ha-1 yr-1 | 4 | 0.31 | 20 | 433 | 0.86 | [9] |
| Puerto Rican Rain Forest (Mg) | kg Mg Ha-1 yr-1 | 4 | 0.31 | 10 | 70 | 0.58 | [9] |
| Puerto Rican Rain Forest (Cu) | kg Cu Ha-1 yr-1 | 4 | 0.31 | 0 | 2 | 0.37 | [9] |
| Puerto Rican Rain Forest (Fe) | kg Fe Ha-1 yr-1 | 4 | 0.31 | 0 | 7 | 0.95 | [9] |
| Puerto Rican Rain Forest (Mn) | kg Mn Ha-1 yr-1 | 4 | 0.38 | 0 | 7 | 0.98 | [9] |
| Puerto Rican Rain Forest (Na) | kg Na Ha-1 yr-1 | 4 | 0.31 | 64 | 140 | 0.24 | [9] |
| Puerto Rican Rain Forest (Sr) | kg Sr Ha-1 yr-1 | 4 | 0.31 | 0 | 1 | 0.71 | [9] |
| Tropical Rain Forest (N) | g N m-2 d-1 | 5 | 0.24 | 10 | 71 | 0.48 | [5] |
| Neuse River Estuary (N, AVG) | mmol N m-2 season-1 | 7 | 0.45 | 795 | 41,517 | 0.89 | [4] |
| Cape Fear River Estuary (N, oligohaline) | nmol N cm-3 d-1 | 8 | 0.36 | 3,802 | 7,088 | 0.20 | [6] |
| Cape Fear River Estuary (N, polyhaline) | nmol N cm-3 d-1 | 8 | 0.36 | 3,068 | 5,322 | 0.17 | [7] |
| Lake Lanier (P) Averaged | mg P m-2 day-1 | 11 | 0.21 | 95 | 749 | 0.40 | [3] |
| Baltic Sea (N) | mg N m-3 day-1 | 16 | 0.15 | 2,348 | 44,510 | 0.67 | [8] |
| Chesapeake Bay (N) | mg N m-2 yr-1 | 36 | 0.12 | 73,430 | 484,325 | 0.33 | [2] |
| Chesapeake Bay (P) | mg P m-2 yr-1 | 36 | 0.12 | 9,402 | 101,092 | 0.51 | [10] |
| Sylt-Rømø Bight (N) | mg N m-2 yr-1 | 59 | 0.09 | 99,613 | 363,693 | 0.23 | [1] |
| Sylt-Rømø Bight (P) | mg P m-2 yr-1 | 59 | 0.09 | 2,510 | 57,708 | 0.66 | [1] |
References
- [1] Baird, D., Asmus, H. & Asmus, R. (2008) Nutrient dynamics in the Sylt-Rømø Bight ecosystem, German Wadden Sea: an ecological network analysis approach. Estuar. Coast. Shelf Sci., 80, 339–356.
- [2] Baird, D., Ulanowicz, R. E. & Boynton, W. R. (1995) Seasonal nitrogen dynamics in Chesapeake Bay—a network approach. Estuar. Coast. Shelf Sci., 41(2), 137–162.
- [3] Borrett, S. R. & Osidele, O. O. (2007) Environ indicator sensitivity to flux uncertainty in a phosphorus model of Lake Sidney Lanier, USA. Ecol. Model., 200, 371–383.
- [4] Christian, R. R. & Thomas, C. R. (2003) Network analysis of nitrogen inputs and cycling in the Neuse River Estuary, North Carolina, USA. Estuaries, 26, 815–828.
- [5] Edmisten, J. (1970) Preliminary studies of the nitrogen budget of a tropical rain forest. In Odum, H. T. & Pigeon, R. F., editors, A Tropical Rain Forest, number TID-24270, pages 211–215. USAEC Technical Information Center.
- [6] Hines, D. E., Lisa, J. A., Song, B., Tobias, C. R. & Borrett, S. R. (2012) A network model shows the importance of coupled processes in the microbial N cycle in the Cape Fear River estuary. Estuar. Coast. Shelf Sci., 106, 45–57.
- [7] Hines, D. E., Lisa, J. A., Song, B., Tobias, C. R. & Borrett, S. R. (2015) Estimating the effects of seawater intrusion on an estuarine nitrogen cycle by comparative network analysis. Mar. Ecol. Prog. Ser., 524, 137–154.
- [8] Hinrichsen, U. & Wulff, F. (1998) Biogeochemical and physical controls of nitrogen fluxes in a highly dynamic marine ecosystem—model and network flow analysis of the Baltic Sea. Ecol. Model., 109, 165–191.
- [9] Jordan, C. F., Kline, J. R. & Sasscer, D. S. (1972) Relative stability of mineral cycles in forest ecosystems. Am. Nat., 106, 237–253.
- [10] Ulanowicz, R. E. & Baird, D. (1999) Nutrient controls on ecosystem dynamics: The Chesapeake mesohaline community. J. Mar. Syst., 19, 159–172.
- [11] Waide, J. B., Krebs, J. E., Clarkson, S. P. & Setzler, E. M. (1974) A linear system analysis of the calcium cycle in a forested watershed ecosystem. Prog. Theor. Biol., 3, 261–345.
| Models | Units | Reference | |||||
|---|---|---|---|---|---|---|---|
| Marine Coprophagy (oyster) | kcal m-2 yr-1 | 4 | 0.25 | 379 | 549 | 0.12 | [10] |
| Lake Findley | gC m-2 yr-1 | 4 | 0.38 | 21 | 50 | 0.30 | [20] |
| Mirror Lake | gC m-2 yr-1 | 5 | 0.36 | 72 | 217 | 0.32 | [20] |
| Lake Wingra | gC m-2 yr-1 | 5 | 0.40 | 478 | 1,517 | 0.40 | [20] |
| Marion Lake | gC m-2 yr-1 | 5 | 0.36 | 87 | 242 | 0.31 | [20] |
| Cone Springs | kcal m-2 yr-1 | 5 | 0.32 | 11,819 | 30,626 | 0.09 | [24] |
| Silver Springs | kcal m-2 yr-1 | 5 | 0.28 | 21,296 | 29,175 | 0.00 | [16] |
| English Channel | kcal m-2 yr-1 | 6 | 0.25 | 1,096 | 2,280 | 0.00 | [8] |
| Oyster Reef | kcal m-2 yr-1 | 6 | 0.33 | 41 | 83 | 0.11 | [9] |
| Baie de Somme | mgC m-2 d-1 | 9 | 0.30 | 876 | 2,034 | 0.14 | [21] |
| Bothnian Bay | gC m-2 yr-1 | 12 | 0.22 | 44 | 183 | 0.23 | [22] |
| Bothnian Sea | gC m-2 yr-1 | 12 | 0.24 | 117 | 562 | 0.31 | [22] |
| Ythan Estuary | gC m-2 yr-1 | 13 | 0.23 | 1,258 | 4,181 | 0.24 | [6] |
| Sundarban Mangrove (virgin) | kcal m-2 yr-1 | 14 | 0.22 | 117,959 | 441,214 | 0.16 | [19] |
| Sundarban Mangrove (reclaimed) | kcal m-2 yr-1 | 14 | 0.22 | 38,484 | 103,056 | 0.05 | [19] |
| Baltic Sea | mg C m-2 d-1 | 15 | 0.17 | 603 | 1,973 | 0.13 | [5] |
| Ems Estuary | mg C m-2 d-1 | 15 | 0.19 | 282 | 1,067 | 0.32 | [5] |
| Southern Benguela Upwelling | mg C m-2 d-1 | 16 | 0.23 | 714 | 2,545 | 0.31 | [5] |
| Peruvian Upwelling | mg C m-2 d-1 | 16 | 0.22 | 14,927 | 33,491 | 0.04 | [5] |
| Crystal River (control) | mg C m-2 d-1 | 21 | 0.19 | 7,357 | 15,062 | 0.07 | [25] |
| Crystal River (thermal) | mg C m-2 d-1 | 21 | 0.14 | 6,018 | 12,032 | 0.09 | [25] |
| Charca de Maspalomas Lagoon | mg C m-2 d-1 | 21 | 0.12 | 1,486,230 | 6,010,331 | 0.18 | [1] |
| Northern Benguela Upwelling | mg C m-2 d-1 | 24 | 0.21 | 2,281 | 6,608 | 0.05 | [11] |
| Swartkops Estuary | mg C m-2 d-1 | 25 | 0.17 | 2,859 | 8,949 | 0.27 | [23] |
| Sunday Estuary | mg C m-2 d-1 | 25 | 0.16 | 4,441 | 11,939 | 0.22 | [23] |
| Kromme Estuary | mg C m-2 d-1 | 25 | 0.16 | 2,571 | 11,087 | 0.38 | [23] |
| Okefenokee Swamp | g dw m-2 y-1 | 26 | 0.20 | 2,533 | 12,855 | 0.48 | [30] |
| Neuse Estuary (early summer 1997) | mg C m-2 d-1 | 30 | 0.09 | 4,385 | 13,827 | 0.12 | [3] |
| Neuse Estuary (late summer 1997) | mg C m-2 d-1 | 30 | 0.11 | 4,639 | 13,035 | 0.13 | [3] |
| Neuse Estuary (early summer 1998) | mg C m-2 d-1 | 30 | 0.09 | 4,568 | 14,025 | 0.12 | [3] |
| Neuse Estuary (late summer 1998) | mg C m-2 d-1 | 30 | 0.10 | 5,641 | 15,031 | 0.11 | [3] |
| Gulf of Maine | g ww m-2 yr-1 | 31 | 0.35 | 5,053 | 18,381 | 0.15 | [12] |
| Georges Bank | g ww m-2 yr-1 | 31 | 0.35 | 4,380 | 16,889 | 0.18 | [12] |
| Middle Atlantic Bight | g ww m-2 yr-1 | 32 | 0.37 | 4,869 | 17,916 | 0.18 | [12] |
| Narragansett Bay | mgC m-2 yr-1 | 32 | 0.15 | 693,845 | 3,917,246 | 0.51 | [15] |
| Southern New England Bight | g ww m-2 yr-1 | 33 | 0.35 | 4,717 | 17,597 | 0.16 | [12] |
| Chesapeake Bay | mg C m-2 yr-1 | 36 | 0.09 | 888,791 | 3,227,453 | 0.19 | [7] |
| Mondego Estuary (Zostera sp. Meadows) | g AFDW m-2 yr-1 | 43 | 0.19 | 4,030 | 6,822 | 0.03 | [18, 17] |
| St. Marks Seagrass, site 1 (Jan.) | mg C m-2 d-1 | 51 | 0.08 | 514 | 1,315 | 0.13 | [4] |
| St. Marks Seagrass, site 1 (Feb.) | mg C m-2 d-1 | 51 | 0.08 | 601 | 1,590 | 0.11 | [4] |
| St. Marks Seagrass, site 2 (Jan.) | mg C m-2 d-1 | 51 | 0.07 | 602 | 1,383 | 0.09 | [4] |
| St. Marks Seagrass, site 2 (Feb.) | mg C m-2 d-1 | 51 | 0.08 | 800 | 1,921 | 0.08 | [4] |
| St. Marks Seagrass, site 3 (Jan.) | mg C m-2 d-1 | 51 | 0.05 | 7,809 | 12,651 | 0.01 | [4] |
| St. Marks Seagrass, site 4 (Feb.) | mg C m-2 d-1 | 51 | 0.08 | 1,432 | 2,865 | 0.04 | [4] |
| Sylt-Rømø Bight | mg C m-2 d-1 | 59 | 0.08 | 683,448 | 1,781,028 | 0.09 | [2] |
| Graminoids (wet) | g C m-2 yr-1 | 66 | 0.18 | 6,272 | 13,676 | 0.02 | [29] |
| Graminoids (dry) | g C m-2 yr-1 | 66 | 0.18 | 3,472 | 7,519 | 0.04 | [29] |
| Cypress (wet) | g C m-2 yr-1 | 68 | 0.12 | 1,418 | 2,571 | 0.04 | [26] |
| Cypress (dry) | g C m-2 yr-1 | 68 | 0.12 | 1,035 | 1,919 | 0.04 | [26] |
| Lake Oneida (pre-ZM) | g C m-2 yr-1 | 74 | 0.22 | 1,034 | 1,697 | 0.00 | [13] |
| Lake Oneida (post-ZM) | g C m-2 yr-1 | 76 | 0.22 | 810 | 1,462 | 0.00 | [13] |
| Bay of Quinte (pre-ZM) | g C m-2 yr-1 | 74 | 0.21 | 989 | 1,517 | 0.00 | [14] |
| Bay of Quinte (post-ZM) | g C m-2 yr-1 | 80 | 0.21 | 1,163 | 2,107 | 0.01 | [14] |
| Mangroves (wet) | g C m-2 yr-1 | 94 | 0.15 | 1,531 | 3,265 | 0.10 | [28] |
| Mangroves (dry) | g C m-2 yr-1 | 94 | 0.15 | 1,531 | 3,272 | 0.10 | [28] |
| Florida Bay (wet) | mg C m-2 yr-1 | 125 | 0.12 | 738 | 2,720 | 0.14 | [27] |
| Florida Bay (dry) | mg C m-2 yr-1 | 125 | 0.13 | 547 | 1,778 | 0.08 | [27] |
References
- [1] Almunia, J., Basterretxea, G., Aistegui, J. & Ulanowicz, R. E. (1999) Benthic–pelagic switching in a coastal subtropical lagoon. Estuar. Coast. Shelf Sci., 49, 221–232.
- [2] Baird, D., Asmus, H. & Asmus, R. (2004a) Energy flow of a boreal intertidal ecosystem, the Sylt-Rømø Bight. Mar. Ecol. Prog. Ser., 279, 45–61.
- [3] Baird, D., Christian, R. R., Peterson, C. H. & Johnson, G. A. (2004b) Consequences of hypoxia on estuarine ecosystem function: Energy diversion from consumers to microbes. Ecol. Appl., 14, 805–822.
- [4] Baird, D., Luczkovich, J. & Christian, R. R. (1998) Assessment of spatial and temporal variability in ecosystem attributes of the St Marks National Wildlife Refuge, Apalachee Bay, Florida. Estuar. Coast. Shelf Sci., 47, 329–349.
- [5] Baird, D., McGlade, J. M. & Ulanowicz, R. E. (1991) The comparative ecology of six marine ecosystems. Philos. Trans. R. Soc. Lond. B, 333, 15–29.
- [6] Baird, D. & Milne, H. (1981) Energy flow in the Ythan Estuary, Aberdeenshire, Scotland. Estuar. Coast. Shelf Sci., 13, 455–472.
- [7] Baird, D. & Ulanowicz, R. E. (1989) The seasonal dynamics of the Chesapeake Bay ecosystem. Ecol. Monogr., 59, 329–364.
- [8] Brylinsky, M. (1972) Steady-state sensitivity analysis of energy flow in a marine ecosystem. In Patten, B. C., editor, Systems analysis and simulation in ecology, volume 2, pages 81–101. Academic Press.
- [9] Dame, R. F. & Patten, B. C. (1981) Analysis of energy flows in an intertidal oyster reef. Mar. Ecol. Prog. Ser., 5, 115–124.
- [10] Haven, D. S. & Morales-Alamo, R. (1966) Aspects of biodeposition by oysters and other invertebrate filter feeders. Limnol. Oceanogr., 11, 487–498.
- [11] Heymans, J. J. & Baird, D. (2000) A carbon flow model and network analysis of the northern Benguela upwelling system, Namibia. Ecol. Model., 126, 9–32.
- [12] Link, J., Overholtz, W., O’Reilly, J., Green, J., Dow, D., Palka, D., Legault, C., Vitaliano, J., Guida, V., Fogarty, M., Brodziak, J., Methratta, L., Stockhausen, W., Col, L. & Griswold, C. (2008) The Northeast US continental shelf Energy Modeling and Analysis exercise (EMAX): Ecological network model development and basic ecosystem metrics. J. Mar. Syst., 74, 453–474.
- [13] Miehls, A. L. J., Mason, D. M., Frank, K. A., Krause, A. E., Peacor, S. D. & Taylor, W. W. (2009a) Invasive species impacts on ecosystem structure and function: A comparison of Oneida Lake, New York, USA, before and after zebra mussel invasion. Ecol. Model., 220(22), 3194–3209.
- [14] Miehls, A. L. J., Mason, D. M., Frank, K. A., Krause, A. E., Peacor, S. D. & Taylor, W. W. (2009b) Invasive species impacts on ecosystem structure and function: A comparison of the Bay of Quinte, Canada, and Oneida Lake, USA, before and after zebra mussel invasion. Ecol. Model., 220, 3182–3193.
- [15] Monaco, M. E. & Ulanowicz, R. E. (1997) Comparative ecosystem trophic structure of three US mid-Atlantic estuaries. Mar. Ecol. Prog. Ser., 161, 239–254.
- [16] Odum, H. T. (1957) Trophic structure and productivity of Silver Springs, Florida. Ecol. Monogr., 27, 55–112.
- [17] Patrício, J. & Marques, J. C. (2006) Mass balanced models of the food web in three areas along a gradient of eutrophication symptoms in the south arm of the Mondego estuary (Portugal). Ecol. Model., 197(1), 21–34.
- [18] Patricio, J., Ulanowicz, R., Pardal, M. A. & Marques, J. C. (2004) Ascendency as an ecological indicator: a case study of estuarine pulse eutrophication. Estuar. Coast. Shelf Sci., 60, 23–35.
- [19] Ray, S. (2008) Comparative study of virgin and reclaimed islands of Sundarban mangrove ecosystem through network analysis. Ecol. Model., 215, 207–216.
- [20] Richey, J. E., Wissmar, R. C., Devol, A. H., Likens, G. E., Eaton, J. S., Wetzel, R. G., Odum, W. E., Johnson, N. M., Loucks, O. L., Prentki, R. T. & Rich, P. H. (1978) Carbon flow in four lake ecosystems: A structural approach. Science, 202, 1183–1186.
- [21] Rybarczyk, H., Elkaim, B., Ochs, L. & Loquet, N. (2003) Analysis of the trophic network of a macrotidal ecosystem: the Bay of Somme (Eastern Channel). Estuar. Coast. Shelf Sci., 58, 405–421.
- [22] Sandberg, J., Elmgren, R. & Wulff, F. (2000) Carbon flows in Baltic Sea food webs — a re-evaluation using a mass balance approach. J. Mar. Syst., 25, 249–260.
- [23] Scharler, U. M. & Baird, D. (2005) A comparison of selected ecosystem attributes of three South African estuaries with different freshwater inflow regimes, using network analysis. J. Mar. Syst., 56, 283–308.
- [24] Tilly, L. J. (1968) The structure and dynamics of Cone Spring. Ecol. Monogr., 38, 169–197.
- [25] Ulanowicz, R. E. (1986) Growth and Development: Ecosystems Phenomenology. Springer–Verlag, New York.
- [26] Ulanowicz, R. E., Bondavalli, C. & Egnotovich, M. S. (1997) Network Analysis of Trophic Dynamics in South Florida Ecosystem, FY 96: The Cypress Wetland Ecosystem. Annual Report to the United States Geological Service Biological Resources Division Ref. No. [UMCES]CBL 97-075, Chesapeake Biological Laboratory, University of Maryland.
- [27] Ulanowicz, R. E., Bondavalli, C. & Egnotovich, M. S. (1998) Network Analysis of Trophic Dynamics in South Florida Ecosystem, FY 97: The Florida Bay Ecosystem. Annual Report to the United States Geological Service Biological Resources Division Ref. No. [UMCES]CBL 98-123, Chesapeake Biological Laboratory, University of Maryland.
- [28] Ulanowicz, R. E., Bondavalli, C., Heymans, J. J. & Egnotovich, M. S. (1999) Network Analysis of Trophic Dynamics in South Florida Ecosystem, FY 98: The Mangrove Ecosystem. Annual Report to the United States Geological Service Biological Resources Division Ref. No.[UMCES] CBL 99-0073; Technical Report Series No. TS-191-99, Chesapeake Biological Laboratory, University of Maryland.
- [29] Ulanowicz, R. E., Bondavalli, C., Heymans, J. J. & Egnotovich, M. S. (2000) Network Analysis of Trophic Dynamics in South Florida Ecosystem, FY 99: The Graminoid Ecosystem. Annual Report to the United States Geological Service Biological Resources Division Ref. No. [UMCES] CBL 00-0176, Chesapeake Biological Laboratory, University of Maryland.
- [30] Whipple, S. J. & Patten, B. C. (1993) The problem of nontrophic processes in trophic ecology: Toward a network unfolding solution. J. Theor. Biol., 163, 393–411.