Adiabatic Mass Loss in Binary Stars. II. From Zero-Age Main Sequence to the Base of the Giant Branch
Abstract
In the limit of extremely rapid mass transfer, the response of a donor star in an interacting binary becomes asymptotically one of adiabatic expansion. We survey here adiabatic mass loss from Population I stars () of mass to from the zero age main sequence to the base of the giant branch, or to central hydrogen exhaustion for lower main sequence stars. The logarithmic derivatives of radius with respect to mass along adiabatic mass loss sequences translate into critical mass ratios for runaway (dynamical time scale) mass transfer, evaluated here under the assumption of conservative mass transfer. For intermediate- and high-mass stars, dynamical mass transfer is preceded by an extended phase of thermal time scale mass transfer as the star is stripped of most of its envelope mass. The critical mass ratio 111Throughout this paper, we follow the convention of defining the binary mass ratio as . above which this delayed dynamical instability occurs increases with advancing evolutionary age of the donor star, by ever-increasing factors for more massive donors. Most intermediate- or high-mass binaries with nondegenerate accretors probably evolve into contact before manifesting this instability. As they approach the base of the giant branch, however, and begin developing a convective envelope, plummets dramatically among intermediate-mass stars, to values of order unity, and a prompt dynamical instability occurs. Among low-mass stars, the prompt instability prevails throughout main sequence evolution, with declining with decreasing mass, and asymptotically approaching , appropriate to a classical isentropic polytrope. Our calculated agree well with the behavior of time-dependent models by Chen & Han (2003) of intermediate-mass stars initiating mass transfer in the Hertzsprung gap. Application of our results to cataclysmic variables, as systems which must be stable against rapid mass transfer, nicely circumscribes the range in as a function of orbital period in which they are found. These results are intended to advance the verisimilitude of population synthesis models of close binary evolution.
1 Introduction
Mass transfer is the defining characteristic distinguishing the evolution of close binary stars from that of isolated single stars. That mass transfer is typically triggered by the evolutionary expansion of one of the binary components, but the rate at which mass transfer proceeds depends on the interplay between the structural response of the donor star to mass loss and the dynamical response of the binary orbit (and with it, the tidal limit or Roche lobe of the donor star). If the donor star can remain lobe-filling only by virtue of its evolutionary expansion and/or orbital decay through angular momentum loss, then the donor star remains in thermal equilibrium, and mass transfer proceeds on that evolutionary expansion/angular momentum loss time scale. Examples of interacting binaries in this state of slow mass transfer include classical Algol-type binaries and (most) cataclysmic variables and low-mass X-ray binaries. However, it is often the case that the donor star’s Roche lobe does not expand as rapidly in response to mass loss as would the donor star itself, if that star were to remain in thermal equilibrium. In this case, the donor will be driven out of thermal equilibrium. Depending on the thermal structure of the donor’s envelope, that divergence from thermal equilibrium may prevent the donor from expanding far beyond its Roche lobe. The mass transfer rate is then governed by relaxation of the donor toward thermal equilibrium, i.e., it proceeds on a thermal time scale. Examples of systems in thermal time scale mass transfer are relatively rare because of their short lifetimes in mass transfer, but they may include such strongly interacting binaries as W Serpentis stars (Plavec, 1980) and, most prominently, supersoft X-ray sources (van den Heuvel et al., 1992; Kahabka & van den Heuvel, 1997). In other circumstances, however, thermal relaxation cannot contain expansion of the donor far beyond its Roche lobe. The mass transfer rate grows inexorably, limited only by hydrodynamical expansion of the donor envelope through the opening of the Roche potential at the inner Lagrangian point (Paczyński & Sienkiewicz, 1972; Savonije, 1978; Eggleton, 2006), and can in principle approach the mass of the donor star divided by the orbital period. The prospect of dissipating an appreciable fraction of the donor star’s binding energy on such a short time scale has led to the suggestion that intermediate-luminosity transient sources (cf. Kasliwal, 2012) are triggered by such dynamical mergers (Munari et al., 2002; Soker & Tylenda, 2006; Kulkarni et al., 2002).
As discussed at some length by Ge et al. (2010a, hereafter Paper I), and outlined above, the threshold conditions for dynamical time scale mass transfer depend on the response of the donor star to mass loss, and on the dynamical response of the orbit and donor Roche lobe to mass transfer, systemic mass loss and orbital angular momentum loss. Our focus in the present paper is to build model sequences in which a donor star’s specific entropy profile and composition profile are held fixed during mass loss. These adiabatic model sequences describe the asymptotic response of donor stars to mass loss in the limit that the time scales involved are so rapid that thermal relaxation of the donor can be ignored, but not so rapid that the donor departs in bulk from hydrostatic equilibrium. At their simplest, previous adiabatic mass loss models assumed simple polytropic models or variants upon them (Hjellming & Webbink, 1987), or assumed locally polytropic equations of state (Dai et al., 2013). Realistic models with sophisticated equations of state have been studied by Hjellming (1989a, b); Ge et al. (2010a, b), and Deloye & Taam (2010), as computing resources have grown more powerful. We employ here a fully realistic equation of state, as described in Paper I, albeit retaining the simplification of one-dimensional models.
In this paper, we apply the construction of adiabatic mass-loss sequences, as described in Paper I, to determining the criteria for dynamical instability in binaries with a radiative donor stars (on the main-sequence or in the Hertzsprung gap) or with low-mass main-sequence donors. Stars with deep convective envelopes, that is, those in later evolutionary phases (giant branch and asymptotic giant branch), respond very differently to mass loss, and present additional issues regarding the interpretation of our adiabatic mass loss calculations. We defer discussion of these later evolutionary phases to the next installment in this series of papers. The present paper is organized as follows. Section 2 introduces the construction of a mass-radius diagram, which provides a useful graphical context in which we can summarize our results in an immediately-accessible form. Section 3 summarizes the distribution in mass and evolutionary stage (radius) of models chosen to span that diagram. In Section 4 we identify the physical processes that govern the responses of radiative stars to rapid mass loss in binary systems, and the relationship between prompt and delayed dynamical instabilities of the donor stars. Section 5 presents the results of our survey in both tabular and graphical form, interpreted in terms of threshold mass ratios assuming conservative mass transfer. In Section 6 we show that the threshold mass ratios deduced from our adiabatic mass-loss sequences are qualitatively and quantitatively consistent with relevant time-dependent mass-loss studies. An example of the application of these thresholds to real binary systems, the cataclysmic variables, follows in Section 7. We close (Section 8) with a brief summary of results, and a discussion of their limitations.
2 The Mass-Radius Diagram
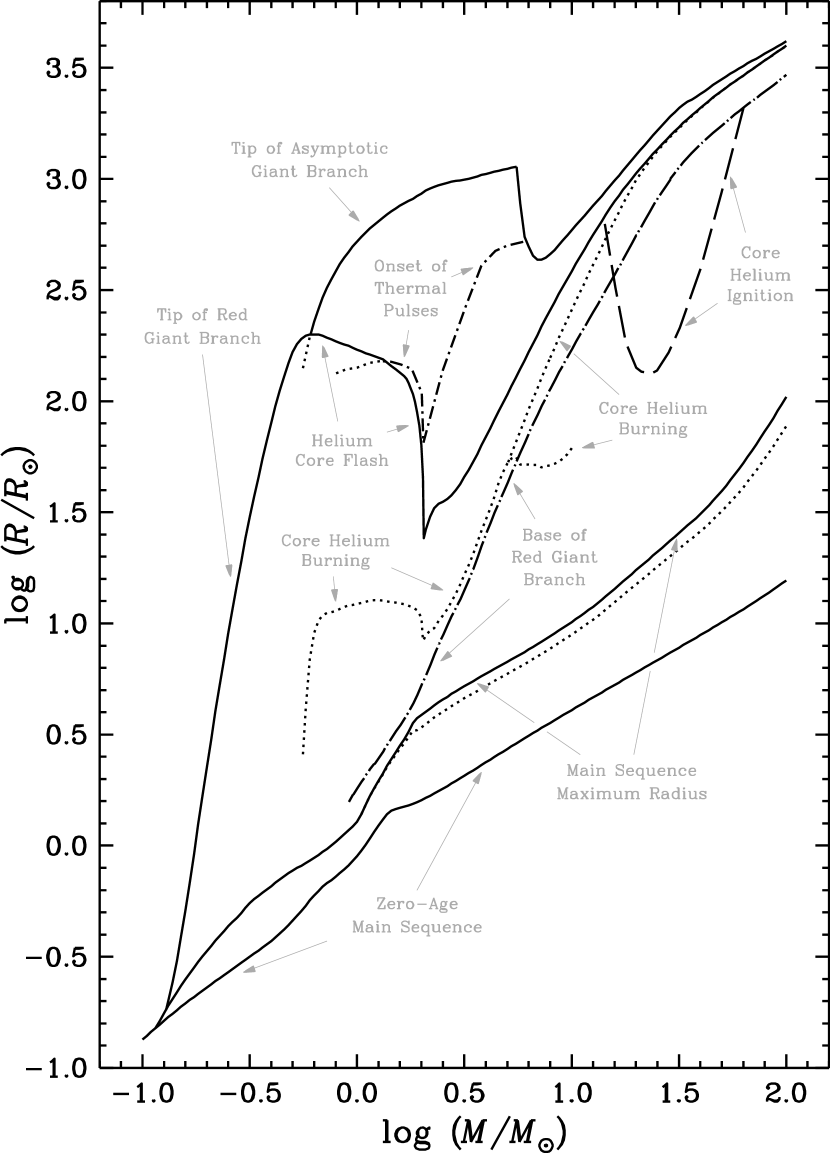
An efficient vehicle for discussions of interacting binary evolution is the mass-radius diagram, illustrating the radii of stars at critical phases of their evolution. Given a companion mass and orbital separation, this diagram enables one to ascertain immediately the evolutionary stage of the donor star when it fills its Roche lobe. Furthermore, given some distribution of donor stars in mass and orbital separation (as proxy for Roche lobe radius), we can see immediately which evolutionary channels are most frequently populated.


As an example of the construction of this diagram, consider the evolution of a star. Its evolution in the theoretical Hertzsprung-Russell diagram is shown in Fig. 1. The position of a star in that diagram immediately fixes its radius, via the blackbody law. The point in its evolution at which such a star begins tidal mass transfer then occurs when it first fills its Roche lobe (). In the context of close binary evolution, then, the evolution of the donor star radius with time acquires special significance, as shown in Fig. 2. In the context of our example, we see that if it first fills its Roche lobe during core hydrogen burning, while still on the main sequence. If , it does so as it crosses the Hertzsprung gap, or during its initial ascent of the giant branch, prior to core helium burning; and if during ascent of the asymptotic giant branch. But whenever an evolving star spontaneously contracts, it cannot ordinarily initiate mass transfer, as it will have done so during a prior phase of evolution.222Exceptions can occur, for example, through encounters with field stars, or orbital variations driven by a more distant companion in a triple system (Kozai, 1962). For this reason, our survey of adiabatic responses encompasses all phases of evolutionary expansion, including those shadowed by prior evolution. In the example at hand, the star will not fill its Roche lobe during its momentary contraction at the terminal main sequence, or during core helium burning until it reaches a radius on the asymptotic giant branch equal to its prior radius at helium ignition. We refer to these excluded phases of contraction as shadowed by one or more prior phases of evolution. Identifying critical radii of stars in similar fashion throughout our library of evolutionary models, we can construct a diagram of these critical radii as a function of mass (Fig. 3).
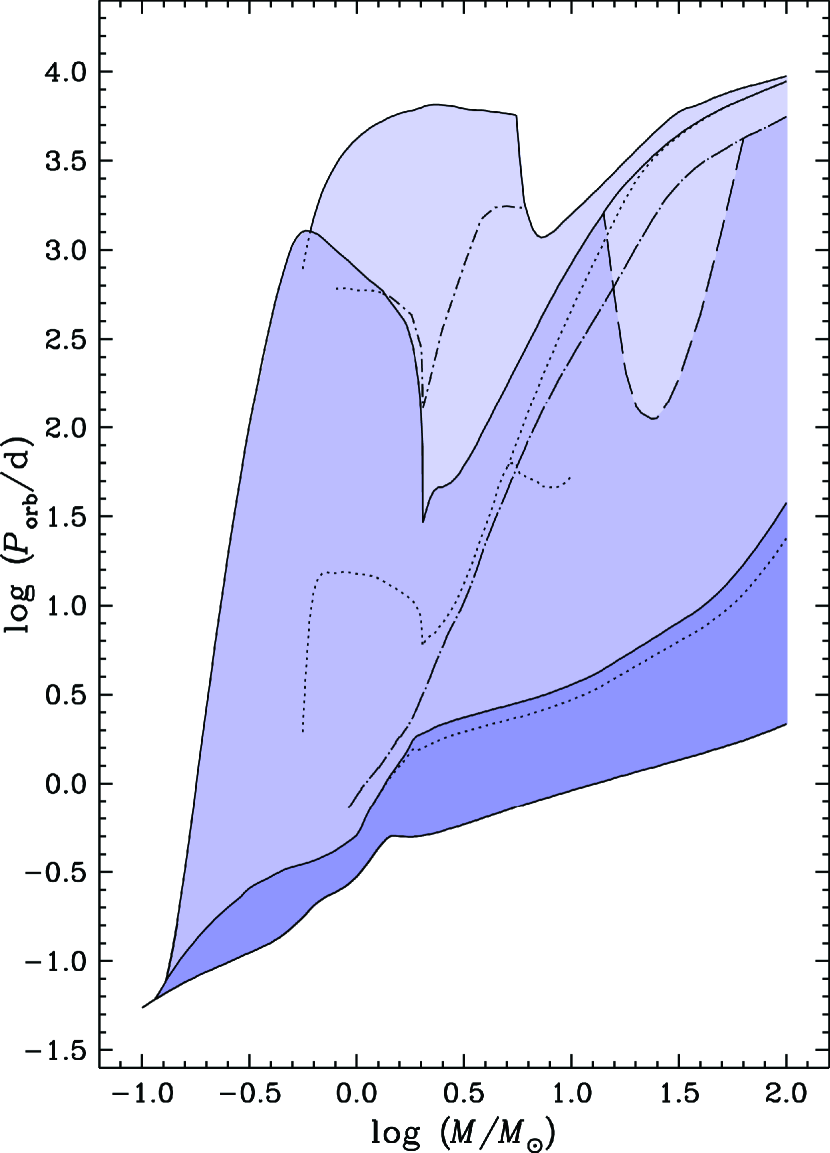
The mass-radius diagram is directly related to a mass-orbital period diagram (Fig. 4), useful in identifying which mass transfer channels observed binaries may follow. Using the Eggleton (1983) approximation for the dimensionless Roche lobe radius, , with the orbital separation, we have
where is a very weak function of , the ratio of donor to accretor mass:
(, by construction). Thus, the orbital period of a binary with donor mass fixes (to within a weak function of the mass ratio) the radius of that prospective donor at which it fills its Roche lobe ().
3 Model Selection
The evolutionary code employed for this study was based on the stellar evolution code developed by Eggleton (1971, 1972, 1973) and Paxton (2004). It is a one-dimensional (spherically symmetric) non-Lagrangian code, and includes a treatment of convective overshooting as described by Schroder et al. (1997) with overshooting parameter . A more detailed account of the physics it incorporates can be found in Section 2.2 of Paper I.

The initial models for the mass loss sequences reported in this series of papers were selected from a library of stellar evolution sequences of nominal Population I metallicity (), spanning the full range of normal stellar masses (see Fig. 5). We assume evolution at constant mass up to the onset of tidal mass transfer, as this establishes a definitive reference point in the absence of an a priori physical theory to quantify mass loss. (Otherwise, one needs to introduce an empirical mass-loss prescription that invariably involves introducing additional, empirical, model parameters.) This assumption is clearly inappropriate to the most massive and most luminous stars considered here, but to the extent that these stars are roughly in thermal equilibrium as they reach their Roche lobes, their response to mass loss depends only on their instantaneous mass and composition profile, without regard to prior mass loss history. Our mass loss models should therefore capture the most important physical processes at play.
Altogether, 42 evolutionary sequences formed the basis of this study. They were selected at intervals of over the range , with additional models at intervals of in the interval , and one additional sequence at marking the transition from degenerate to non-degenerate helium ignition. Models consisted of 199 to 1299 mesh points, depending on the complexity of their structure at advanced phases of evolution, with typically of order models in each evolutionary sequence.
For each of these evolutionary sequences, initial models for adiabatic mass loss sequences were selected to coincide with evolutionary extrema in radius, starting from the zero-age main sequence. Additional mass loss sequences were constructed at intervals of during all phases of evolutionary expansion, including those shadowed by prior evolution (as these might still be relevant in dense stellar environments or in multiple star systems). The main sequence, up to central hydrogen exhaustion, was sampled at intervals in central hydrogen abundance. All told, our library numbers 1670 adiabatic mass loss sequences (Fig. 6), typically of order models per mass loss sequence. Of these sequences, 680 fall within the scope of this paper (evolution to the base of the giant branch), with the balance to be presented in the next installment.

In this paper, we present results for a subset of these model sequences, covering evolutionary phases from zero-age main sequence, through central hydrogen exhaustion, up to arrival at the base of the giant branch, which we take to coincide with the luminosity minimum seen in the evolutionary tracks of intermediate-mass and massive stars (see Fig. 5). This luminosity minimum does not exist for low-mass stars; we include only up through central hydrogen exhaustion for these low-mass stars. Tables 1 and 2 document the initial properties of the donor stars at the beginning of each mass-loss sequence.
| yr | K | |||||||||
|---|---|---|---|---|---|---|---|---|---|---|
| 1 | 2.232372E+04 | 0.0000 | 1.2380 | 0.0000 | –4.227 | 1.277 | 7.423 | 0.700 | 0.280 | 0.700 |
| 2 | 2.589656E+07 | 0.0000 | 1.5601 | 0.0000 | –4.340 | 1.265 | 7.430 | 0.602 | 0.379 | 0.700 |
| 3 | 4.490234E+07 | 0.0000 | 1.4860 | 0.0000 | –4.436 | 1.262 | 7.439 | 0.509 | 0.472 | 0.700 |
| 4 | 6.151553E+07 | 0.0000 | 1.4051 | 0.0000 | –4.533 | 1.268 | 7.450 | 0.405 | 0.576 | 0.700 |
| 5 | 7.390986E+07 | 0.0000 | 1.3283 | 0.0000 | –4.614 | 1.283 | 7.462 | 0.305 | 0.676 | 0.700 |
| 6 | 8.414729E+07 | 0.0000 | 1.2465 | 0.0000 | –4.683 | 1.314 | 7.478 | 0.197 | 0.783 | 0.700 |
| 7 | 9.095053E+07 | 0.0000 | 1.1770 | 0.0000 | –4.714 | 1.366 | 7.498 | 0.106 | 0.875 | 0.700 |
| 8 | 9.572705E+07 | 0.0000 | 1.1155 | 0.0000 | –4.656 | 1.486 | 7.539 | 0.023 | 0.957 | 0.700 |
| 9 | 9.680205E+07 | 0.0000 | 1.0988 | 0.0000 | –4.260 | 1.800 | 7.627 | 0.000 | 0.980 | 0.700 |
Note. — Table 1 is published in its entirety in the electronic edition of the Astrophysical Journal. A portion is shown here for guidance regarding its form and content.
Table 1 is arranged in segments, by stellar mass, . Successive columns list:
-
(1)
— mass loss sequence number;
-
(2)
— age (yr);
-
(3)
— mass of the convective envelope ();
-
(4)
— core mass ();
-
(5)
— inner core mass ();
-
(6)
— central electron chemical potential (, in units of );
-
(7)
— central density ();
-
(8)
— central temperature (K);
-
(9)
— central hydrogen abundance (fraction by mass);
-
(10)
— central helium abundance (fraction by mass); and
-
(11)
— surface hydrogen abundance (fraction by mass)
Age is measured from the zero-age main sequence model (excluding pre-main-sequence evolution). The mass of the convective envelope refers to the mass depth of the base of the outermost convection zone. The core mass refers to the mass coordinate at which the helium abundance is halfway between the surface helium abundance and the maximum helium abundance in the stellar interior. The inner core mass identifies the mass coordinate at which the helium abundance is halfway between the maximum helium abundance in the stellar interior and the minimum helium abundance interior to that maximum; in the absence of measurable helium depletion in the hydrogen-exhaused core, is set to a default value of zero. and characterize the range in mass over which hydrogen and helium are being depleted during their respective core burning phases, and not the amount of mass that has been consumed. Upon core fuel exhaustion, and mark the midpoints in hydrogen and helium depletion profiles, respectively. The dimensionless central electron chemical potential measures the degree of electron degeneracy ().
| K | |||||||||
|---|---|---|---|---|---|---|---|---|---|
| 1 | 0.4342 | 4.2276 | 2.7323 | 2.786 | –23.170 | –5.182* | 0.443* | 0.0606 | |
| 2 | 0.4819 | 4.2201 | 2.7975 | 2.849 | –22.757 | –5.130* | –0.767* | 0.0551 | |
| 3 | 0.5288 | 4.2111 | 2.8552 | 2.906 | –22.361 | –5.079* | –0.955* | 0.0502 | |
| 4 | 0.5854 | 4.1976 | 2.9144 | 2.965 | –21.900 | –5.023* | –1.159* | 0.0451 | |
| 5 | 0.6452 | 4.1804 | 2.9652 | 3.016 | –21.417 | –4.970* | –1.184* | 0.0407 | |
| 6 | 0.7165 | 4.1565 | 3.0124 | 3.062 | –20.807 | –4.905* | –1.009* | 0.0363 | |
| 7 | 0.7828 | 4.1321 | 3.0471 | 3.096 | –20.077 | –4.821* | –0.823 | 0.0330 | |
| 8 | 0.8270 | 4.1190 | 3.0832 | 3.130 | –18.596 | –4.606* | 0.515 | 0.0304 | |
| 9 | 0.7685 | 4.1662 | 3.1551 | 3.134 | –15.512 | –4.046* | 2.225 | 0.0296 | |
Note. — Table 2 is published in its entirety in the electronic edition of the Astrophysical Journal. A portion is shown here for guidance regarding its form and content.
Like Table 1, Table 2 is arranged in segments, by stellar mass, . Successive columns list:
-
(1)
— mass loss sequence number;
-
(2)
— radius ();
-
(3)
— effective temperature (K);
-
(4)
— stellar luminosity ();
-
(5)
— hydrogen-burning luminosity ();
-
(6)
— helium-burning luminosity ();
-
(7)
— heavy-element (carbon-, oxygen-, etc.) burning luminosity ();
-
(8)
— log neutrino luminosity (, with asterisk, *, appended to signify that this is a negative contribution to the net stellar luminosity);
-
(9)
— gravothermal luminosity (, with asterisk, *, appended where the gravothermal luminosity is negative); and
-
(10)
— dimensionless moment of inertia
4 Adiabatic Mass Loss
4.1 Mass Outflow Near
The mass transfer rate in a binary system is determined by fluid flow through the region around the inner Lagrangian point, , where Roche potentials open to the companion star. Far from the inner Lagrangian point, the donor star departs negligibly from hydrostatic equilibrium, as shown by Paczyński & Sienkiewicz (1972) and Eggleton (2006), so long as the radial excess beyond its Roche lobe is small. This allows us to adopt a semi-physical 1D model (described in the Appendix to Paper I) relating the mass loss rate from the donor star in question to the structure of its envelope beyond the inner critical surface far from the inner Lagrangian point. In reality, this is at best a rough approximation. It assumes laminar flow along equipotential surfaces, with the specific enthalpy of the flow along any streamline described in terms of the pressure, density, and adiabatic exponents at the source of that streamline. Real streamlines will inevitably be broken up by turbulence and Coriolis effects (which impede mass loss), and readily cross equipotential surfaces. In radiative envelopes, stable density stratification (negative buoyancy) inhibits upwelling from the stellar interior, so mass flow toward the inner Lagrangian region can be expected to be dominated by surface flows. In contrast, mass loss from convectively unstable envelopes can be expected to be dominated by upwelling along the line of centers, and may exceed our 1D estimates by some unknown factor.
It follows from the preceding discussion that the onset of dynamical time scale mass transfer cannot be instantaneous, but accelerates from an initial trickle to full-blown dynamical instability as it surpasses the stellar thermal time scale rate, i.e., as the flow asymptotically becomes adiabatic. Accordingly, we define the onset of dynamical time scale mass transfer not from the instant a donor star fills its Roche lobe, but rather from the instant at which the Roche lobe penetrates deeply enough into the stellar envelope to drive thermal time scale mass transfer. A detailed account of this formalism may be found in Paper I. We calculate the critical mass ratio for dynamical instability as the limiting mass ratio for which the adiabatic mass loss sequence just reaches thermal time scale mass transfer.
Note that this estimate assumes that we can reasonably approximate the structure of the donor star envelope beyond its Roche lobe using adiabatic mass loss models. In reality, the outer envelope of a star relaxes to thermal equilibrium much faster than does the star as a whole. For stars with radiative envelopes, this thermal relaxation is characterized by absorption of energy from the radiation field, so the overflow layers will have higher specific entropy than modeled by pure adiabatic expansion. We should therefore expect that radiative stars drive higher mass transfer rates than our adiabatic mass loss models predict, and therefore a shallower degree of overflow is needed to drive thermal time scale mass loss. Accordingly, our critical mass ratios for radiative stars are likely systematically overestimated. That is, thermal relaxation within a radiative envelope tends to make a star more unstable against rapid mass transfer. However, because specific entropy varies extremely rapidly with mass in the outer envelopes of radiative stars, we expect this effect to be small, as evidenced in Section 6 below.
In contrast, thermal relaxation in the outer envelopes of convective stars tends to depress specific entropy near the surface; energy may be lost to the radiation field of the star, whence it is radiated from the stellar photosphere. We see the result in the rapid superadiabatic expansion of the surface layers in adiabatic mass loss sequences calculated using standard mixing-length models for initial models. At face value, this excessive expansion would suggest that our algorithm for finding the critical mass ratio for dynamical time scale mass transfer exaggerates the tendency toward runaway mass transfer, and so underestimates the critical mass ratio.
As emphasized by Woods & Ivanova (2011), for example, thermal relaxation within the superadiabatic outer layers of a surface convection zone is extremely rapid, even for dynamical outflow rates. To a first approximation, the entropy profile of that superadiabatic region migrates homologously inward in step with mass loss, as can be seen in Figure 2 of Woods & Ivanova (2011). Clearly, our adiabatic mass loss sequences suppress this thermal relaxation, but we can mimic it for purposes of evaluating critical mass ratios by constructing artificial mass loss sequences in which the outer convection zone is replaced by a completely isentropic envelope, with specific entropy fixed at the base of that convection zone. The construction of these artificially isentropic envelope models is described in more detail in Paper I, where they were termed pseudo-models. Their initial radii, are inflated with respect to more realistic (mixing-length) models (of radii ); we characterize the degree of inflation by the parameter . Our premise, then, in constructing artificially isentropic envelope mass loss sequences is that their outer entropy profiles migrate homologously inward with mass loss, as do the profiles of realistic models with thermal relaxation, and so the artificial sequence closely parallels a time-dependent sequence, but with nominal radii inflated by a factor . We therefore consider the threshold mass-radius exponent and corresponding limiting mass ratio for conservative mass transfer as derived from the artificially isentropic envelope models ( and , respectively) more realistic than those derived from adiabatic mass loss sequences for standard mixing-length models ( and ). For the low-mass main sequence stars included in this paper, convection is generally quite efficient, even near the stellar surface, and so the difference between mixing-length envelopes and isentropic ones is minimal. But we shall see in the next paper in this series that this is not necessarily the case for giant branch and asymptotic giant branch stars.
4.2 Structural Response of Radiative Stars
Stars with very shallow or nonexistent surface convection zones contract rapidly in response to adiabatic mass loss. This response is a consequence of several factors. Radiative stars generally have much more centrally-condensed mass distributions than do stars with deep surface convection zones, so a given decrement of mass loss removes a proportionately larger volume of material from radiative envelopes than from convective envelopes. Within radiative envelopes, stellar opacity is typically dominated by free-free and bound-free absorption. These opacities are Kramers-like (), and so increase rapidly with decreasing temperature and pressure, as the envelope is decompressed. The radiative flux through the envelope is therefore choked off, the surface luminosity and stellar radius decrease precipitously, and the surface density increases rapidly, accompanied by a relatively modest decrease in surface temperature.
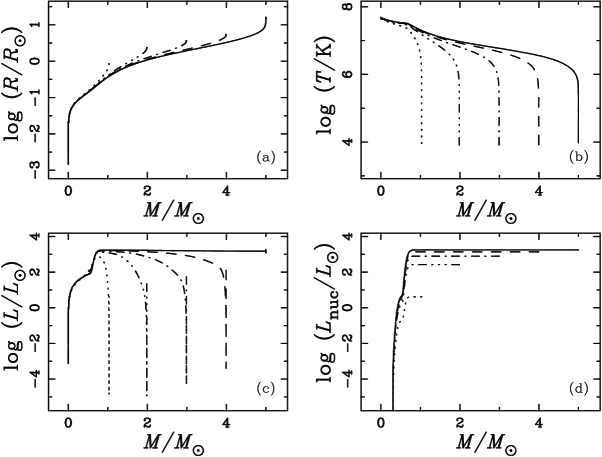
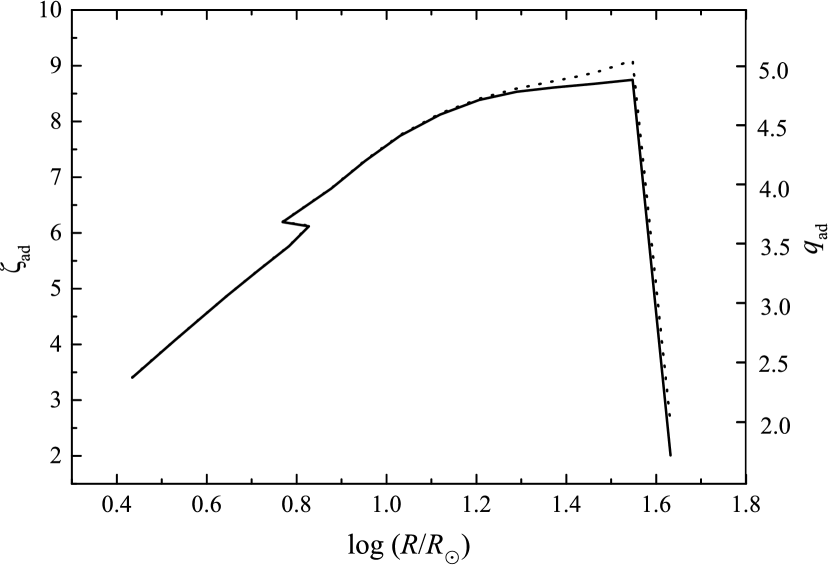
This chain of events is illustrated in Fig. 7 for a star midway in crossing the Hertzsprung gap. This star has exhausted hydrogen in a non-degenerate core surrounded by a thick hydrogen-burning shell centered at mass . It is expanding rapidly toward the giant branch (, compared to a thermal time scale of order ). Roughly 9% of its nuclear luminosity is absorbed in driving this expansion. Near the surface of this star, the scale height for thermodynamical variables (density, temperature, pressure, entropy) becomes extremely small, so removal of the outermost mass layers results in a rapid decrease in specific entropy at the stellar surface, and with it the rapid increase in density described above, leading to the precipitous initial decrease in radius seen in Fig. 7a. This decrease is so rapid that the donor star is initially stable against dynamical time scale mass transfer for any mass ratio of interest. Roche lobe overflow may then be driven by thermal relaxation of the donor star, or by its evolutionary expansion. However, as mass loss proceeds, surface entropy gradients (which are fixed in mass by the adiabatic assumption) become shallower, and the rapid contraction in stellar radius moderates in the adiabatic limit. If the binary mass ratio is high enough ( for conservative mass transfer), this donor star may develop a delayed dynamical instability, as described in Paper I. As seen in Fig. 7b, the temperature profile marches inward as mass loss proceeds with relatively little change in shape until the star is nearly stripped to its helium core. That profile is tied closely to the pressure profile (not shown), and reflects the rapid decrease in pressure scale height near the instantaneous stellar surface as mass loss proceeds. Fig. 7c shows the dramatic drop in stellar luminosity that results from the rapid increase in Kamers-like opacity under decompression, as described above. In contrast, the nuclear luminosity (Fig. 7d) is affected relatively little until the stellar mass approaches the hydrogen-burning shell.
5 Results
Table 3 summarizes the quantitative results of our investigation for both those model sequences derived from initial models with standard mixing-length convective envelopes (columns 2-7), and those sequences derived from initial models with artificially isentropic convective envelopes (columns 8-13). For each set of sequences, it identifies critical points marking the onset of runaway (dynamical time scale) mass transfer, and the (critical) initial conditions (mass-radius exponent and mass ratio) corresponding to those critical points. As noted in Section 4.1, the onset of dynamical time scale mass transfer is not instantaneous, but is preceded by an episode of accelerating mass transfer. We associate the transition to dynamical time scale mass transfer with the mass transfer rate equaling the nominal thermal time scale rate of the initial model of the sequence, ; beyond that rate, the response of the donor becomes asymptotically adiabatic. We then define the critical mass ratio for dynamical mass transfer as the minimum initial mass ratio for which reaches .
| Mixing-length convection | Isentropic convection | ||||||||||||
|---|---|---|---|---|---|---|---|---|---|---|---|---|---|
| 1 | 0.4342 | 2.9669 | 0.1873 | 0.1885 | 3.406 | 2.373 | 0.0003 | 2.9662 | 0.1873 | 0.1885 | 3.409 | 2.374 | |
| 2 | 0.4819 | 3.0121 | 0.2048 | 0.2062 | 3.739 | 2.529 | 0.0002 | 3.0115 | 0.2048 | 0.2062 | 3.741 | 2.530 | |
| 3 | 0.5289 | 3.0535 | 0.2236 | 0.2252 | 4.069 | 2.684 | 0.0002 | 3.0529 | 0.2236 | 0.2252 | 4.072 | 2.685 | |
| 4 | 0.5855 | 3.0987 | 0.2488 | 0.2505 | 4.463 | 2.868 | 0.0003 | 3.0981 | 0.2487 | 0.2504 | 4.467 | 2.870 | |
| 5 | 0.6453 | 3.1432 | 0.2782 | 0.2801 | 4.869 | 3.059 | 0.0003 | 3.1426 | 0.2782 | 0.2801 | 4.873 | 3.060 | |
| 6 | 0.7166 | 3.1932 | 0.3169 | 0.3191 | 5.337 | 3.278 | 0.0003 | 3.1925 | 0.3168 | 0.3191 | 5.342 | 3.281 | |
| 7 | 0.7829 | 3.2385 | 0.3557 | 0.3582 | 5.763 | 3.478 | 0.0004 | 3.2377 | 0.3556 | 0.3582 | 5.769 | 3.481 | |
| 8 | 0.8271 | 3.2724 | 0.3780 | 0.3807 | 6.120 | 3.646 | 0.0005 | 3.2715 | 0.3779 | 0.3807 | 6.127 | 3.650 | |
| 9 | 0.7688 | 3.2582 | 0.3135 | 0.3160 | 6.195 | 3.682 | 0.0003 | 3.2576 | 0.3135 | 0.3160 | 6.200 | 3.684 | |
Note. — Table 3 is published in its entirety in the electronic edition of the Astrophysical Journal. A portion is shown here for guidance regarding its form and content.
Like Tables 1 and 2, Table 3 is arranged in segments, by stellar mass, . Successive columns list:
-
(1)
— mass-loss sequence number;
for models with standard mixing-length convective envelopes:
-
(2)
— initial radius ();
-
(3)
— mass threshold at which ;
-
(4)
— Roche lobe radius at which ;
-
(5)
— stellar radius when ;
-
(6)
— critical mass-radius exponent for dynamical time scale mass transfer;
-
(7)
— critical mass ratio for dynamical time scale (conservative) mass transfer;
and for models with artificially isentropic convective envelopes:
-
(8)
— superadiabatic expansion factor;
-
(9)
— mass threshold at which ;
-
(10)
— Roche lobe radius at which ;
-
(11)
— stellar radius when ;
-
(12)
— critical mass-radius exponent for dynamical time scale mass transfer; and
-
(13)
— critical mass ratio for dynamical time scale (conservative) mass transfer
Columns (3)-(5) and (9)-(11) refer to the points in the critical mass loss sequences at which just reaches , the characteristic mass loss rate which we identify with the transition from thermal to dynamical time scale mass transfer. The corresponding initial conditions leading to these critical points are found in columns (6) and (7) ( and , respectively) for the mixing length convection models, and in columns (12) and (13) ( and , respectively) for the isentropic convection models. For reasons outlined above, we consider the critical mass-radius exponents and mass ratios for these models, and respectively the more realistic, and adopt them in preference to and below in applying our results to real systems.
It should be noted here that the initial radii listed in Table 3 for the mass-loss sequences differ slightly from those of the corresponding evolutionary models listed in Table 2. By modifying the surface boundary condition imposed on the adiabatic sequences (see Paper I), we insure that the luminosity of our mass-losing stars is continuous through the photosphere, and satisfies the blackbody relation, but at the cost of introducing very small differences in the stellar radii. Comparing the entries of column (3) of Table 3 with those of column (3) of Table 2, the reader can verify that the difference in is in all cases negligible in magnitude, never exceeding 0.0012, and averaging only 0.00004.

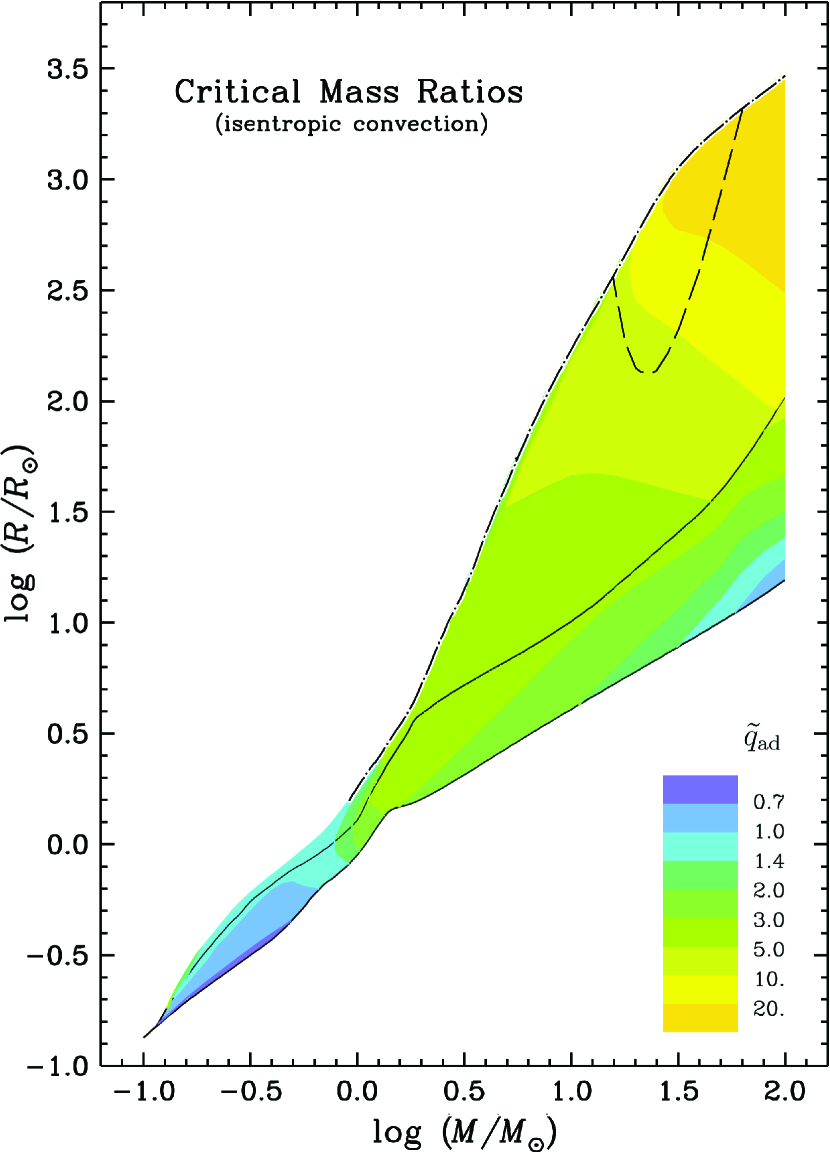
The critical mass ratios found in Table 3 are presented graphically in the form of contour plots in Figures 8 and 9 for mixing-length and isentropic envelope models, respectively. It is immediately apparent that the solutions for and differ very little from each other qualitatively, although is systematically larger than . The difference quantitatively is small except for low-mass main sequence stars, which have deep but efficient surface convection zones, and for massive stars, where the growing dominance of radiation pressure throughout their interiors makes their radii very sensitive to small differences in photospheric density (and entropy).
The most striking feature of Figures 8 and 9 is the nearly uniform trend toward larger critical mass ratios with larger radii in the Hertzsprung gap, a feature as well of stars within the main sequence band itself. These intermediate-mass and massive stars have very thin surface convection zones, if any at all, and typically contract very rapidly in response to adiabatic mass loss. Their critical mass ratios for dynamical time scale mass transfer are then set by the delayed dynamical instability described in Paper I, wherein a protracted episode of thermal time scale mass transfer develops into dynamical instability as mass loss encroaches on the nearly isentropic core of the donor star. That core, as defined in Table 1, scarcely grows in mass as the star evolves through core hydrogen burning and contracts toward helium ignition. The growing stellar radius then demands ever more radical contraction during the thermal mass transfer phase before triggering dynamical instability.
A contributing factor to the increase in with increasing radius is the convergence of dynamical and thermal time scales for stars of high luminosity with extended envelopes. The ratio of global stellar thermal to dynamical time scales, , varies from in the lower left corner of the mass-radius diagram, to at the extreme upper right corner of this diagram. The very short thermal time scales for these luminous, extended stars means that the adiabatic limit can only be reached when the mass transfer rate is extremely large, and so the relative depth of Roche lobe overflow, , needed to reach dynamical mass transfer becomes so large that our 1D treatment of mass transfer becomes increasingly inadequate. Indeed, among very luminous stars, the donors will have overfilled an outer critical surface before reaching the transition to dynamical time scale mass transfer. We shall explore this phenomenon, and its implications for the mass transfer process, in a future study.
As intermediate-mass and massive stars approach the base of the giant branch, they develop surface convection zones that grow rapidly in extent. When the mass of the convective envelope () reaches approximately , the critical conditions for dynamical time scale mass transfer undergo an abrupt, but continuous, transition from delayed to prompt instability (Fig. 10). No longer is dynamical instability preceded by an extended (and extensive) episode of thermal time scale mass transfer, but mass transfer accelerates directly to dynamical instability. In Table 3, cases where critical conditions are set by a prompt instability can be identified by their small differences between and (or ). This difference is much larger for delayed dynamical instability. For the most luminous, extended stars, however, the convergence of thermal and dynamical time scales greatly blurs the distinction between prompt and delayed instability.
Main sequence stars with masses have surface convection zones of sufficient depth to be subject to prompt dynamical instability. These surface convection zones increase rapidly in depth with decreasing main sequence mass, with converging toward the classical limit for fully convective polytropes (, corresponding to for main sequence stars of mass 333The reader may note that and diverge from the polytropic limit over this same mass range, and indeed may even become negative. In this case, all mass ratios would be unstable, and the solutions for are purely formal ones. For these stars, thermal time scale mass transfer is so slow that even very modest superadiabatic expansion can drive mass transfer rates beyond the thermal rate..
6 Comparison with Time-Dependent Mass-Loss Models
How well do the threshold mass ratios for dynamical time scale mass transfer, as deduced from the adiabatic mass loss sequences presented here, replicate the results of time-dependent mass loss calculations? To the extent that they concern donor stars within the main sequence or the Hertzsprung gap, the threshold mass ratios for dynamical time scale mass transfer in common use in binary population synthesis models (e.g. Portegies Zwaart & Verbunt, 1996; Belczynski et al., 2008) derive largely from the early adiabatic mass-loss studies by Hjellming (1989b). Where our models overlap his in mass and evolutionary state, our results are broadly consistent with his, but of much broader scope. However, time-dependent calculations suitable for comparison with our adiabatic mass-loss models are a rarer commodity. Ivanova & Taam (2004) surveyed a relatively narrow range of parameters (, with or ), and within that range, deduced threshold mass ratios in good accord with those presented here.
A broader, more suitable comparison between adiabatic and time-dependent models is afforded by the studies of mass transfer from donor stars in the Hertzsprung gap by Han et al. (2000) and Chen & Han (2002, 2003). They modeled mass transfer from donor stars in the mass range , first filling their Roche lobes early, midway, and late in crossing the Hertzsprung gap. For each combination of initial mass and radius, time-dependent mass-loss models were calculated for each of five initial mass ratios (). This grid of models was calculated under various assumptions (with or without convective overshooting and/or mass and angular momentum loss), of which the set of models with convective overshooting but conservative mass transfer Chen & Han (2003) correspond most closely to the assumptions adopted in our adiabatic mass loss models. The underlying stellar structure code employed by Chen & Han shares the same basic platform as that used to generate our family of initial models, differing significantly only in the algorithm used to calculate mass transfer rates from the degree to which the donor star overfills its Roche lobe. The Chen & Han survey does not specifically aim to quantify critical mass ratios for dynamical time scale mass transfer, but it does identify cases in which the initial models succumb directly to dynamical mass transfer (prompt dynamical instability), those which become unstable as they reach the red giant branch (delayed dynamical instability), and those which remain in stable mass transfer – thermal or nuclear time scale – throughout. These results can be used to bracket the critical mass ratio for dynamical time scale mass transfer, for comparison with our results, as shown in Table 4.
| mode | |||||||
|---|---|---|---|---|---|---|---|
| 1.000 | 0.240 | 0.140 | 3.752 | 2.000 | 1.984 | 3.000 | P |
| 1.000 | 0.332 | 0.218 | 3.736 | 1.500 | 1.452 | 2.000 | P |
| 1.000 | 0.354 | 0.298 | 3.701 | 1.100 | 0.968 | 1.500 | P |
| 1.259 | 0.688 | 0.322 | 3.773 | 2.000 | 3.300 | 3.000 | D |
| 1.259 | 0.691 | 0.357 | 3.756 | 2.000 | 2.941 | 3.000 | D |
| 1.259 | 0.609 | 0.392 | 3.718 | 1.100 | 1.073 | 1.500 | P |
| 1.585 | 1.088 | 0.492 | 3.788 | 3.000 | 3.825 | 4.000 | D |
| 1.585 | 1.107 | 0.522 | 3.778 | 3.000 | 3.406 | 4.000 | D |
| 1.585 | 1.095 | 0.556 | 3.758 | 2.000 | 2.570 | 3.000 | D |
| 1.995 | 1.531 | 0.654 | 3.818 | 4.000 | 4.570 | T | |
| 1.995 | 1.545 | 0.701 | 3.797 | 4.000 | 4.616 | T | |
| 1.995 | 1.538 | 0.746 | 3.773 | 3.000 | 4.216 | 4.000 | D |
| 2.512 | 1.907 | 0.724 | 3.877 | 3.000 | 4.545 | 4.000 | D |
| 2.512 | 1.982 | 0.835 | 3.840 | 4.000 | 4.738 | T | |
| 2.512 | 1.956 | 0.945 | 3.778 | 4.000 | 4.713 | T | |
| 3.162 | 2.381 | 0.800 | 3.957 | 4.000 | 4.344 | T | |
| 3.162 | 2.403 | 0.977 | 3.874 | 4.000 | 4.625 | T | |
| 3.162 | 2.345 | 1.155 | 3.770 | 4.000 | 4.482 | T | |
| 3.981 | 2.791 | 0.865 | 4.027 | 3.000 | 4.281 | 4.000 | D |
| 3.981 | 2.812 | 1.121 | 3.904 | 4.000 | 4.758 | T | |
| 3.981 | 2.730 | 1.374 | 3.757 | 4.000 | 4.170 | T | |
| 5.012 | 3.132 | 0.903 | 4.093 | 3.000 | 4.138 | 4.000 | D |
| 5.012 | 3.205 | 1.244 | 3.941 | 4.000 | 4.748 | T | |
| 5.012 | 3.109 | 1.589 | 3.744 | 4.000 | 4.793 | T | |
| 6.310 | 3.536 | 0.974 | 4.159 | 3.000 | 3.980 | 4.000 | D |
| 6.310 | 3.577 | 1.385 | 3.963 | 4.000 | 4.813 | T | |
| 6.310 | 3.482 | 1.796 | 3.734 | 4.000 | 6.135 | T | |
| 7.943 | 3.887 | 1.045 | 4.211 | 2.000 | 3.875 | D | |
| 7.943 | 3.924 | 1.515 | 3.985 | 4.000 | 4.856 | T | |
| 7.943 | 3.828 | 1.987 | 3.726 | 3.000 | 5.841 | 4.000 | D |
Table 4 summarizes the constraints on the threshold mass ratio for dynamical time scale mass transfer as inferred from Chen & Han (2003). Each line of this table refers to a family of time-dependent mass loss calculations spanning the five trial mass ratios identified above, but sharing a common evolutionary state for the donor star. Columns (1) through (4) list donor mass, luminosity, radius, and effective temperature (averaged over minor variations in , , and among the trial mass ratios). Since the susceptibility to dynamical instability increases with increasing mass ratio of donor to accretor, the largest mass ratio to avoid dynamical instability in the time-dependent calculations presumably sets a lower limit ( — column (5) ) to the threshold mass ratio for dynamical time scale mass transfer, while the smallest mass ratio to trigger dynamical instability sets an upper limit ( — column (7) to that threshold mass ratio. Critical mass ratios interpolated from our adiabatic mass loss sequences () are found in column (6). The final column (8) of Table 4 identifies the nature of the mass transfer instability: — prompt dynamical instability; — delayed dynamical instability; and — thermal time scale instability.
The close agreement demonstrated in Table 4 between time-dependent and adiabatic thresholds for dynamical instability give confidence that the approximations inherent in the adiabatic approach are of mior consequence. While our results do not always satisfy the expected inequality, , rarely strays as much as 10% outside those bounds, except for the very most massive and luminous stars included in the Chen & Han survey. The singular exception to this close agreement between adiabatic and time-dependent critical mass ratios occurs for the very most luminous and extended model in the Chen & Han survey. We attribute this discrepancy to a shortcoming in the prescription used in their studies to relate to the extent of Roche lobe overflow. While adequate when that overflow extent is small, their prescription for breaks down for stars with extended envelopes, as it fails to reflect the natural dynamical time scale, (cf. Eggleton, 2006, pp. 132-134). It thus overestimates mass transfer rates and the propensity toward dynamical instability in that limit. As we shall demonstrate in the next installment in the present series of papers, a physically realistic model for is essential in evaluating critical mass ratios for stars with extended envelopes.
7 An Application: Cataclysmic Variable Stars
| System | SourceaaZSG — compilation by Zorotovic et al. (2011); WR — analysis by Webbink & Ritter (2005) | MethodbbBasis of analysis: (e) — eclipse light curves; (d) — radial velocity curves; (g) — gravitational redshifts; (sp) — spectrophotometric modeling; (r) — rotational velocity of donor star | Refs | ||||
|---|---|---|---|---|---|---|---|
| (min) | () | () | |||||
| OV Boo (catalog )ccSDSS1507+5230 | 66.6 | ZSG | 0.8920.008 | 0.05750.0020 | 0.06470.0018 | e | 1,2,3 |
| SDSS1433+1011 (catalog ) | 78.1 | ZSG | 0.8650.005 | 0.05710.0007 | 0.11150.0016 | e | 1,4,5 |
| WZ Sge (catalog ) | 81.6 | ZSG | 0.850.04 | 0.0780.006 | 0.0920.008 | d,g,sp | 6,7 |
| SDSS1501+5501 (catalog ) | 81.9 | ZSG | 0.7670.027 | 0.0770.010 | 0.1010.010 | e | 1,4 |
| SDSS1035+0551 (catalog ) | 82.1 | ZSG | 0.3500.009 | 0.04750.0012 | 0.05710.0010 | e | 1,8 |
| NZ Boo (catalog )ddSDSS1502+3334 | 84.8 | ZSG | 0.7090.004 | 0.07810.0008 | 0.10990.0007 | e | 1,4 |
| SDSS0903+3300 (catalog ) | 85.1 | ZSG | 0.8720.011 | 0.0990.004 | 0.1130.004 | e | 1,4 |
| XZ Eri (catalog ) | 88.1 | ZSG | 0.7690.017 | 0.0910.004 | 0.1180.003 | e | 1,9 |
| SDSS1227+5139 (catalog ) | 90.7 | ZSG | 0.7960.018 | 0.08890.0025 | 0.11150.0016 | e | 1 |
| OY Car (catalog ) | 90.9 | ZSG | 0.8400.040 | 0.0860.005 | 0.1020.003 | e | 4,10 |
| DI Phe (catalog )eeCTCV2354–4700 | 94.4 | ZSG | 0.9350.031 | 0.1010.003 | 0.10970.0008 | e | 1 |
| SDSS1152+4049 (catalog ) | 97.5 | ZSG | 0.5600.028 | 0.0870.006 | 0.1550.006 | e | 1 |
| EX Hya (catalog ) | 98.3 | WR | 0.4840.393 | 0.0800.054 | 0.1660.075 | d,e | 36,37,38 |
| OU Vir (catalog ) | 104.7 | ZSG | 0.7030.012 | 0.11570.0022 | 0.16410.0013 | e | 1,11,12 |
| HT Cas (catalog ) | 106.1 | ZSG | 0.610.04 | 0.090.02 | 0.150.03 | e | 13 |
| HT Cas (catalog ) | 106.1 | WR | 0.8420.099 | 0.1240.032 | 0.1470.032 | d,r,e | 39,40,13 |
| IY UMa (catalog ) | 106.4 | ZSG | 0.790.04 | 0.100.01 | 0.1250.008 | e | 14 |
| VW Hyi (catalog ) | 107.0 | ZSG | 0.710.22 | 0.110.03 | 0.1480.004 | g | 15,16 |
| Z Cha (catalog ) | 107.3 | ZSG | 0.840.09 | 0.1250.014 | 0.200.02 | e,d | 17,18 |
| Z Cha (catalog ) | 107.3 | WR | 0.8570.181 | 0.1220.026 | 0.1420.003 | d,e | 41,17,18 |
| DV UMa (catalog ) | 123.6 | ZSG | 1.0980.024 | 0.1960.005 | 0.17780.0022 | e | 1,9 |
| V1258 Cen (catalog )ffCTCV1300–3052 | 128.1 | ZSG | 0.7360.014 | 0.1770.021 | 0.2400.021 | e | 1 |
| V1239 Her (catalog )ggSDSS1702+3229 | 144.1 | ZSG | 0.910.03 | 0.2230.010 | 0.2480.005 | e | 1,19 |
| AM Her (catalog ) | 185.7 | ZSG | 0.780.15 | sp | 20 | ||
| DW UMa (catalog ) | 196.7 | ZSG | 0.870.19 | 0.16 | 0.24 | e | 21 |
| IP Peg (catalog ) | 227.8 | ZSG | 1.160.02 | 0.550.02 | 0.480.01 | e | 22 |
| IP Peg (catalog ) | 227.8 | WR | 1.0320.100 | 0.4160.042 | 0.4030.014 | d,r,e | 42,43,44,45,40,46,47 |
| GY Cnc (catalog ) | 252.6 | ZSG | 0.990.12 | 0.380.06 | 0.3870.031 | e | 23 |
| GY Cnc (catalog ) | 252.6 | WR | 0.8920.146 | 0.3660.071 | 0.4100.050 | d,e | 48,23 |
| U Gem (catalog ) | 254.7 | ZSG | 1.200.09 | 0.420.04 | 0.350.05 | d,g,sp | 24,25,26,27,28,29 |
| U Gem (catalog ) | 254.7 | WR | 0.9820.255 | 0.3520.057 | 0.3590.041 | d,e | 49,27,25 |
| BD Pav (catalog ) | 258.2 | WR | 0.9620.100 | 0.4660.100 | 0.4850.064 | d,r,e | 50,49 |
| SDSS1006+2337 (catalog ) | 267.7 | ZSG | 0.780.12 | 0.400.10 | 0.510.08 | e | 30 |
| DQ Her (catalog ) | 278.8 | ZSG | 0.600.07 | 0.400.05 | 0.660.04 | d | 31 |
| DQ Her (catalog ) | 278.8 | WR | 0.5930.128 | 0.3690.082 | 0.6230.099 | d,r,e | 31,51 |
| EX Dra (catalog ) | 302.3 | WR | 0.6960.120 | 0.4640.097 | 0.6660.076 | d,r,e | 52,53,54 |
| RW Tri (catalog ) | 333.9 | WR | 0.6180.219 | 0.4560.152 | 0.7390.116 | d,r,e | 55,56,57,58 |
| V347 Pup (catalog ) | 334.0 | ZSG | 0.630.04 | 0.520.06 | 0.830.05 | d | 32 |
| V347 Pup (catalog ) | 334.0 | WR | 0.6160.041 | 0.4970.050 | 0.8060.049 | d,r,e | 59,32 |
| EM Cyg (catalog ) | 418.9 | ZSG | 1.000.06 | 0.770.08 | 0.770.04 | d | 33 |
| EM Cyg (catalog ) | 418.9 | WR | 1.0260.069 | 0.9030.099 | 0.8800.052 | d,r,e | 60,61,62 |
| AC Cnc (catalog ) | 432.7 | ZSG | 0.760.03 | 0.770.05 | 1.020.04 | d | 34 |
| AC Cnc (catalog ) | 432.7 | WR | 0.7600.042 | 0.7740.044 | 1.0180.052 | d,r,e | 63,34 |
| V363 Aur (catalog ) | 462.6 | ZSG | 0.900.06 | 1.060.11 | 1.170.07 | d | 34 |
| V363 Aur (catalog ) | 462.6 | WR | 0.8980.094 | 1.0390.097 | 1.1570.108 | d,r,e | 64,34 |
| BT Mon (catalog ) | 480.7 | WR | 1.0620.218 | 0.9140.086 | 0.8610.164 | d,r,e | 65,66 |
| AE Aqr (catalog ) | 592.8 | ZSG | 0.630.05 | 0.370.04 | 0.600.02 | d | 35 |
| AE Aqr (catalog ) | 592.8 | WR | 0.8640.035 | 0.6090.054 | 0.7040.034 | d,r | 67,68,69 |
| U Sco (catalog ) | 1772.0 | WR | 1.5010.485 | 0.8210.231 | 0.5470.102 | d,e | 70,71 |
References. — (1)Savoury et al. 2011; (2) Littlefair et al. 2007; (3) Patterson et al. 2008; (4) Littlefair et al. 2008; (5) Tulloch et al. 2009; (6) Steeghs et al. 2007; (7) Long et al. 2004; (8) Littlefair et al. 2006b; (9) Feline et al. 2004c; (10) Wood et al. 1989; (11) Feline et al. 2004a; (12) Feline et al. 2004b; (13) Horne et al. 1991; (14) Steeghs et al. 2003; (15) Smith et al. 2006; (16) Sion et al. 1997; (17) Wade & Horne 1988; (18) Wood et al. 1986; (19) Littlefair et al. 2006a; (20) Gänsicke et al. 2006; (21) Araujo-Betancor et al. 2003; (22) Copperwheat et al. 2010; (23) Thorstensen 2000; (24) Echevarría et al. 2007; (25) Zhang & Robinson 1987; (26) Sion et al. 1998; (27) Long & Gilliland 1999; (28) Naylor et al. 2005; (29) Long et al. 2006; (30) Southworth et al. 2009; (31) Horne et al. 1993; (32) Thoroughgood et al. 2005; (33) Welsh et al. 2007; (34) Thoroughgood et al. 2004; (35) Echevarría et al. 2008; (36) Belle et al. 2003; (37) Vande Putte et al. 2003; (38) Mukai et al. 1998; (39) Young et al. 1981; (40) Catalán et al. 1999; (41) Marsh et al. 1987; (42) Hessman 1989; (43) Smak 2002; (44) Beekman et al. 2000; (45) Martin et al. 1989; (46) Marsh 1988; (47) Wood & Crawford 1986; (48) Shafter et al. 2000; (49) Friend et al. 1990; (50) Axer 1988; (51) Smak 1980; (52) Fiedler 1994; (53) Billington et al. 1996; (54) Baptista et al. 2000; (55) Still et al. 1995; (56) Poole et al. 2003; (57) Horne & Stiening 1985; (58) Smak 1995; (59) Still et al. 1998; (60) Stover et al. 1981; (61) North et al. 2000; (62) Mumford & Krzeminski 1969; (63) Schlegel et al. 1984; (64) Schlegel et al. 1986; (65) Smith et al. 1998; (66) Robinson et al. 1982; (67) de Jager et al. 1994; (68) Eracleous et al. 1994; (69) Casares et al. 1996; (70) Schaefer & Ringwald 1995; (71) Thoroughgood et al. 2001
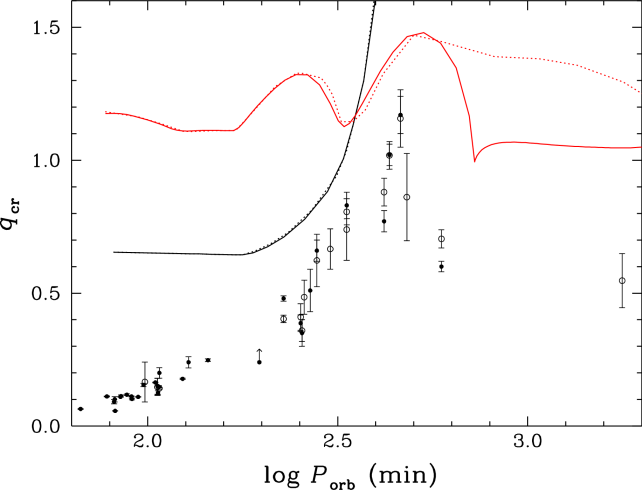
Our stability limits reproduce with considerable fidelity the observed range of mass ratios as a function of orbital period for cataclysmic variables with reliable structural parameters. We adopted the sample of 32 CVs from Zorotovic et al. (2011) judged by them to have robust mass determinations, supplemented by 17 CVs (11 in common with Zorotovic et al.) from an unpublished study by Webbink & Ritter (2005), as detailed in Table 7. These systems must be stable against dynamical and thermal time scale mass transfer, and indeed all of them lie within the bounds permitted by the dynamical and thermal stability limits (Fig. 11). As expected, those systems with mass ratios lie in the period range where stability constraints are weakest. Among shorter-period systems (), the observed mass ratios fall progressively further below our derived stability limits. (In this period range, stability against dynamical time scale mass transfer poses the stronger constraint.) We interpret this divergence as an artifact of pre-CV common envelope evolution, which disfavors survival of systems producing low-mass white dwarfs.
The dynamical and thermal stability limits derived here assume conservation of mass and orbital angular momentum. The fact that observed systems appear to obey these limits implies that any temporary accumulation of angular momentum in the accretion disk or in rotation of the accreting white dwarf must be restored to the binary orbit on a time scale short compared with the growth time scale of any mass transfer instability triggered by nonconservative mass transfer.
8 Discussion and Conclusions
This study is the first of a pair (the second to deal with stars on the giant and asymptotic giant branches) that attempt for the first time to survey systematically the thresholds for dynamical time scale mass transfer over the entire span of possible donor star evolutionary states. These thresholds mark bifurcation points in close binary evolution, separating evolutionary channels proceeding on a thermal time scale (or slower) from those proceeding on a (typically) far more rapid time scale leading to common envelope evolution. Its most obvious immediate application, then, is as input to population synthesis studies of close binary evolution that seek to quantify the frequency and properties of various possible evolutionary channels.
We are confident that the families of adiabatic mass-loss calculations presented here not only capture the qualitative trends of dynamical thresholds with evolutionary state of the donor, but are quantitatively reliable so long as the donor’s dynamical time scale is much shorter than its thermal time scale (justifying the adiabatic approximation). Where we can test our results against observational constraints, as exemplified above in the application to cataclysmic variables, they appear robust, but such direct comparisons are very rarely possible. Some cautionary remarks concerning the limitations of our calculations are therefore warranted.
Foremost among the approximations we have employed is the treatment of the donor response to mass loss as one of adiabatic expansion throughout the donor interior. This approximation may be valid throughout the bulk of the interior once the mass loss rate significantly surpasses the thermal time scale rate, but as noted above it must break down near the stellar photosphere, where radiative relaxation becomes extremely rapid. More significantly, one must recognize that the growth to supra-thermal mass transfer rates generally extends over many thermal time scales, while we approximate the donor response even in these circumstances as purely adiabatic. An estimate of the amount of mass lost during the acceleration to dynamical time scale can be had from the difference in Table 3. For stars with moderately deep surface convection zones, thermal relaxation during this acceleration phase is probably of little consequence because convection zones tend to respond as coherent entities (specific entropy rises or falls more or less uniformly throughout the convection zone), but more significantly because such stars are subject to prompt dynamical instabilities that cut short the acceleration phase. Among stars with radiative envelopes, on the other hand, dynamical instability is generally of the delayed variety, and thermal relaxation during the long run up to dynamical instability may be extensive. That relaxation typically involves absorption of a large fraction of the interior luminosity in the outer envelope, as described above in Section 4.2 and illustrated in Fig. 7. That energy absorption is directed toward rebuilding the strong, positive entropy gradient in the outer envelope that characterizes the structure of radiative stars in thermal equilibrium (see Fig. 1 in Paper I). Since thermal relaxation in radiative envelopes drives expansion of the surface layers (relative to purely adiabatic expansion), it tends to drive higher mass transfer rates than we would calculate from our adiabatic models. Those higher rates may tend to drive the donor toward dynamical instability, but for reasons we elaborate following, we expect that in most cases mass transfer will be cut short by contact with the accreting star before a delayed dynamical instability is manifested.
It is quite likely that the great majority of binaries with mass ratios exceeding for the delayed dynamical instability will in fact evolve into contact before actually reaching the point of instability if they have nondegenerate accretors. Because is in most cases relatively large (), orbital contraction during mass transfer is severe, whereas the accreting stars tend to expand far beyond their thermal equilibrium radii. In their survey of case A mass transfer (mass transfer initiated while the donor star is still in central hydrogen burning), Nelson & Eggleton (2001) found that practically all intermediate-mass donors with suffered this fate. Since increases as stars evolve from the terminal main sequence to the base of the giant branch, while orbital contraction during mass transfer scales very roughly as , these more evolved donors likely also reach contact before developing dynamical instability. If the accretor is compact, it is likely that rapid mass transfer is very non-conservative (super-Eddington winds tend to be strongly stabilizing); it remains to be seen whether delayed dynamical instabilities can be manifested in this case.
The most massive, extended stars in this survey have dynamical time scales that are scarcely a factor of shorter than their thermal time scales. In reality, stars in the upper reaches of our mass range generally suffer quite extensive mass loss in stellar winds, and tend to intrinsic variability as luminous blue variables. Those losses and variability are neglected here, and while our results may still be useful in framing expectations for the behavior of these stars as donors, they are unlikely to be quantitatively reliable.
Finally, with respect to the dynamical response of a binary orbit to mass transfer and mass loss, we again emphasize that, for the sake of clarity and economy, we have assumed conservation of total mass and of total orbital angular momentum, neglecting rotational contributions to the total angular momentum of the binary, and adopted the usual approximations for the tidal limit (Roche lobe) of the donor star. Of course, in reality the response of the donor star’s Roche lobe to mass transfer depends on systemic losses of mass and angular momentum, as well as on angular momentum transport within the binary. At this juncture, no robust theory exists for quantifying those processes, and they are typically parameterized using ad hoc prescriptions for the fraction of mass lost by the donor, but retained by the accretor, the specific angular momentum carried away by systemic mass loss, and the coupling between stellar rotation and the binary orbit. All of these processes introduce additional dimensions to the problem of quantifying thresholds for dynamical time scale mass transfer.
Given a prescription for how the donor Roche lobe responds to mass loss, our adiabatic mass loss sequences are in principle applicable to non-conservative mass transfer as well. It bears emphasizing that the adiabatic mass-radius exponent, , is intrinsic to the donor star. Within the context of the approximations employed in this study, it depends on the binary mass ratio only through the function in Paper I (Eqn. A10), which dependence is extremely weak. Limiting mass ratios for dynamical stability in the case of non-conservative mass transfer, , can therefore be calculated by solving the relationship
where
is the Roche lobe mass-radius exponent appropriate to the adopted non-conservative treatment of mass transfer. If the donor is subject to prompt dynamical instability (possesses a non-negligible surface convection zone), the resulting value of should be robust, as we can then neglect higher-order terms in the dependence of and on in the initial phases of mass transfer. If the donor is subject to delayed dynamical instability, on the other hand, the solution for is may be subject to larger systematic errors, depending on the details of the adopted non-conservative treatment. Greater accuracy then requires detailed knowledge of along the adiabatic mass-loss sequence. The necessary details are available from the authors upon request.444Tables 1-3 are combined in a single, machine-readable table available in the online journal.
In the next (third) installment in this series of papers, we will take up the adiabatic responses of stars with convective envelopes — those on the giant and asymptotic giant branches. Those models present new issues of interpretation, but are prime candidates for systems prone to common envelope evolution. The following (fourth) installment will deal directly with the energetics of common envelope evolution, circumscribing conditions under which survival of common envelope evolution is energetically allowed. It will be followed by a survey of critical conditions for the onset of thermal time scale mass transfer, some initial results of which were employed in the survey of cataclysmic variable stability discussed above.
References
- Araujo-Betancor et al. (2003) Araujo-Betancor, S., Knigge, C., Long, K.S. et al. 2003, ApJ, 583, 437
- Axer (1988) Axer, M. 1988, Spektroskopische Untersuchung des kataklysmischen Veränderlicher BD Pavonis (Diplomarbeit, Ludwig-Maximilians-Universität München)
- Baptista et al. (2000) Baptista, R., Catalán, M.S., & Costa, L. 2000, MNRAS, 316, 529
- Beekman et al. (2000) Beekman, G., Somers, M., Naylor, T., & Hellier, C. 2000, MNRAS, 318, 9
- Belczynski et al. (2008) Belczynski, K., Kalogera, V., Rasio, F.A., et al. 2008, ApJS, 174, 223
- Belle et al. (2003) Belle, K.E., Howell, S.B., Sion, E.M., Long, K.S., & Szkody, P. 2003, ApJ, 587, 373
- Billington et al. (1996) Billington, I., Marsh, T.R., & Dhillon, V.S. 1996, MNRAS, 278, 673
- Casares et al. (1996) Casares, J., Mouchet, M., Martínez-Pais, & Harlaftis, E.T. 1996, MNRAS, 282, 182
- Catalán et al. (1999) Catalán, M.S., Smith, R.C., & Jones, D.H.P. 1999, unpub.
- Chen & Han (2002) Chen, X., & Han, Z. 2002, MNRAS, 335, 948
- Chen & Han (2003) Chen, X., & Han, Z. 2003, MNRAS, 341, 662
- Copperwheat et al. (2010) Copperwheat, C.M., Marsh, T.R., Dhillon, V.S., et al. 2010, MNRAS, 402, 1824
- Dai et al. (2013) Dai, L., Blandford, R.D., & Eggleton, P.P. 2013, MNRAS, 434, 2940
- de Jager et al. (1994) de Jager, O.C., Meintjes, P.J., O’Donoghue, D., & Robinson, E.L. 1994, MNRAS, 267, 577
- Deloye & Taam (2010) Deloye, C.J., & Taam, R.E. 2010, ApJ, 719, L28
- Echevarría et al. (2007) Echevarría, J., de la Fuente, E., & Costero, R. 2007, AJ, 134, 262
- Echevarría et al. (2008) Echevarría, J., Smith, R.C., Costero, R., Zharikov, S., & Michel, R. 2008, MNRAS, 387, 1563
- Eggleton (1971) Eggleton, P.P. 1971, MNRAS, 151, 351
- Eggleton (1972) Eggleton, P.P. 1972, MNRAS, 156, 361
- Eggleton (1973) Eggleton, P.P. 1973, MNRAS, 163, 279
- Eggleton (1983) Eggleton, P.P. 1983, ApJ, 268, 368
- Eggleton (2006) Eggleton, P.P. 2006, Evolutionary Processes in Binary and Multiple Stars (Cambridge: Cambridge Univ. Press)
- Eracleous et al. (1994) Eracleous, M., Horne, K., Robinson, E.L., et al. 1994, ApJ, 433, 313
- Feline et al. (2004a) Feline, W.J., Dhillon, V.S., Marsh, T.R., et al. 2004a, MNRAS, 347, 1173
- Feline et al. (2004b) Feline, W.J., Dhillon, V.S., Marsh, T.R., et al. 2004b, MNRAS, 354, 1279
- Feline et al. (2004c) Feline, W.J., Dhillon, V.S., Marsh, T.R., & Brinkworth, C.S. 2004c, MNRAS, 355, 1
- Fiedler (1994) Fiedler, S.H. 1994, Spektroskopische und photometriche Analyse des kataklysmischen Veränderlichen HS 1804+6753 (Diplomarbeit, Ludwig-Maximilians-Universität München)
- Friend et al. (1990) Friend, M.T., Martin, J.S., Smith, R.C., & Jones, D.H.P. 1990, MNRAS, 246, 637
- Gänsicke et al. (2006) Gänsicke, B.T., Long, K.S., Bartow, M.A., & Hubeny, I. 2006, ApJ, 639, 1039
- Ge et al. (2010a) Ge, H., Hjellming, M.S., Webbink, R.F., Chen, X., & Han, Z. 2010a, ApJ, 717, 724
- Ge et al. (2010b) Ge, H., Webbink, R.F., Han, Z., & Chen, X., 2010b, Ap&SS, 329, 243
- Han et al. (2000) Han, Z., Tout, C.A., & Eggleton, P.P. 2000, MNRAS, 319, 215
- Hessman (1989) Hessman, F.V. 1989, AJ, 98, 675
- Hjellming (1989a) Hjellming, M.S., 1989a, SSRv, 50, 155
- Hjellming (1989b) Hjellming, M.S., 1989b, Ph.D. Thesis, University of Illinois at Urbana-Champaign
- Hjellming & Webbink (1987) Hjellming, M.S., & Webbink, R.F., 1987, ApJ, 318, 794
- Horne & Stiening (1985) Horne, K., & Stiening, R.F. 1985, MNRAS, 216, 933
- Horne et al. (1991) Horne, K., Wood, J.H., & Stiening, R.F. 1991, ApJ, 378, 271
- Horne et al. (1993) Horne, K., Welsh, W.F., & Wade, R.A. 1993, ApJ, 410, 357
- Ivanova & Taam (2004) Ivanova, N., & Taam, R.E. 2004, ApJ, 601, 1058
- Ivanova et al. (2013) Ivanova, N., Justham, S., Avendano Nandez, J.L., & Lombardi, J.C. 2013, Sci, 339, 433
- Kahabka & van den Heuvel (1997) Kahabka, P., & van den Heuvel, E.P.J. 1997, ARA&A, 35, 69
- Kasliwal (2012) Kasliwal, M.M. 2012, PASA, 29, 482
- Kippenhahn & Weigert (1967) Kippenhahn, R., & Weigert, A. 1967, ZA, 65, 251
- Kozai (1962) Kozai, Y. 1962,AJ, 67, 591
- Kulkarni et al. (2002) Kulkarni, S.R., Ofek, E.O., Rau, A., et al. 2007, Nature, 447, 458
- Lauterborn (1969) Lauterborn, D. 1969, in Mass Loss from Stars, ed.M. Hack (Dordrecht: D. Reidel), 262
- Littlefair et al. (2006a) Littlefair, S.P., Dhillon, V.S., Marsh, T.R., & Gänsicke, B.T. 2006a, MNRAS, 371, 1435
- Littlefair et al. (2006b) Littlefair, S.P., Dhillon, V.S., Marsh, T.R., et al. 2006b, Sci, 314, 1578
- Littlefair et al. (2007) Littlefair, S.P., Dhillon, V.S., Marsh, T.R., et al. 2007, MNRAS, 381, 827
- Littlefair et al. (2008) Littlefair, S.P., Dhillon, V.S., Marsh, T.R., et al. 2008, MNRAS, 388, 1582
- Long & Gilliland (1999) Long, K.S., & Gilliland, R.L. 1999, ApJ, 511, 91
- Long et al. (2004) Long, K.S., Sion, E.M., Gänsicke, G.T., & Szkody, P. 2004, ApJ, 602, 948
- Long et al. (2006) Long, K.S., Brammer, G., & Froning, C.S. 2006, ApJ, 648, 541
- Marsh (1988) Marsh, T.R. 1988, MNRAS, 231, 1117
- Marsh et al. (1987) Marsh, T.R., Horne, K., & Shipman, H.L. 1987, MNRAS, 225, 551
- Martin et al. (1989) Martin, J.S., Fried, M.T., Smith, R.C., & Jones, D.H.P. 1989, MNRAS, 240, 519
- Mukai et al. (1998) Mukai, K., Ishida, M., Osborne, J., Rosen, S., & Stavroyiannopoulos, D. 1998, in ASP Conf. Ser. 137, Wild Stars in the Old West, ed. S. Howell, E. Kuulkers, & C. Woodward, (San Francisco, CA: ASP), 554
- Mumford & Krzeminski (1969) Mumford, G.S., & Krzeminski, W. 1969, ApJS, 18, 429
- Munari et al. (2002) Munari, U., Henden, A., Kiyota, S., et al. 2002, A&A, 389, L51
- Naylor et al. (2005) Naylor, T., Allan, A., & Long, K.S. 2005, MNRAS, 361, 1091
- Nelson & Eggleton (2001) Nelson, C.A., & Eggleton, P.P. 2001, ApJ, 552, 664
- North et al. (2000) North, R.C., Marsh, T.R., Moran, C.K.J., et al. 2000, MNRAS, 313, 383
- Paczyński & Sienkiewicz (1972) Paczyński, B. & Sienkiewicz, R. 1972, AcA, 22, 73
- Patterson et al. (2008) Patterson, J., Thorstensen, J.R., & Knigge, C. 2008, PASP, 120, 510
- Paxton (2004) Paxton, B. 2004, PASP, 116, 699
- Plavec (1980) Plavec, M.J. 1980, in IAU Symp. No. 88, Close Binary Stars, Observations and Interpretation, ed. M.J. Plavec, D.M. Popper, & R.K. Ulrich (Dordrecht: D. Reidel), 251
- Poole et al. (2003) Poole, T., Mason, K.O., Ramsay, G., Drew, J.E., & Smith, R.C. 2003, MNRAS, 340, 499
- Portegies Zwaart & Verbunt (1996) Portegies Zwart, S.F. & Verbunt, F. 1996, A&A, 309, 179
- Robinson et al. (1982) Robinson, E.L., Nather, R.E., & Kepler, S.O. 1982, ApJ, 254, 646
- Savonije (1978) Savonije, G.J. 1978, A&A, 62, 317
- Savoury et al. (2011) Savoury, C.D.J., Littlefair, S.P., Dhillon, V.S., et al. 2011, MNRAS, 415, 2025
- Schaefer & Ringwald (1995) Schaefer, B.E., & Ringwald, F.A. 1995, ApJ, 447, L45
- Schlegel et al. (1984) Schlegel, E.M., Kaitchuk, R.H., & Honeycutt, R.K. 1984, ApJ, 280, 235
- Schlegel et al. (1986) Schlegel, E.M., Honeycutt, R.K., & Kaitchuk, R.H. 1986, ApJ, 307, 730
- Schroder et al. (1997) Schroder, K.-P., Pols, O.R., & Eggleton, P.P. 1997, /mnras, 285, 686
- Shafter et al. (2000) Shafter, A.W., Clark, L.L., Holland, J., & Williams, S.J. 2000, PASP, 112, 1467
- Sion et al. (1997) Sion, E.M., Cheng, F.H., Sparks. W.M., et al. 1997, ApJ, 480, L17
- Sion et al. (1998) Sion, E.M., Cheng, F.H., Szkody, P., et al. 1998, ApJ, 496, 449
- Smak (1980) Smak, J. 1980, AcA, 30, 267
- Smak (1995) Smak, J. 1995, AcA, 45, 259
- Smak (2002) Smak, J.I. 2002, AcA, 52, 189
- Smith et al. (2006) Smith, A.J., Haswell, C.A., & Hynes, R.I. 2006, MNRAS, 369, 1537
- Smith et al. (1998) Smith, D.A., Dhillon,, V.S., & Marsh, T.R. 1998, MNRAS, 296, 465
- Soker & Tylenda (2006) Soker, N., & Tylenda, R. 2006, MNRAS, 373, 733
- Southworth et al. (2009) Southworth, J., Hickman, R.D.G., Marsh, T.R., et al. 2009, A&A, 507, 929
- Steeghs et al. (2003) Steeghs, D., Perryman, M.A.C., Reynolds, A., et al. 2003, MNRAS, 339, 810
- Steeghs et al. (2007) Steeghs, D., Howell, S.B., Knigge, C., et al. 2007, ApJ, 667, 442
- Still et al. (1995) Still, M.D., Dhillon, V.S., & Jones, D.H.P. 1995, MNRAS, 273, 849
- Still et al. (1998) Still, M.D., Buckley, D.A.H, & Garlick, M.A. 1998, MNRAS, 299, 545
- Stover et al. (1981) Stover, R.J., Robinson, E.L., & Nather, R.E. 1981, ApJ, 248, 696
- Thoroughgood et al. (2001) Thoroughgood, T.D., Dhillon V.S., Littlefair, S.P., Marsh, T.R., & Smith, D.A. 2001, MNRAS, 327, 1323
- Thoroughgood et al. (2004) Thoroughgood, T.D., Dhillon, V.S., Watson, C.A., et al. 2004, MNRAS, 353, 1135
- Thoroughgood et al. (2005) Thoroughgood, T.D., Dhillon, V.S., Steeghs, D., et al. 2005, MNRAS, 357, 881
- Thorstensen (2000) Thorstensen, J.R. 2000, PASP, 112, 1269
- Tulloch et al. (2009) Tulloch, S.M., Rodríguez-Gil, P., & Dhillon, V.S. 2009, MNRAS, 397, L82
- van den Heuvel et al. (1992) van den Heuvel, E.P.J., Bhattacharya, D., Nomoto, K., & Rappaport, S.A. 1992, A&A, 262, 97
- Vande Putte et al. (2003) Vande Putte, D., Smith, R.C., Hawkins, N.A., & Martin, J.S. 2003, MNRAS, 342, 151
- Wade & Horne (1988) Wade, R.A., & Horne, K. 1988, ApJ, 324, 411
- Webbink & Ritter (2005) Webbink, R.F., & Ritter, H. 2005, unpub.
- Welsh et al. (2007) Welsh, W.F., Froning, C.S., Marsh, T.R., et al. 2007, in ASP Conf. Ser. 362, The Seventh Pacific Rim Conference on Stellar Astrophysics, ed. Y.W. Kand, H.-W. Lee, K.-C. Leung, & K.-S. Cheng (San Francisco, CA: ASP), 241
- Wood & Crawford (1986) Wood, J., & Crawford, C.S. 1986, MNRAS, 222, 645
- Wood et al. (1986) Wood, J., Horne, K., Berriman, G., et al. 1986, MNRAS, 219, 629
- Wood et al. (1989) Wood, J.H., Horne, K., Berriman, G., & Wade, R.A. 1989, ApJ, 341, 974
- Woods & Ivanova (2011) Woods, T.E., & Ivanova, N. 2011, ApJ, 739, L48
- Young et al. (1981) Young, P., Schneider, D.P., & Shectman, S.A. 1981, ApJ, 245, 1035
- Zhang & Robinson (1987) Zhang, E.-H., & Robinson, E.L. 1987, ApJ, 321, 813
- Zorotovic et al. (2011) Zorotovic, M., Schreiber, M.R., & Gänsicke, B.T. 2011, A&A, 536, A42