Detection of Fast-Moving Waves Propagating Outward along Sunspots’ Radial Direction in the Photosphere
Abstract
Helioseismic and magnetohydrodynamic waves are abundant in and above sunspots. Through cross-correlating oscillation signals in the photosphere observed by the SDO/HMI, we reconstruct how waves propagate away from virtual wave sources located inside a sunspot. In addition to the usual helioseismic wave, a fast-moving wave is detected traveling along the sunspot’s radial direction from the umbra to about 15 Mm beyond the sunspot boundary. The wave has a frequency range of mHz with a phase velocity of 45.3 km s-1, substantially faster than the typical speeds of Alfvén and magnetoacoustic waves in the photosphere. The observed phenomenon is consistent with a scenario of that a magnetoacoustic wave is excited at approximately 5 Mm beneath the sunspot, and its wavefront travels to and sweeps across the photosphere with a speed higher than the local magnetoacoustic speed. The fast-moving wave, if truly excited beneath the sunspot’s surface, will help open a new window to study the internal structure and dynamics of sunspots.
1 Introduction
Oscillations, helioseismic waves, and different types of magnetohydrodynamic (MHD) waves are abundant in sunspots’ atmosphere, both at and above the photospheric level (Bogdan & Judge, 2006). Studying these various waves can help us understand the physical conditions, such as temperature, density stratification, and magnetic field structure, in the atmosphere and even beneath the photosphere of sunspots. Inside sunspots, 5-minute oscillations, stronger than oscillations of other periods, are believed mostly due to acoustic waves traveling into sunspots from the surrounding areas (Beckers & Schultz, 1972; Thomas, 1985). In the chromosphere, 3-minute oscillations become dominant and are often associated with umbral flashes (e.g., Nagashima et al., 2007). Running penumbral waves (RPWs) are a prominent phenomenon observed in the sunspot chromosphere, and they display as concentric ripples propagating from the umbra-penumbra boundary outward with a typical speed of km s-1 (Giovanelli, 1972; Zirin & Stein, 1972), although speeds as low as km s-1 (Madsen et al., 2015) and as fast as km s-1 (Kolobov & Kobanov, 2009) were also reported. The nature of the RPWs has been long debated, and in recent years it was suggested that these waves might represent magnetoacoustic waves that propagate upward from the photosphere along inclined magnetic field lines (Bloomfield et al., 2007; Jess et al., 2013; Madsen et al., 2015). Other chromospheric observations also revealed waves propagating only inside sunspot umbrae with a speed of km s-1, which appeared to terminate near the umbra and penumbra boundaries (Kobanov & Makarchik, 2004; Liang et al., 2011). The RPWs and the umbral waves are thought to be independent phenomena. More recent observations from IRIS (Interface Region Imaging Spectrograph) found that sunspot oscillations in the chromosphere and the transition region displayed the behavior of shock waves (Tian et al., 2014).
How helioseismic waves, including both -mode (surface gravity wave) and -mode (acoustic wave), interact with sunspots has been studied to better understand the sunspots’ internal structure and dynamics, as well as wave properties in the presence of magnetic field. Cameron et al. (2008, 2011) reconstructed from observations how the -mode wave passes through a sunspot surface like a plane wave, and modeled numerically the sunspot’s semi-empirical internal structures through comparing the simulated wave with the observationally reconstructed wave. Using a similar helioseismic technique to reconstruct the waves’ propagation, Zhao et al. (2011a) and Yang et al. (2012) measured acoustic wavefunctions scattered by sunspots, and Chou et al. (2012) studied the interference fringes of acoustic waves around sunspots. From a different perspective, Zhao et al. (2011b) investigated how - and -mode waves, originating from virtual point sources, interacted with a sunspot before, during, and after their encounters. Later, through numerical simulations, Parchevsky et al. (2011) studied how helioseismic waves from a point source interacted with a sunspot in the hope to shed light on the sunspot’s internal dynamics and magnetic field structure.
In this Letter, employing a procedure similar to reconstruct waves traveling from virtual point sources (Zhao et al., 2011b), we report on a detection of fast-moving waves at the photospheric level, propagating radially from the sunspot umbra through the penumbra to the outside. The observed properties of this wave are consistent with a fast magnetoacoustic wave excited beneath the sunspot’s surface, the wavefront of which sweeps across the photosphere. Although the cause of this subsurface wave source is not clear at this time, this new phenomenon may help to open a new window to diagnose the sunspots’ interior. We introduce the data and analysis procedure in Sec. 2, present the results in Sec. 3, and discuss the nature and possible cause of the wave in Sec. 4.
2 Observation and Analysis
In this Letter, we present analysis of a sunspot located inside active region NOAA 11312 as one example; however, it is worth pointing out that we have obtained essentially the same results for several other sunspots. We believe that the results reported here are a common phenomenon existing in most sunspots.
As shown in Figure 1, this sunspot appeared to be round, which can be presumably considered as axisymmetric for helioseismic purposes, and stayed relatively stable during its disk passage from 2011 October 3 through October 17. In this study, we use the data taken by SDO/HMI (Solar Dynamics Observatory / Helioseismic and Magnetic Imager, Scherrer et al., 2012; Schou et al., 2012) between 00:00UT of October 8 and 23:59UT of October 12, a 5-day period during the sunspot’s passage from about east to west of the central meridian. To prepare the data for analysis, we track the sunspot with its local rotation rate, and remap the data into heliographic coordinates using Postel’s projection with the sunspot located at the center of the images. In order to assure that the observed phenomenon in this study is not due to artifacts or unknown calibration errors, we analyze four observables obtained by the SDO/HMI: Doppler velocity, continuum intensity, line-core intensity, and line-depth, as well as one observable from the SDO/AIA (Atmospheric Imaging Assembly, Lemen et al., 2012): 1700Å line intensity. For all observables, we use running difference images of the original data without applying other signal filters so that the solar convection gets substantially suppressed while wave signals around the sunspot are not compromised.
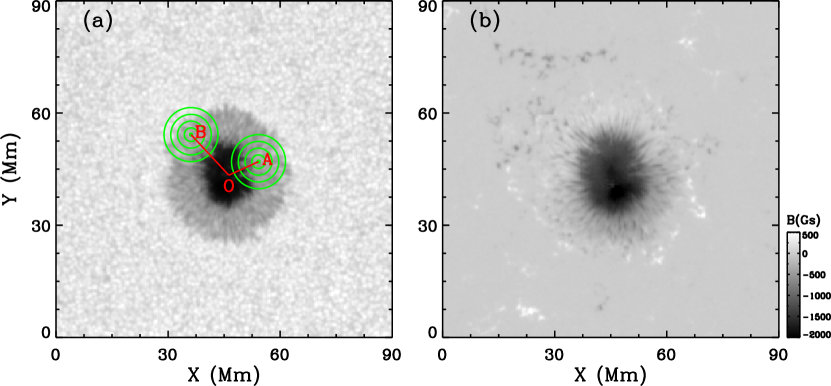
For stochastic wavefields, cross-correlating oscillation signals observed at one location with those observed at other locations is a powerful tool to reconstruct how waves propagate away from this location to others. This method has been widely used in various research fields, including seismology (e.g., Snieder & Wapenaar, 2010; de Ridder, 2014) and helioseismology (e.g., Cameron et al., 2008; Zhao et al., 2011b). The analysis procedure used in this study is the same as described by Zhao et al. (2011b), but the virtual wave sources are chosen inside the sunspot. The analysis scheme is illustrated in Figure 1a: all waves originating from a virtual source ‘’ can be reconstructed by cross-correlating the time series observed at ‘’ with the time series observed at all other locations inside the field of view. Waves originating from the virtual source ‘’ can be reconstructed similarly. However, practically, the waves constructed from a single source using a limited time period do not possess sufficiently high signal-to-noise ratio for further analysis. Because the sunspot is nearly axisymmetric, we can enhance the signal-to-noise ratio through averaging the wavefields obtained from sources ‘’ and ‘’ by rotating the wavefield from ‘’ to overlap directions of ‘’ and ‘’ and match locations ‘’ and ‘’. The same azimuthal averaging process is repeated for waves reconstructed for all other locations inside the sunspot. Moreover, when we average the wavefields for final results, we separate the cases for virtual sources located inside the umbra and penumbra in case that waves from these two different entities have different properties. The resultant wavefields resemble the propagation of waves originating inside the sunspot umbra and penumbra. However, due to that the penumbra covers a large distance range, our results from the sunspot penumbra smear out the differences, if any, of waves initiated from the inner, middle, and outer penumbra.
3 Results
The results for the sunspot umbra do not differ significantly from the results for the penumbra regarding the properties of the wave but are much noisier. Therefore, in this Letter we focus on presenting and discussing only the results obtained when the virtual wave sources are located inside the penumbra. Also, the results obtained from the different HMI and AIA observables are qualitatively similar, but the HMI Doppler velocity data give the best signal-to-noise ratio in our analysis. Figures 2 and 3 show the results obtained using the Doppler velocity data, and Figure 4 illustrates the results from the other observables.
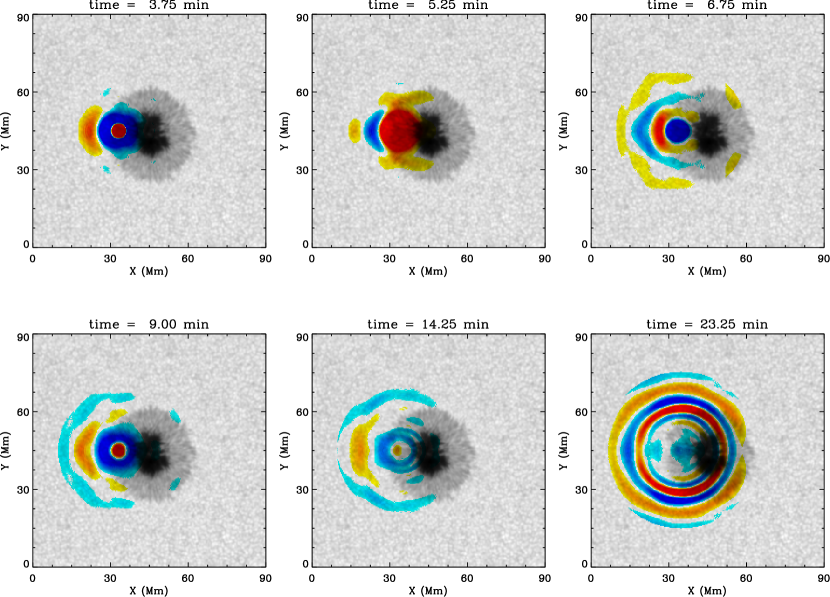
Figure 2 displays a few selected snapshots of the waveform obtained for the virtual source located inside the penumbra, and the online movie shows the entire sequence. For the time lags from 3.75 min to 14.25 min, a fast-moving wave is seen propagating along the sunspot’s radial direction from the penumbra to the outside of the sunspot. This wave is asymmetric with the strongest power and fastest traveling speed along the sunspot’s radial outward direction, and weak or no power and slower speed for other directions. The wave signal terminates at approximately 30 Mm away from the sunspot center, or about 15 Mm beyond the sunspot boundary. This fast-moving wave is clearly distinguishable from the usual helioseismic waves, which can be seen in the snapshots at 14.25 min and 23.25 min. Actually, in our analysis, the helioseismic wave is first identified only at 12.00 min.
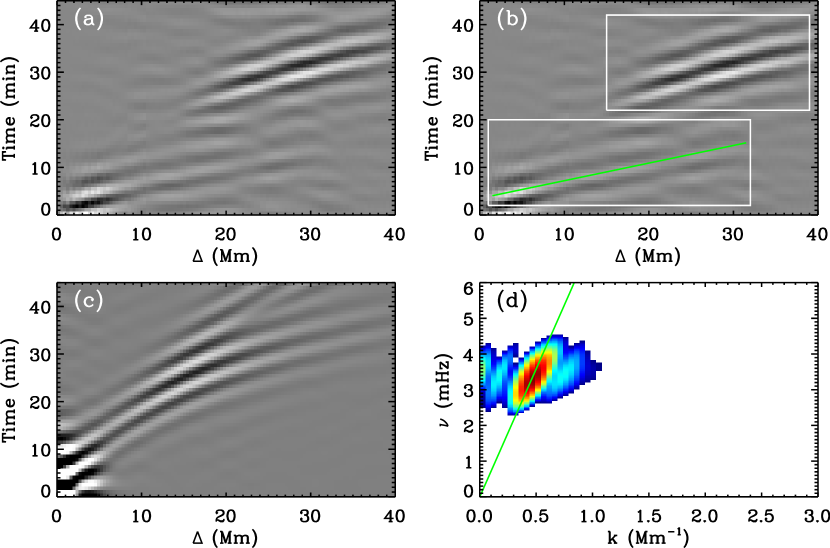
To better quantify the properties of the fast-moving wave, we obtain the time–distance relation of the wave by stacking together the cross-correlation functions for different travel-time lags. Since the wave travels preferentially along the radially outward direction, only the time–distance diagram obtained along this direction is shown in Figure 3. There are two wave branches visible in the time–distance diagram (Figure 3a-b), with the lower branch corresponding to the fast-moving wave, and the upper branch corresponding to the usual helioseismic waves. By comparing this time–distance diagram with the one obtained from a quiet-Sun region following the same analysis procedure (Figure 3c), we find that the helioseismic waves from the penumbral sources are largely suppressed for short travel distances, and that the fast-moving wave is a phenomenon only associated with the sunspot.
The fast-moving wave appears to propagate with a nearly constant speed and shows little dispersion, i.e., its group velocity is similar to its phase velocity. We use a linear fitting to estimate its apparent phase velocity and get a speed of km s-1, substantially faster than the speed of fast magnetoacoustic wave or Alfvén wave, which is an order of 10 km s-1 in the photosphere of sunspots. Taking the time–distance diagram of the fast-moving wave (the lower white box in Figure 3b), we calculate the power spectrum of this wave (Figure 3d). Due to the limited spatial and temporal scale of the wave, aliasing is hard to avoid when performing Fourier transform and calculating the power spectrum. The power-spectrum diagram shows a dominant power in the range of mHz, indicating that the oscillation frequency of this fast-moving wave falls into the category of 5-minute oscillation, same as the typical acoustic waves in the photosphere. The dominant power shows a phase velocity close to 45 km s-1, in agreement with the fitting result in the space–time domain.
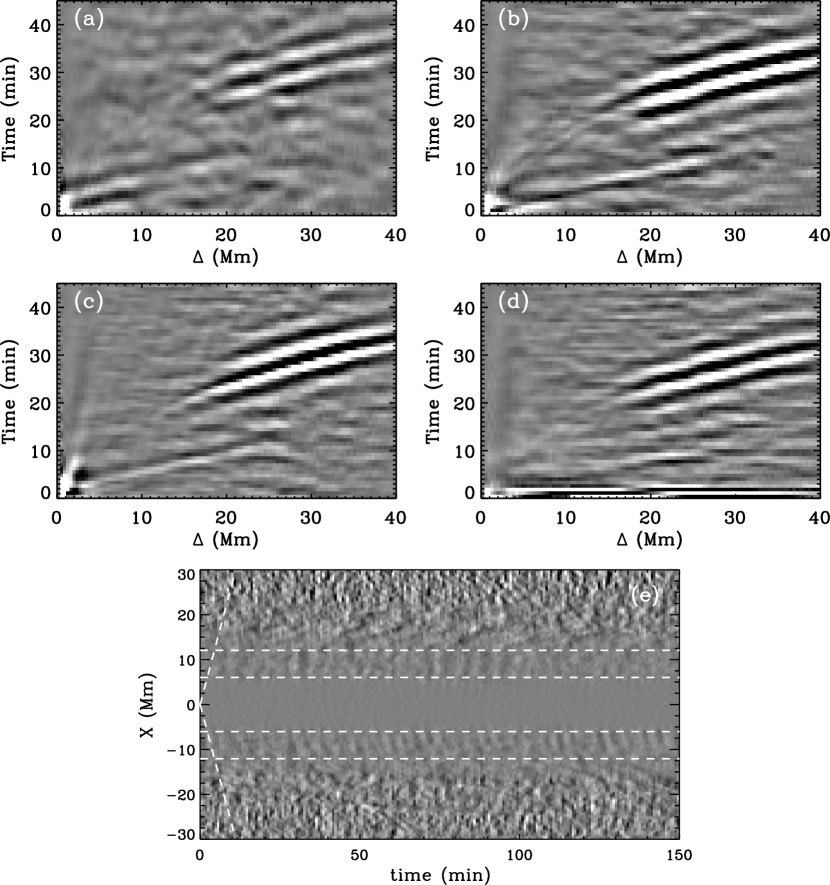
The fast-moving wave is also detected in the analysis results from the other HMI and AIA observables (Figure 4a-d), although the signal-to-noise ratio varies among these observables. The properties of the observed fast-moving wave are also slightly different in the characteristic frequency and phase velocity, probably because different observables correspond to different atmospheric heights and the wave has different properties at different heights.
As a matter of fact, although the fast-moving wave is not apparent in the HMI Doppler and continuum intensity data without applying the cross-correlation calculations, part of the fast-moving wave is directly visible in the HMI line-core and line-depth data. Figure 4e displays a time–space plot of the line-core data with a horizontal cut through the sunspot center, in which one can see herringbone patterns in the inner penumbra, i.e., about 7 – 12 Mm away from the umbra center delimited in the dashed lines in Figure 4e. The herringbone patterns have a propagation speed of approximately 45 km s-1, consistent with the estimate obtained from the cross-correlation calculations. Between 12 – 20 Mm, the outer penumbra is dominated by slow-moving waves with an apparent speed of 6 km s-1. These waves seem to be an extension of some of the fast-moving waves, but they do not appear in the cross-correlation diagram (Figure 4b), implying these waves do not share common sources with the fast-moving waves. Although not clearly visible in Figure 4e beyond 12 Mm, the fast-moving waves can still be picked up by the cross-correlation analysis up to 30 Mm from the sunspot center. What is the relation between the fast-moving wave in the inner penumbra and the slow-moving wave in the outer penumbra is worth further studying.
4 Discussion
Through cross-correlating stochastic oscillation signals observed at various locations inside and near a sunspot, we reconstruct waves propagating away from virtual point sources located inside the sunspot. It is found that after a virtual source is initiated and before typical helioseismic waves are visible, a fast-moving wave appears propagating outward along the sunspot’s radial direction, with an apparent phase velocity of about 45 km s-1and a characteristic frequency between 2.5 and 4.0 mHz. This wave starts from the sunspot umbra and terminates at about 15 Mm beyond the sunspot boundary. In the inner penumbra, for about 1/4 of the whole traveling range, the wave is visible in the inner penumbra in the HMI line-core intensity data without applying cross-correlation calculations. For the rest of the wave traveling range, and for HMI Doppler and continuum intensity data, the wave is only visible after cross-correlation analysis is applied.
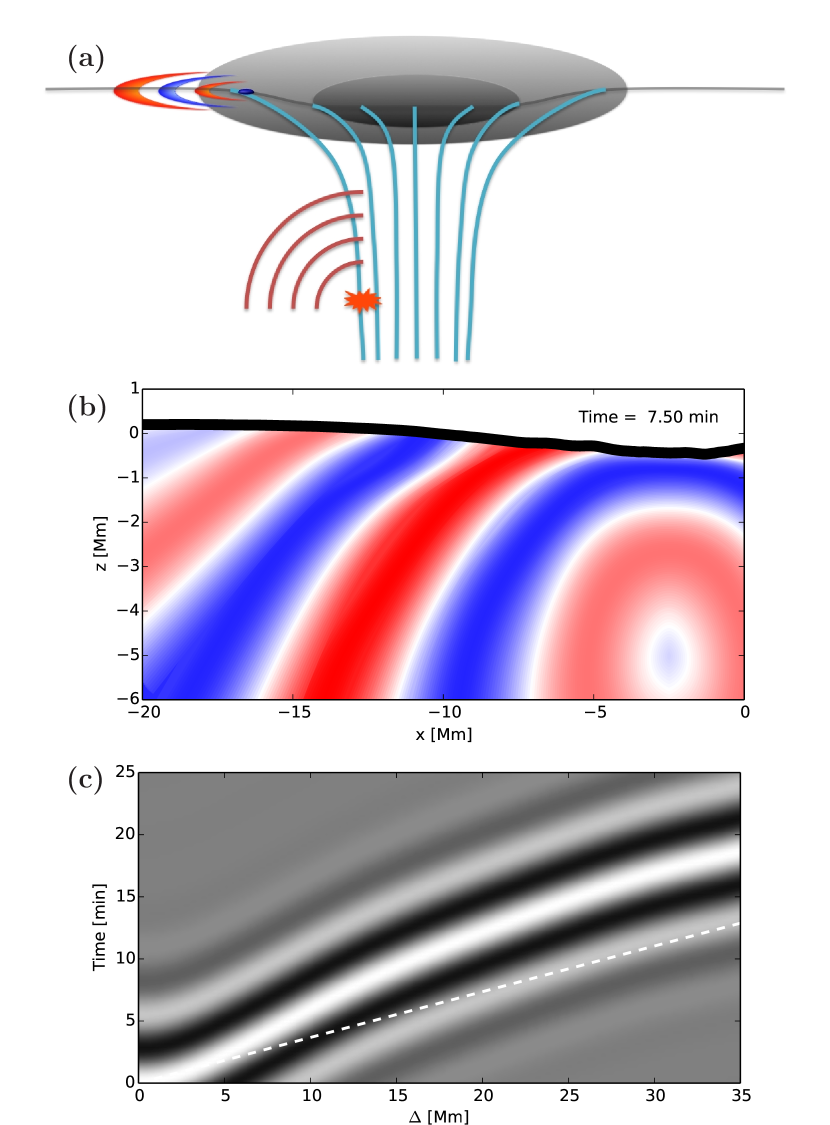
What is the nature of this fast-moving wave, what causes it, and how to explain its fast speed are interesting questions. Although Figure 2 (and the online movie) seems to show the wave is a traveling wave on the surface, it is physically implausible to explain its propagation speed, which is substantially faster than the local Alfvén wave and fast magnetoacoustic wave. The characteristic frequency of the wave implies that this wave falls into the category of acoustic waves, and the time–distance relation of the wave is a key factor to determine the nature of the wave. To explain this wave, we conjecture a disturbance occurring at approximately 5 Mm beneath the sunspot surface and 2 Mm away from the sunspot’s central axis (see Figure 5a). Acoustic waves are excited by this disturbance and expand toward all directions. Due to the stratified structure of the sound-speed profile as a function of depth, and the existence of the magnetic field that will alter, albeit slightly, the sound-speed profile both horizontally and vertically, the wavefront does not expand symmetrically toward all directions. The wavefront touches different locations of the photosphere at different times, forming effectively a fast-expanding ellipse at the surface due to the asymmetric propagation speed. Numerous disturbance sources are located below the sunspot in a wide range of depths and distances to the central axis, and cross-correlation analysis eventually gives us a wave as seen in Figure 2. That is, it is likely that what we see at the surface are wavefronts of the waves, which are excited below sunspots, sweeping across the photosphere. Employing a realistic magnetohydrodynamic sunspot model (Rempel et al., 2009) and following the ray-path approximation with magnetic field (Moradi & Cally, 2008), we calculate how a magnetoacoustic wave, at a frequency of 3.0 mHz, expand from the deep source and how its wavefront sweeps across the photosphere (see Figure 5). The time–distance relation from this calculation shows an approximately 40 km s-1 surface speed of the wavefront when it is 10 Mm horizontally away from the source on the surface. The difference in the apparent speeds between the model and observation may be due to the relatively weak magnetic field used in the model, or due to different depths of disturbance sources. We only present here our calculations of 3.0 mHz, but we also recognize that the subsurface disturbances can excite waves with very broad frequency band. The frequency-dependent power distribution at the subsurface locations is determined by the local atmospheric properties, and is expected to be different from the power distribution observed at the photosphere.
However, despite that this conjecture is promising in explaining the observations, there are clear difficulties. One difficulty is that it is unclear what causes those disturbances beneath sunspots? Some past helioseismic analyses indicated that the depth of 5 Mm was approximately where the sunspot’s downdraft meets the upward flow (e.g., Zhao et al., 2010), and plasma collisions near this depth may cause disturbances that generate the magnetoacoustic waves. Other than that, currently there is no other evidence as we know indicating that this area may have plentiful wave sources. The other difficulty is, the magnetohydrodynamic processes between sunspots’ subsurface and surface are rather complicated, and our equations prescribing the ray paths do not take into consideration of the subsurface flow field, the alteration of wave eignfunctions in the presence of strong magnetic field, and maybe other factors. The inclined magnetic field and fast flows in the penumbra further complicate the estimate of travel speed of the waves. Therefore, we do not expect that the picture given in Figure 5 fully represents all details of the wave propagation through the sunspot region, but it is a useful first attempt to explain the observed phenomenon. Meanwhile, we cannot completely rule out other possible explanations, e.g., what we observe may be waves reflected back from the upper chromosphere (Cally & Moradi, 2013).
It is likely that the chromospheric RPWs (see §1) and the photospheric fast-moving waves have a common cause. When a disturbance occurs about 5 Mm below the sunspot surface near the sunspot’s central axis, a magnetoacoustic wave sweeps across the photosphere in the sunspot and its immediate vicinity, and a fast-moving wavefront is detected. When the wave propagates along the inclined magnetic field from the subsurface to the photosphere and above, the RPW is observed in the chromosphere as the transverse projection of the magnetoacoustic wave (e.g., Bloomfield et al., 2007).
This newly detected fast-moving wave, although may not be a new type of wave, likely carries rich information from sunspots’ subsurface area, and may help to open a new window to diagnose sunspots’ internal structure and dynamics.
References
- Beckers & Schultz (1972) Beckers, J. M., & Schultz, R. B. 1972, Sol. Phys., 27, 61
- Bloomfield et al. (2007) Bloomfield, D. S., Lagg, A., & Solanki, S. K. 2007, ApJ, 671, 1005
- Bogdan & Judge (2006) Bogdan, T. J., & Judge, P. G. 2006, Phil. Trans. R. Soc. A, 364, 313
- Cally & Moradi (2013) Cally, P. S., & Moradi, H. 2013, MNRAS, 435, 2589
- Cameron et al. (2008) Cameron, R., Gizon, L., & Duvall, T. L., Jr. 2008, Sol. Phys., 251, 291
- Cameron et al. (2011) Cameron, R. H., Gizon, L., Schunker, H., & Pietarila, A. 2011, Sol. Phys., 268, 293
- Chou et al. (2012) Chou, D.-Y., Zhao, H., Yang, M.-H., & Liang, Z.-C. 2012, ApJ, 758, 88
- de Ridder (2014) de Ridder, S. 2014, Ph.D. Thesis, Stanford Univ.
- Giovanelli (1972) Giovanelli, R. G. 1972, Sol. Phys., 27, 71
- Jess et al. (2013) Jess, D. B., Reznikova, V. E., Van Doorsselaere, T., Keys, P. H., & Mackay, D. H. 2013, ApJ, 779, 168
- Kobanov & Makarchik (2004) Kobanov, N. I., & Makarchik, D. V. 2004, A&A, 424, 671
- Kolobov & Kobanov (2009) Kolobov, D. Y., & Kobonov, N. I. 2009, Geomagnetism and Aeronomy, 49, 935
- Lemen et al. (2012) Lemen, J. R., Title, A. M., Akin, D. J., et al. 2012, Sol. Phys., 275, 17
- Liang et al. (2011) Liang, H., Ma, L., Yang, R., Li, H., & Zhao, L. 2011, PASJ, 63, 575
- Madsen et al. (2015) Madsen, C. A., Tian, H., & DeLuca, E. E. 2015, ApJ, 800, 129
- Moradi & Cally (2008) Moradi, H., & Cally, P. S. 2008, Sol. Phys., 251, 309
- Nagashima et al. (2007) Nagashima, K., et al., 2007, PASJ, 59, S631
- Parchevsky et al. (2011) Parchevsky, K. V., Zhao, J., Kosovichev, A. G., & Rempel, M. 2011, IAU Sym., 273, 422
- Rempel et al. (2009) Rempel, M., Schüssler, M., Knölker, M. 2009, ApJ, 691, 640
- Scherrer et al. (2012) Scherrer, P. H., Schou, J., Bush, R. I., et al. 2012, Sol. Phys., 275, 207
- Schou et al. (2012) Schou, J., Scherrer, P. H., Bush, R. I., et al. 2012, Sol. Phys., 275, 229
- Snieder & Wapenaar (2010) Snieder, R., & Wapenaar, K. 2010, Phys. Today, 63(9), 44
- Thomas (1985) Thomas, J. H. 1985, Australian J. Phys., 38, 811
- Tian et al. (2014) Tian, H., et al. 2014, ApJ, 786, 137
- Yang et al. (2012) Yang, M.-H., Chou, D.-Y., Zhao, H., & Liang, Z.-C. 2012, ApJ, 755, 10
- Zhao et al. (2011a) Zhao, H., Chou, D.-Y., & Yang, M.-H. 2011a, ApJ, 740, 56
- Zhao et al. (2011b) Zhao, J., Kosovichev, A. G., & Ilonidis, S. 2011b, Sol. Phys., 268, 429
- Zhao et al. (2010) Zhao, J., Kosovichev, A. G., & Sekii, T. 2010, ApJ, 708, 304
- Zirin & Stein (1972) Zirin, H., & Stein, A. 1972, ApJ, 178, L85