From Discs to Bulges: effect of mergers on the morphology of galaxies
Abstract
We study the effect of mergers on the morphology of galaxies by means of the simulated merger tree approach first proposed by Moster et al. This method combines N-body cosmological simulations and semi-analytic techniques to extract realistic initial conditions for galaxy mergers. These are then evolved using high resolution hydrodynamical simulations, which include dark matter, stars, cold gas in the disc and hot gas in the halo. We show that the satellite mass accretion is not as effective as previously thought, as there is substantial stellar stripping before the final merger. The fraction of stellar disc mass transferred to the bulge is quite low, even in the case of a major merger, mainly due to the dispersion of part of the stellar disc mass into the halo. We confirm the findings of Hopkins et al., that a gas rich disc is able to survive major mergers more efficiently. The enhanced star formation associated with the merger is not localised to the bulge of galaxy, but a substantial fraction takes place in the disc too. The inclusion of the hot gas reservoir in the galaxy model contributes to reducing the efficiency of bulge formation. Overall, our findings suggest that mergers are not as efficient as previously thought in transforming discs into bulges. This possibly alleviates some of the tensions between observations of bulgeless galaxies and the hierarchical scenario for structure formation.
keywords:
galaxies: disc, evolution, interactions, structure – methods: numerical, N-body simulation1 Introduction
Galaxy morphologies constitute one of the earliest attempts to classify galaxies, according to the relative prominence of their two main components, i.e. the (spheroidal) bulge and the (exponential) disc. This scheme was originally proposed by Hubble (1926). The nature of the link between the morphological properties of a galaxy and its cosmologically defined evolutionary track is a fundamental question in the field of galaxy formation and evolution.
The standard model of galaxy formation assumes that the gas in dark matter potential wells cools to the center of the well and forms a disc, out of which stars form. Violent dissipative processes such as mergers and close encounters remove the angular momentum from the disc fuelling bulge formation. In a cold dark matter universe (CDM), dark matter (DM) structures grow hierarchically (White & Rees, 1978), with the smaller dark matter haloes forming first and later merging to form bigger ones: this makes interactions between galaxies a fundamental and inescapable process of galaxy evolution. Mergers are considered the origin of the so called “classical” bulges (i.e. whose properties are similar to Elliptical galaxies, see e.g Davies & Illingworth 1983; Dutton et al. 2013), while “pseudo”-bulges (i.e. those characterized by disc-like profiles and/or kinematics, see e.g. Kormendy & Kennicutt 2004) are connected with “in-situ” processes like gravitational instabilities, which leads to the rearrangement of the disc material into a spheroidal-like structure. Additionally, a bulge-dominated galaxy may regrow a new stellar disc, if there is a sufficient supply of cold gas, e.g., from the reservoir of hot gas present in quasi-hydrostatic equilibrium within the gravitational potential of the dark matter halo (see e.g. De Lucia et al. 2011) or through cosmological accretion. The relative efficiency of these processes dictate the morphology of the galaxy.
Many authors have tried to figure out the relative contribution of bulge and disc components of galaxies in the local universe (Weinzirl et al., 2009; Fisher & Drory, 2011). Gadotti (2009) calculated the stellar mass content and distribution for each galaxy component, and showed that, for galaxies more massive than in the local universe, 32 per cent of the total stellar mass is contained in ellipticals, and the corresponding values for discs, bulges and bars are , and respectively. Classical bulges contain of the total stellar mass, while pseudo-bulges contain per cent.
Kormendy et al. (2010) looked at galaxies in the local neighborhood ( Mpc) and find four galaxies consistent with being pure disc galaxies and 7 galaxies, including the Milky Way, having pseudo bulges. Given the dearth of classical bulges in their sample, they thus estimate that around of the galaxies in their sample did not undergo violent mergers in their past and thus they claim that the formation of these massive bulgeless galaxies represents a challenge for current models of galaxy formation. A recent study of the morphological mix in the SDSS volume has been discussed in Wilman & Erwin (2012); they provide the fraction of galaxies showing a given morphological and activity classification as a function of stellar and parent halo masses. They find that the fraction of elliptical galaxies is a strong function of stellar mass; it is also a strong function of halo mass, but only for central galaxies. This is treated as evidence for a scenario where elliptical galaxies are always formed, probably via mergers, as central galaxies within their halos, with satellite ellipticals being previously central galaxies accreted onto a larger halo.
Different theoretical tools have been employed to explain and understand this observational evidence. Bulge formation processes in Semi Analytic Models (SAMs) and their relative importance has been studied in detail in a number of recent papers (De Lucia et al. 2010; Fontanot et al. 2011; Wilman et al. 2013; Porter et al. 2014). The general consensus in these works is that processes like mergers and disc instabilities are key to understanding the morphology of intermediate mass galaxies (): therefore our limited understanding of these mechanisms is a limitation for the models’ ability of reproducing the morphological mix. In particular, Fontanot et al. (2011) showed that the observed abundance of massive galaxies without a classical bulge is consistent with the predicted abundance of bulgeless galaxies only for a model where disc instability process is not considered (see also Porter et al. 2014).
If the angular momentum of a primordial halo is conserved during its collapse then it is sufficient to produce large discs (e.g., Fall & Efstathiou 1980; Mo et al. 1998). Cooling in the highly dense inner regions and dynamical friction of orbital satellites dissipates the angular momentum of the gas (e.g., D’Onghia et al. 2006), thus resulting in compact discs in hydrodynamical N-body simulations, in which the rotation curve peaks at a few , in contradiction to the rotation curves of observed galaxies (e.g., Steinmetz & Navarro 1999; Mayer et al. 2008 ). Springel & Hernquist (2005) and Robertson et al. (2006) showed that in idealized merger simulations with strong stellar feedback it is possible to get a disc dominated remnant, if the initial disc is gas rich. Furthermore, recent cosmological simulations have also been able to form disc galaxies using strong stellar feedback prescriptions (Governato et al., 2007; Guedes et al., 2011; Brook et al., 2012; Martig et al., 2012; Stinson et al., 2013; Kannan et al., 2014; Marinacci et al., 2014a; Christensen et al., 2014).
Hopkins et al. (2009, hereafter H09) quantified the dependence of bulge formation on the gas disc fraction and presented a simple toy model to account for it. They showed that it is possible to obtain disc dominated remnants even for gas rich mergers. This result has major implications for the amount of bulge dominated galaxies found in the local universe (Hopkins et al. 2009).
In this paper we re-examine the disc to bulge transformation during mergers. We adopt a hybrid method, first developed by Moster et al. (2014) which is based on high resolution hydrodynamical simulations of merger systems. The dark matter halo properties and their orbital parameters are directly extracted from cosmological simulations, while the properties of the galaxies hosted by those halos are predicted using a Semi Analytic Model (SAM) of galaxy formation.
In this way we gain the advantages of the merger simulations (high resolution and correct treatment of gas physics) and the SAM (cosmological background). Simultaneously, the computational cost is comparably low, so that a meaningful sample can be modelled in a short amount of time. Given the typical resolution of these hydrodynamical simulations, this method is well suited to resolve the small scales, relevant for the study of the evolution of the stellar components of galaxies and their scale parameters, such as the disc scale length and height, and for the evolution of galaxy morphology. This approach allows us to achieve the best resolution possible within a reasonable amount of time, while being able to model a sample of galaxies in the correct cosmological context.
2 Models
In this section we briefly describe the methods that have been used in this paper. These are, the simulation code pinochio that was employed to generate cosmological merger trees, the SAM morgana used to populate the merger trees with galaxies, the code to create initial conditions and the hydrodynamics code gadget-2 used to perform the merger simulations. Throughout this paper we adopt cosmological parameters chosen to match results from WMAP-3 (Spergel et al., 2007) for a flat CDM cosmological model: , , km s-1 Mpc, and . We adopt a Kroupa (2001) IMF and compute all stellar masses accordingly.
2.1 Merger Tree generation : PINOCCHIO
To construct the Dark Matter halo merger trees we make use of the pinocchio code (Monaco et al., 2002). pinocchio uses a scheme based on Lagrangian perturbation theory, which we briefly describe in the following (see also Taffoni et al. 2002 for a more detailed discussion about the definition of DM haloes and merger trees). A Gaussian linear density contrast field (for the desired cosmological background) is defined on a cubic grid, then smoothed repeatedly with Gaussian filters. For each particle on the grid, the six nearest particles are considered its Lagrangian neighbours. The collapse time of particles (i.e. the time they first belong to a high density, multi-stream region) is then computed for each point of the Lagrangian space, following the definition of orbit crossing proposed in Monaco et al. (2002). Collapsed particles accrete onto individual DM haloes or filaments according to their distance from the centre of mass of neighboring haloes (i.e. those containing at least one of its neighbours): if the distance is smaller than a given fraction of halo size, the collapsed particle then became an accreting particle of the halo. Filament particles can be accreted at later times if any of their neighbour became an accreting particle. Moreover, two DM haloes merge following a similar prescription, i.e. if their distance in Lagrangian space is smaller than a fraction of the size of the more massive object. Overall pinocchio allows a detailed reconstruction of the DM haloes, with known positions, velocities and angular momenta, and of their merger trees, in excellent agreement with the results of N-body simulations, (see e.g. Li et al. 2007), with a very fine time sampling that provides tracking of merging times without restriction to a fixed grid in time (as in N-body simulations). However, at variance to N-body trees pinocchio DM haloes are not allowed to decrease in mass, and the code does not track the evolution of DM substructures once they have been accreted by the main halo: however, these differences do not constitute a limitation in our case, since the mass evolution of DM substructures is explicitly tracked by the hydrodynamical simulation.
2.2 Semi-analytic model: MORGANA
The pinocchio merger trees have then been used as input for the Semi Analytic Model (SAM) morgana (Monaco et al. 2007). In SAMs, the evolution of the baryonic component is followed by means of approximate, yet physically grounded, analytic prescriptions for modelling the relevant processes (such as gas cooling, star formation and feedback) and their interplay, as a function of the physical properties of model galaxies (like their cold gas and stellar content). These analytic prescriptions involve a number of parameters, usually calibrated by comparing model predictions with a well defined set of low-redshift observations. Despite (and thanks to) this simplified approach, SAMs have turned into a flexible and powerful tool to explore a broad range of specific physical assumptions, over scales that could not be directly modelled simultaneously (ranging from the accretion onto a super-massive black hole on sub-pc scales to the Mpc scales involved in cosmological structure formation). In the following we will briefly describe the treatment of the most relevant processes leading to bulge formation in morgana (see De Lucia et al. 2011, for a discussion of the different channels for bulge formation in different SAMs).
morgana distinguishes between minor and major galaxy mergers; the threshold of the two events being defined by a mass ratio between secondary and primary galaxy of 0.3. The orbital decay of dark matter subhaloes and galaxy mergers are modelled using the fitting formulae defined by Taffoni et al. (2003). In case of a minor merger, the stellar mass and the cold gas of the secondary galaxy are completely given to the bulge component of the remnant galaxy, while the disc is considered unaffected. On the other hand, in case of major mergers, the whole stellar and gaseous disc of the merging galaxies are destroyed and relaxed into a spheroidal remnant. In both cases, any cold gas eventually associated with the bulge can be efficiently converted into stars, on very short time-scales (effectively triggering a ‘starburst’). At later times, the remnant spheroidal galaxy can grow a new disc, if cooling processes are effective in the parent halo. In particular for this work, we make use of the standard realization of morgana defined in De Lucia et al. (2011).
2.3 Galaxy models for N-body simulations
We use the method described in Springel et al. (2005) to initialize our galaxies. Each object is composed of five different components: (i) a cold gaseous disc with mass , (ii) a stellar disc ( ), (iii) a stellar bulge ( ), (iv) a gaseous halo ( ) and (v) a dark matter halo ( ).
The gaseous and stellar disc have an exponential surface density profiles and their scale lengths ( and respectively) are related via , with . We adopt a sech2 profile with a scale height for the vertical structure of the stellar disc and the vertical velocity dispersion is set equal to the radial velocity dispersion. The vertical structure of the gaseous disc is computed by requiring balance between the galactic potential and the pressure given by the Equation of State (EOS); the EOS also fixes the temperature of the gas, rather then the velocity dispersion. Finally we adopt an Hernquist profile Hernquist (1990) for both the stellar bulge and the dark matter halo. The stellar bulge has scale length , while the dark matter halo is defined by a scale length , a concentration parameter and a halo spin .
To model the hot gaseous hale we followed the same parameterization of Moster et al. (2011). Namely we use the observational motivated -profile (Cavaliere & Fusco-Femiano 1976, Jones & Forman 1984, Eke et al. 1998):
| (1) |
We use (Jones & Forman, 1984), (Makino et al., 1998) and fix such that the hot gas mass within the virial radius is . The temperature profile is fixed by imposing hydrostatic equilibrium. In addition, we impose a slow rotation around around the spin axis of the discs for the hot halo. The specific angular momentum is defined as and is set to be a multiple of the specific angular momentum of the dark matter halo such that .
High resolution cosmological simulations (Governato et al., 2010, e.g.) have indicated that this “spin factor” is generally larger than unity, as feedback processes preferentially remove low angular momentum material from the halo. For the exact value we have used the results of Moster et al. (2011), who obtained using isolated simulations of a MW-like galaxy and requiring that the evolution of the average stellar mass and scale-length found observationally be reproduced.
2.4 Simulations
The hydrodynamical simulations have been performed with the parallel TreeSPH-code GADGET-2 (Springel, 2005). The code uses Smoothed Particle Hydrodynamics (Lucy 1977 ; Gingold & Monaghan 1977 ; Monaghan 1992) to evolve the gas using an entropy conserving scheme (Springel & Hernquist, 2002). The code includes Radiative cooling for a primordial mixture of hydrogen and helium following Katz et al. (1996) and a spatially uniform time-independent local UV background (Haardt & Madau, 1996). We model Star formation and the associated heating by supernovae (SN) following the sub-resolution multiphase ISM model described in Springel & Hernquist (2003). Cold clouds form stars in dense () regions on a time scale chosen to match observations (Kennicutt, 1998). The threshold density is determined self-consistently by demanding that the equation of state (EOS) is continuous at the onset of star formation.
We also include SN-driven galactic winds following Springel & Hernquist (2003). The wind mass-loss rate is assumed to be proportional to the star formation rate (SFR) , where the mass-loading-factor quantifies the wind efficiency. We assume a constant wind speed model with (energy-driven wind). We refer to Table LABEL:t:smtparameters for the values of further parameters (assuming a Kroupa IMF) describing the multiphase feedback model. We do not include feedback from accreting black holes (AGN feedback) in our simulations.
2.5 Simulations of Semi-Analytic Merger Trees
We use the method devised by Moster et al. (2014) to combine (pinocchio)+SAMS results with high resolution hydrodynamical simulations. As a first step we select a merger tree from the pinocchio simulation, we then use the morgana semi-analytical model to predict the properties of the galaxies hosted in each branch of the tree. The prediction for the properties of the galaxies directly taken from the MORGANA SAM include the masses of the gas disc, stellar disc, stellar bulge, hot gaseous halo and the dark matter halo and the scale lengths of the stellar disc and the stellar bulge. These predictions are used to create a particle based realization of the galaxy (made of dark matter, stars and hot and cold gas, see section 2.3) at the designed started time of the simulation (here ). The number of particles in each component is decided by fixing , which is the total number of stellar particles in the final merger remnant. This then sets the mass of the star particles. We also impose that the mass of DM particle be times more massive than the stars and the gas particles to be times more massive. The typical mass of DM, gas and stars in our simulations are , and respectively. The softening length () of each component ‘i’ of the galaxy is given by , where is the mass the particles of the ‘i’th component. Typically for our simulations this equates to a softening of about about 100 pc for the gas particles, 300 pc for the DM particles and 80 pc for the stars.
This galaxy is then evolved with the hydrodynamical code until the time of its first merger, as predicted by the merger tree. At this point we stop the hydro simulations and create a particle realization of the satellite system, which is also based on the semi-analytic prediction. We then add the satellite in the simulation at the virial radius of the main halo and we restart the hydrodynamical run. The orbital parameters (position and velocity at the time of accretion) are directly taken from the -body simulation, in this way “naturally” creating a cosmologically motivated merger. The system galaxy+satellite is evolved with the hydrodynamical code, until the next satellite galaxy enters the main halo. This process is repeated for all merging satellites until . Table LABEL:t:smtparameters lists all parameters used to construct and run our galaxies (see also Moster et al. (2014) for further details and the exact meaning of all parameters).
| Parameter | Description | Fiducial value |
| Redshift at the start of the simulation | 1.0 | |
| Minimum dark matter mass ratio | 0.03 | |
| Ratio of scaleheight and scalelength of the stellar disc | 0.15 | |
| Ratio of scalelengths between gaseous and stellar disc | 1.5 | |
| Ratio of gaseous halo core radius and dark matter halo scale radius | 0.22 | |
| Slope parameter of gaseous halo | 0.67 | |
| Ratio of specific angular momentum between gaseous and dark halo | 4.0 | |
| Expected final number of stellar particles in the central galaxy | ||
| Ratio of dark matter and stellar particle mass | 15.0 | |
| Ratio of satellite and central galaxy particle mass | 1.0 | |
| Minimum number of particles in one component | 100 | |
| Softening length in kpc for particle of mass | 32.0 | |
| Gas consumption time-scale in Gyr for star formation model | 3.5† | |
| Cloud evaporation parameter for star formation model | 1250.0† | |
| Mass fraction of massive stars for star formation model | 0.16† | |
| Effective supernova temperature in K for feedback model | ||
| Mass loading factor for wind model | 1.0 | |
| Initial wind velocity in for wind model | 500.0 | |
| † The star formation parameters assume a Kroupa IMF. | ||
3 Morphological evolution of galaxies
As mentioned earlier the most important processes which dictate the morphology of galaxies are mergers and close encounters. These processes are known to trigger mass transfer into the central bulge through different channels; the main ones being : (i) accretion of satellite material onto the bulge of the central galaxy (central bulge) during a merger, (ii) the transfer of stars from the disc of the central galaxy (central disc) to central bulge and (iii) funnelling of gas towards the centre and subsequent star formation.
As described in Sec. 2.2, SAMs use simple prescriptions for mass transfer through these channels. Are these prescriptions correct? For example the simple assumption that during a major merger all the material of the central disc goes into the bulge has been contradicted by Hopkins et al. (2009), who showed that discs can survive major mergers if they are gas rich. Chang et al. (2013) showed that a disc dominated satellite is easily tidally stripped as it orbits a halo before it finally mergers, which reduces the amount of material given by the satellite to the central bulge.
Here we test different scenarios using high resolution hydrodynamical simulations of galaxy mergers, starting from the initial conditions given by the semi-analytic model as described in the previous section. We simulate a total of merger events covering a range of different merger histories and galaxy properties. The merger trees and their parameters are given in Table 2. Finally for each tree we also perform an ’isolation’ run, i.e. a run where the central galaxy is evolved without any mergers from to the present time. The isolated runs act as control, which helps to easily dis-entangle the effect of mergers.
| Tree/Sat ID | 222Redshift of entry of the halo | 333Dark Matter merger ratio | 444Baryon merger ratio | 555Dark Matter mass | 666Stellar mass | 777Cold gas mass | 888Circularity parameter |
|---|---|---|---|---|---|---|---|
| Tree 18989 | 1.0 | - | - | 11.70 | 9.92 | 10.06 | - |
| Sat 1 | 0.98 | 0.37 | 0.83 | 11.27 | 9.92 | 9.65 | 0.20 |
| Tree 28678 | 1.0 | - | - | 11.67 | 10.44 | 9.62 | - |
| Sat 1 | 0.46 | 0.56 | 0.16 | 11.47 | 9.66 | 8.74 | 0.44 |
| Tree 80891 | 1.0 | - | - | 11.86 | 10.61 | 9.65 | - |
| Sat 1 | 0.81 | 0.05 | 0.037 | 10.67 | 8.80 | 8.92 | 0.81 |
| Tree 65521 | 1.0 | - | - | 11.81 | 10.48 | 10.21 | - |
| Sat 1 | 0.77 | 0.10 | 0.05 | 10.84 | 9.05 | 8.93 | 0.43 |
| Tree 154448 | 1.0 | - | - | 11.631 | 10.60 | 9.83 | - |
| Sat 1 | 0.67 | 0.97 | 0.74 | 11.651 | 10.74 | 8.79 | 0.42 |
| Tree 215240 | 1.0 | - | - | 11.54 | 9.84 | 9.88 | - |
| Sat 1 | 0.37 | 0.76 | 0.47 | 11.52 | 9.86 | 8.21 | 0.13 |
| Tree 455141 | 1.0 | - | - | 11.39 | 10.14 | 9.54 | - |
| Sat 1 | 0.56 | 0.88 | 0.38 | 11.45 | 9.48 | 9.54 | 0.56 |
| Tree 114590 | 1.0 | - | - | 11.15 | 9.16 | 8.96 | - |
| Sat 1 | 0.92 | 0.86 | 0.84 | 11.10 | 9.12 | 9.32 | 0.71 |
| Tree 28837 | 1.0 | - | - | 11.86 | 10.42 | 9.94 | - |
| Sat 1 | 0.72 | 0.04 | 0.01 | 10.52 | 8.48 | 7.33 | 0.31 |
| Tree 50967 | 1.0 | - | - | 11.86 | 10.34 | 10.17 | - |
| Sat 1 | 0.45 | 0.062 | 0.05 | 10.69 | 8.46 | 8.52 | 0.43 |
| Tree 52201 | 1.0 | - | - | 11.64 | 10.01 | 10.03 | - |
| Sat 1 | 0.34 | 0.66 | 0.51 | 11.53 | 9.76 | 8.825 | 0.75 |
| Tree 53334 | 1.0 | - | - | 11.78 | 10.23 | 9.58 | - |
| Sat 1 | 0.72 | 0.45 | 1.0 | 11.47 | 10.22 | 9.38 | 0.82 |
| Tree 58811 | 1.0 | - | - | 11.78 | 10.36 | 9.65 | - |
| Sat 1 | 0.17 | 0.38 | 0.3 | 11.40 | 9.55 | 9.49 | 0.15 |
| Tree 60367 | 1.0 | - | - | 11.83 | 10.47 | 9.98 | - |
| Sat 1 | 0.39 | 0.03 | 0.007 | 10.41 | 8.40 | 7.42 | 0.77 |
| Tree 61557 | 1.0 | - | - | 11.78 | 10.40 | 10.00 | - |
| Sat 1 | 0.28 | 0.34 | 0.13 | 11.37 | 9.53 | 8.86 | 0.14 |
| Tree 102663 | 1.0 | - | - | 11.92 | 10.76 | 10.10 | - |
| Sat 1 | 0.79 | 0.27 | 0.09 | 11.37 | 9.06 | 9.62 | 0.51 |
| Tree 350 | 1.0 | - | - | 11.90 | 10.77 | 9.84 | - |
| Sat 1 | 0.96 | 0.13 | 0.041 | 11.02 | 9.25 | 8.67 | 0.35 |
| Sat 2 | 0.95 | 0.04 | 0.016 | 10.53 | 8.75 | 8.52 | 0.21 |
| Sat 3 | 0.93 | 0.04 | 0.009 | 10.62 | 8.67 | 7.73 | 0.36 |
| Tree 2536 | 1.0 | - | - | 11.63 | 10.36 | 10.15 | - |
| Sat 1 | 0.79 | 0.12 | 0.025 | 10.75 | 8.76 | 8.28 | 0.69 |
| Sat 2 | 0.75 | 0.29 | 0.312 | 11.20 | 9.98 | 6.20 | 0.66 |
| Sat 3 | 0.46 | 0.19 | 0.135 | 11.18 | 9.46 | 8.94 | 0.31 |
| Tree 187460 | 1.0 | - | - | 10.94 | 9.14 | 9.21 | - |
| Sat 1 | 0.70 | 0.80 | 0.85 | 11.09 | 9.17 | 8.82 | 1.05 |
| Sat 2 | 0.61 | 0.66 | 0.79 | 11.32 | 9.26 | 8.10 | 0.63 |
| Tree 159419 | 1.0 | - | - | 11.05 | 9.08 | 8.26 | - |
| Sat 1 | 0.89 | 0.52 | 0.41 | 10.79 | 8.75 | 7.80 | 0.18 |
| Sat 2 | 0.88 | 0.77 | 0.66 | 11.15 | 9.34 | 8.15 | 0.49 |
3.1 Bulge/Disc Decomposition
There are many different ways to decompose the mass of a galaxy into its basic morphological entities i.e., disc and bulge, for example by fitting surface brightness profiles with a bulge and disc component (e.g., Robertson et al. 2006), kinematic decompositions based on one or two dimensional kinematic maps and three dimensional component fits. All these methods rely heavily on the viewing angle. In this paper we make use of the six dimensional phase space of (), to track the bulge and the disc components of the primary galaxy, throughout the simulation (see also Scannapieco et al. 2010; Marinacci et al. 2014b). The galaxy in question is viewed edge on i.e., the angular momentum vector of the disc is placed parallel to the axis. Now for a purely rotating disc the circular velocity of a given particle, at a distance is given by
| (2) |
and the specific angular momentum of the particle will be
| (3) |
If a particle is purely rotationally supported then the ratio of its specific angular momentum in the direction () and () will be equal to .
| (4) |
If we consider all the stellar component of a sample galaxy from our simulations and plot the distribution of the mass as a function of the rotational support i.e., (Fig. 1), we expect it to be bi-modal with the rotationally supported disc particles distributed around and the velocity dispersion () supported bulge particles grouping around . Decomposing the distribution into bulge and disc components comprises of figuring out the local maxima close . In the simple example shown in Fig. 1 is symmetrical around , meaning that the bulge is non-rotating. This might not be true for many galaxies where the bulge might have some low amount of rotation induced during a merger (for e.g. see right panel of Fig. 2). In order to make a self consistent decomposition, instead of assuming the symmetric nature of around , we calculate the point at which the slope or first derivative of the stellar distribution function becomes zero, particularly points where the slope changes from positive to negative (i.e. local maxima). This takes care of cases where the bulge has a rotation, but this only works if the bulge and disc distributions are quite separated from each other. In some galaxies the two distributions merge and the function no longer has a local maxima. This problem is overcome by calculating the inflection points of this function, especially the points where the second derivate changes sign from negative to positive (i.e. the curve changes from convex to concave). This neatly separates the bulge and disc components even in galaxies where the stellar and bulge distributions overlap quite a bit. It should be mentioned that we look for these local maxima and inflection points only between , beyond which we consider that the galaxy has no bulge component. The stars in the bulge are then assumed to be symmetrically distributed around the local maximum or inflection point, while the disc stars make up the rest of the distribution (as shown in Fig. 1). This technique, by construction has the ability to only statistically determine the bulge and disc components of a simulated galaxy and cannot uniquely classify individual particles as belonging to either of the components. For example in Fig. 1 all particles with have equal probability of being a bulge and disc particle.
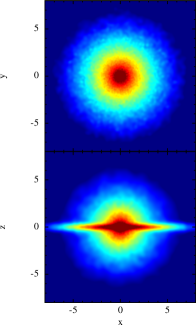
This decomposition on a sample galaxy at redshift z=1, from our catalog (Tree 350) gives a , which is confirmed by the initial conditions taken from the SAM. The stellar density maps (figure 1) also confirm that this is a bulge dominated galaxy.
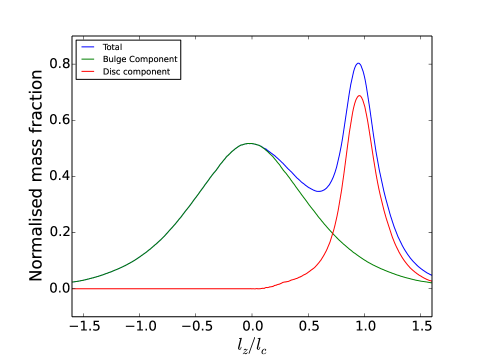
a) The mass distribution of the stellar component of the galaxy as a function of the rotational support. There is clearly a bi-modal distribution, with clear difference between the bulge (green) and disc (red) components. This particular decomposition yields a .
b)The column density of the stellar component shown in projection, perpendicular and parallel to the total angular momentum axis of the galaxy.
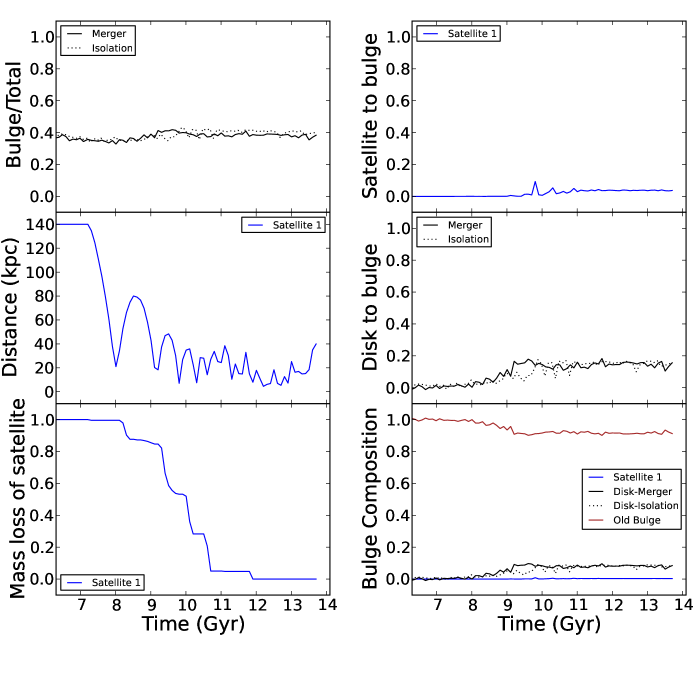
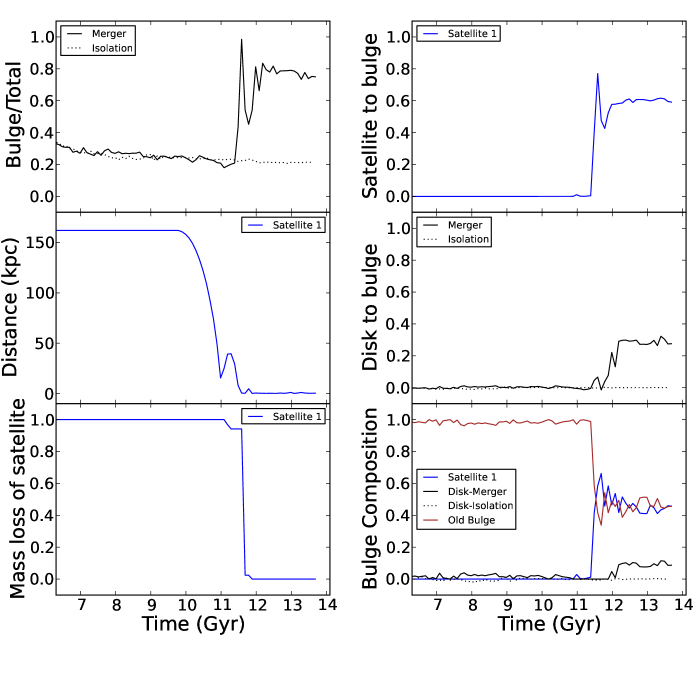
Fig. 2 shows the effect of a minor and major merger events and how the angular momentum distribution of matter in the central galaxy changes in our simulations. A minor merger does not particularly affect the morphology of the galaxy (Fig.2) which remains disc dominated (Tree 65521). On the other hand a multiple major merger completely changes the galaxy morphology as shown in of Fig. 2. A disc dominated galaxy turns into bulge dominated one with a very small hint of a remnant disc (Tree 187460).
This method also allows us the track the mass flow into the central bulge during the whole simulation, as shown in Fig. 3 (Tree 65521; ) and 4 (Tree 18989; ). Every particle in a gadget-2 simulation has a unique ID, and for DM and stars, this ID does not change as a function of simulation time. When we set up the initial conditions we decompose the galaxy into bulge/disc components and make a note of the IDs of the particle in each component. As the simulation evolves in time, the particles are tracked through their unique IDs as they move from one component to other. This allows us to track the various mass transfer channels very efficiently. Since we only look at particles that are present at the start of our simulation we do not track how the morphology of the newly formed stars changes.
We track the stars of the satellite in the same way and we consider that the particle has been unbounded from the satellite if the particle is at a distance , or lies beyond above or below the disc. Some extreme galaxies might have a massive bulge and might have bulge stars above the limit that we have used here. In order to see if this classification is robust we looked at satellite stripping with the stripping radius of above and below the disc of the galaxy. In all the simulations of our sample we get less than changes in all related merging channels when we make this change. This is because even if there is some amount of bulge stars present beyond this height, the density of stars is very low. This makes the error on the channels also quite low. Therefore, we continue to use this definition throughout the paper.
Figures 3 4 show the evolution of various properties as a function of simulation time. The top left panel in these figures show the evolution of the bulge/total ratio of the central galaxy in both merger and isolation. During a minor merger the difference between the B/T ratio is minimal whereas when a galaxy undergoes a major merger the B/T ratio increases considerably. The middle panel on the left shows the distance of the satellite to the central galaxy. Due to the dependence of the merging time on the mass ratio of the merger, a low mass satellite spends more time orbiting the primary galaxy. The bottom panel on the left shows the mass loss of the satellite. The low mass satellite undergoes numerous close encounters, losing most of its mass to the central halo in the process, whereas the high mass satellite has fewer orbits and deposits almost all of its mass into the central bulge. The top panel on the right shows the amount of satellite stellar mass given to the central bulge and it is seen that a minor satellite deposits a very small fraction of its stellar mass into the central bulge owing to the fact that most of its mass is stripped away and lost to the halo during its descent while a massive satellite deposits almost all of its mass into the central bulge as it spends less time orbiting and it is also able to hold on to more of its mass before it merges. The middle panel on the right shows the evolution of the amount of central stellar disc mass given to the central bulge during a merger and in isolation. There is almost no mass transfer from the central disc to the central bulge in case of a minor merger, but during a major merger about of the central stellar disc ends up in the central bulge. This number is very small compared to most SAM prescriptions which assume that almost all the stellar mass of the central disc ends up in the bulge during a major merger. As we will discuss later a large fraction of the central disc gets dispersed into the stellar halo, and a small remnant disc survives. Finally, the bottom panel on the right shows the composition of the central bulge. As expected the low mass satellite contributes little, while a high mass satellite contributes a large amount of material to the bulge and, in the end, it dominates the bulge composition in this particular example.
In the following sections we look closer to the various channels for mass transfer into the bulge and we will also try to quantify them with simple, physically motivated, empirical relations.
3.2 Importance of merger parameters
The major parameters which control the outcome of a merger event is the ratio of masses of a merging galaxies and the their ration of orbital angular momentum. The ratio of the total halo mass of the galaxies () will control the dynamics of infall, while the components which dominate the potential at the center of the halos (stars + cold gas) will provide most of the torque during the final stages of the merger. Hence, we can expect the baryonic (stars + cold gas) merger ratio () to be important as well. In addition we also the dependence of various transfer channels on , the ratio of the amount of total material within two scale radii (calculated here assuming that the DM halo follows a NFW profile) of the halos. This parameter is chosen so as to compare our results to H09.
In addition, previous studies (Chang et al., 2013) have stressed the importance of the satellite orbital parameters in determining the final outcome of the merger. In our approach we extract our merger trees and the satellite orbital parameters directly from cosmological simulations. This ensures that the orbital properties of satellites fall within the gamut of the normally occurring merging paths in the Universe.
The drawback of this method is that, there is no control over the input parameters. This is makes it difficult to make a controlled experiment on the impact of various merger parameters (see for example the GALMER data base; Chilingarian et al. 2010). However it is still important to check the validity of previous works in a full cosmological setting as we do. However, we do try to quantify the effects of the mergers on the galaxy morphology as a function of various parameters. Our analysis is not meant to fully reproduce the dependence of mass transfer on the merger properties (our sample is too small for such a task), but to grasp the main trends and dependencies and provide guidance to test the implications of our findings in broader context.
We look at the most important factors that could affect the mergers. A high mass satellite experiences a high dynamical frictional force and will fall quickly to the center, thereby depositing most of its mass into the bulge of the central galaxy. The opposite is true for low mass mergers. The satellite orbits around the central galaxy many times, losing its mass through repeated close encounters before it merges. The circularity of the orbit can be expressed as a function of the ratio between the orbital angular momentum of the satellite () and the angular momentum of a circular orbit with the same energy as the satellite, i.e.,
| (5) |
Of course the mass transfer in various channels will be directly proportional to the merger ratios , and/or and inversely proportional to . We quantify the dependence on orbit by , where the exponential function and the proportionality factor of comes from the relation between and the total merger time for satellites derived by Boylan-Kolchin et al. (2008) from cosmological simulations. We test the dependence of mass transfer through various channels on the parameters. We use a very simple functional form
| (6) |
which ensures that the boundary value condition of at is satisfied. For each of the mass transfer channels we test its dependence on all the four parameters and six functional forms. Table 3 shows the best fit value of for all the parameters and it also gives the corresponding . We see that the results are not very different for the different merger parameters; moreover, a more sophisticated analysis designed to differentiate between the parameters is not feasible given our limited sample. In fact, the analysis doesn’t provide compelling evidence in favour of adding parameters and/or physical dependencies, with respect to the simple assumption of -parameter linear dependence from a given physical property. Therefore, we just consider dependencies from the parameter providing the overall smaller value, which in our case happens to be , and plot the functional dependence of the transfer channels on from now on.
3.3 Where does the satellite mass end up?
One of the major channels to build up the bulge of a galaxy is through the transfer of material from the satellite directly into the bulge. The morgana model employs a simple set of formulae to evolve the bulge mass during mergers. For example it is assumed that the whole satellite mass is added to the bulge, irrespective of the mass ratio between the satellite and the host and/or the orbit of the satellite.
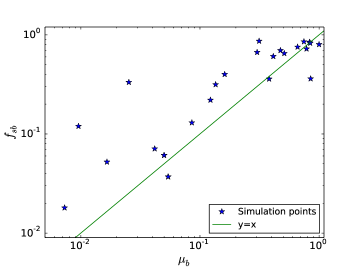
We define as the fraction of the initial (before infall) stellar mass of the satellite given to the central bulge. Figure 5 show the results for from our suite of simulations (blue stars) as a function of . The simulations data show a significant dependence of on the baryonic merger ratio.
The best fit parameters that describe in our simulations are given by:
| (7) |
represented by the green line in figure 5, which is a fair representation of the simulations results (also matches results from H09), while being still simple to implement in semi-analytic models.
3.4 Where does the central disc mass end up?
Another major channel to build up the bulge is the transfer of mass (stars+gas) from the central disc into the central bulge during and after a merger. In the morgana code the following formula is used to determine the mass ( transferred through this channel:
| (8) |
where is the central disc mass (stars and gas). On the other hand the gaseous and stellar components of the disc behave differently as pointed out by H09. They have shown that if the central disc is gas rich then only a small amount of its initial gas disc is funnelled into the bulge. This mass transfer is given by the following relation
| (9) |
where is the fraction of the central disc gas mass transferred to the central bulge, and is the gas fraction of the central disc (ratio between gaseous and stellar disc mass). is the central (within two scale radii) merger ratio as defined by H09 and used in many SAM calculations (see for example Somerville et al. 2012 and Porter et al. 2014).
In this section we show the results of single merger events in our simulations inventory. The effect of multiple mergers on the central disc is very hard to quantify. The mass transfer from the disc to bulge, seems to be dependent not only on the properties of the merging galaxies but also on the time lag between the mergers because it is easier to perturb an already unstable disc. Therefore, quantifying the effect of multiple mergers is quite involved and we defer this to a future paper. In this work we only concentrate on the results from the binary merger simulations, the results of which are shown in Fig. 6. We find an empirical relation for the amount of gas mass transfer into the bulge given by
| (10) |
shown as solid (green) line in figure 6. Therefore, we confirm previous results on the importance of the gas fraction in determining the gas transfer from central disc to central bulge.
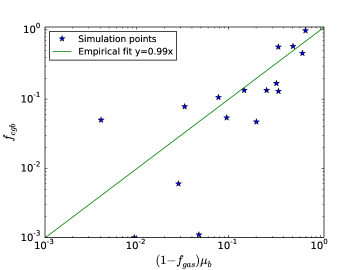
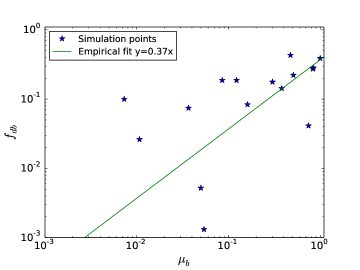
On the other hand we find quite a substantial difference with previous studies for what concerns the fate of the central stellar disc after a merger. Many SAMs assume that all the stellar mass of the central disc ends up in the central bulge after a major merger, while H09 found that this mass transfer is given by
| (11) |
However in our simulations even for a merger the amount of central stellar disc mass that ends up in the central bulge is only about , as shown in Fig. 7. The empirical fit to simulation data points is gives us a relation
| (12) |
where is the fraction of central stellar disc mass that ends up into the bulge.
This result is very interesting and diverges a lot with the simplest picture of major mergers destroying discs, included in most (but not all) SAMs. Now the question arises: where does the rest of the disc end up? Major mergers are very violent events, where a lot of energy (mainly orbital) is quickly transferred to the disc stars. As a consequence a substantial fraction of disc is ejected into the stellar halo. In our simulations the stellar halo is defined as all the stellar content present outside three scale radii of the central disc and/or above or below it. Figure 8 shows the fraction of central disc stellar mass that is dispersed into the stellar halo of the galaxy as a function of the baryonic merger ratio.
A disc destroyed during a major merger does not entirely end up in the newly formed bulge but a significant fraction of its mass, up to , is ejected into the halo. If this mass transfer from the central disc to the halo is neglected then the bulge fraction of galaxies will be significantly overestimated. Recent results from Bernardi et al. (2013) have shown that there is a substantial amount of starlight in the extended envelopes of massive galaxies. Our results show that mergers might be one of the ways to create massive amounts of intercluster light in these galaxies. Empirically we find that the fraction of central disc mass dispersed into the stellar halo during a merger ()is given by
| (13) |
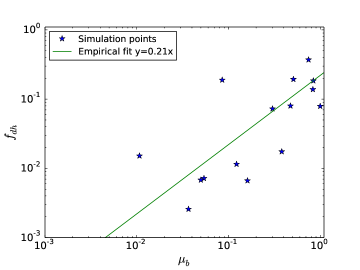
These results show a revised picture of the the fate of a central stellar disc during a major merger. For a binary merger, about of the disc mass loses angular momentum and is then transferred into the bulge. More than the initial mass gains enough energy to escape from the central region and is dispersed into the galactic halo. Finally a small part of the disc is able to survive the merger and form a smaller (thicker) disc structure around the newly formed bulge. These results show that mergers are not as effective as previously thought in creating galactic bulges.
| Transfer Channel | ||||||||||||
|---|---|---|---|---|---|---|---|---|---|---|---|---|
| - | a | a | a | a | a | a | ||||||
| 0.92 | 1.36 | 1.01 | 1.06 | 0.91 | 1.58 | 1.71 | 1.95 | 1.89 | 1.69 | 1.86 | 1.77 | |
| 0.31 | 0.26 | 0.37 | 0.19 | 0.30 | 0.32 | 0.54 | 0.25 | 0.58 | 0.26 | 0.56 | 0.29 | |
| 0.20 | 0.10 | 0.22 | 0.11 | 0.20 | 0.12 | 0.31 | 0.14 | 0.35 | 0.13 | 0.34 | 0.14 | |
| 999All the functional forms include a multiplicative factor of | 0.67 | 0.77 | 0.99 | 0.29 | 0.64 | 0.86 | 1.23 | 0.86 | 1.82 | 0.43 | 1.29 | 0.85 |
3.5 Sites of star formation
There has been a lot of effort put into quantifying the efficiency of merger driven starbursts (Cox et al. 2008, H09, Karman et al. 2015). H09 assume that all the disc gas mass that enters the bulge during a merger will be available for star formation and there is a particular efficiency for the conversion of this gas into stars. Cox et al. (2008) have looked at star burst efficiency of the entire galaxy. The SAMs use these results for starburst efficiency but they assume that star formation mainly takes place in the bulge of the galaxy.
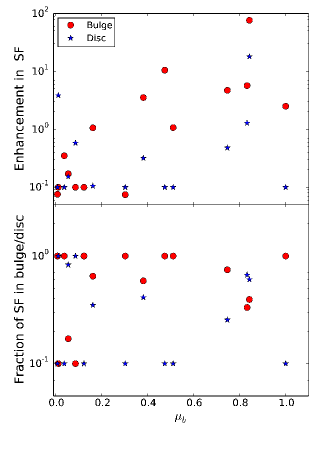
Recent simulations have shown that there is extended clumpy star formation in major mergers (Powell et al., 2013). They find that most mergers have an extended star formation component during the early stages of a merger, but star formation becomes nuclear as the galaxies approach coalescence. Moreno et al. (2015) find that the enhanced star formation in mergers is a combination of intense enhancements within the central kpc and moderately suppressed activity at larger galacto-centric radii. Here we try to distinguish and quantify the amount of star formation in the bulge (central) and disc (extended) components. To do this we look at the amount of new stars formed at the end of the simulation in the remnant compared to the new stars formed in the isolation run. This additional star formation is then due to just the merger. Our definition of the SF enhancement include stars formed in the satellite as well. A more sophisticated analysis of the merger driven star formation rates is presented in a complementary work (Karman et al., 2015), but the general trends are investigated here.
The top panel of Fig 9 shows the fractional change in star formation rate, i.e., the star formation in merger simulation minus star formation in isolated galaxy divided by the star formation in isolated galaxy, as a function of the merger ratio for both bulge (red circles) and disc (blue stars) component. We see that in most cases the star formation is enhanced both in the bulge and the disc. For very minor mergers we see an increase in SF by about in both the bulge and disc, whereas in major mergers the SF in the bulge can be enhanced as high as times the original value. On the other hand there is relatively low enhancement (of about times) in the SF in the disc during a merger.
We can then turn the previous plot around and look at, for a particular enhancement in SF, what fraction of it takes place in the bulge and disc. The bottom panel of fig.9 shows the fraction of SF enhancement which takes place in the bulge and disc. In most mergers most of the star formation occurs in the bulge, but quite a few merger scenarios do show that the star formation can be triggered in discs as well. Our results seem to suggest that the relative contribution of disc starburst to the overall star formation enhancement is larger for minor mergers. In order to confirm and further quantify this effect higher resolution simulations are needed that go beyond the scope of this paper.
3.6 Hot halo
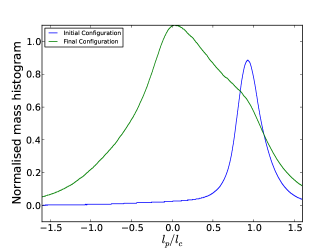
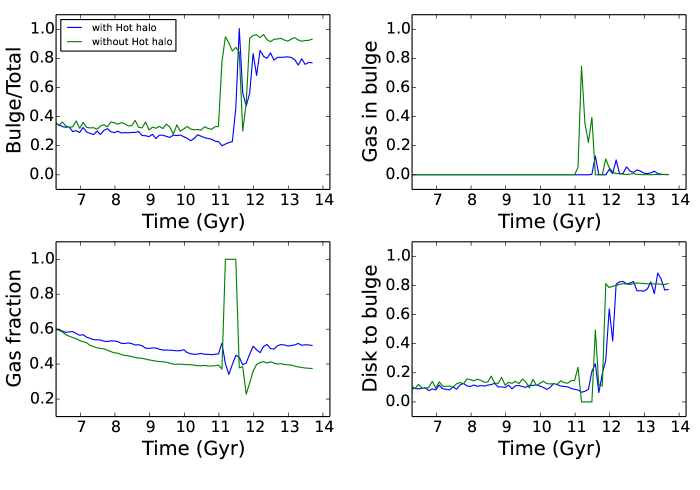
Previously, simulations which have included hot haloes, have looked into its effects in both minor mergers and major mergers in non-cosmological setting (Moster et al. 2011, Moster et al. 2012) and on the star formation rates (Kim et al., 2009). It is then interesting to check what role the hot halo plays in these cosmologically motivated merger simulations. We perform a new simulation for Tree (chosen for its conveniently large merger ratio ) without including the hot halo (both in the models of the primary and the satellite galaxies), but keeping all other components the same (stars, cold gas and dark matter).
Figure 10 shows the comparison between the two runs for various properties as a function of time. Without a hot halo (green curves) the primary galaxy becomes completely bulge dominated after the merger, as shown in the upper left panel. The ratio increases from a value of about in the run with the hot halo (blue curves) to when the hot gas reservoir is removed. This is due to the fact that the hot halo replenishes the disc of the galaxy, keeping it gas rich as shown on the bottom left panel (gas fraction of primary disc). This in turn helps the gas disc to survive the merger (eg. H09 and Eq. 10 of this work). This can be seen in the top right panel of Fig. 10. We can also see that the stellar mass transfer to the bulge from the disc remains unaffected and does not depend on the gas fraction of the disc (bottom right panel). The hot halo also provides a continuous supply of cold gas for SF which allows for higher rate of disc regrowth after merger (De Lucia et al., 2011). All together it is clear that the inclusion of a hot halo has several effects on the the final bulge to total ratio, since this hot gas reservoir is crucial for keeping the disc gas rich and for disc regrowth after a merger. Hence this component is important and should be taken into account in numerical studies of mergers of galaxies (see also Moster et al. 2012).
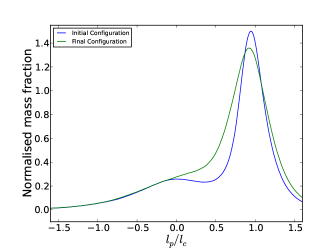
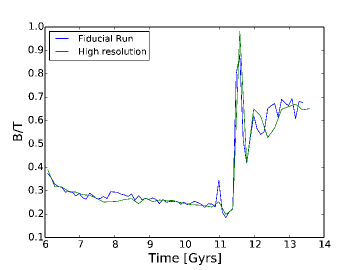
3.7 Effect of resolution
To test the effect of resolution we simulated Tree 215240 () at a higher resolution, containing two times more particles than the fiducial run, i.e., stellar particles in the final merger remnant. This also decreases the softening lengths by a factor of . All the other simulation parameters are the same as used in the fiducial run. Fig. 11 shows the bulge to total ratio for both the fiducial and high resolution simulations. Encouragingly, the different resolution runs match quite well. There are however, some subtle differences between the runs. The disc of the higher resolution run seems to be a bit more stable to perturbations than the fiducial run. This is evidenced more clearly after the merger takes place. The disc of the primary in the fiducial run is excited and there seems to be a larger perturbations on the low resolution disc as evidenced by the larger variation of the B/T ratio on short timescales. The general behaviour, however, is quite well converged. Although, we only show the comparison of the evolution of the B/T ratio, we checked the other mass transfer channels and they all seem to be well converged with respect to resolution as well.
4 Discussion and conclusions
Theoretical models of galaxy formation and evolution usually assume that star formation in galaxies mainly occurs in a disc-like structure as a consequence of the conservation of angular momentum acquired by their host DM haloes. In such a scenario spheroidal structures like bulges are created by dissipative mechanisms, like galaxy mergers and disc instabilities, which remove angular momentum from stars and gas, funnelling them towards the centre of galaxy. Most theoretical models, like SAMs, employ simplified formulae for dealing with these mass transfer processes, in the idealized approximation of a sequence of binary mergers.
In this paper, we analyse in full detail the physics of galaxy mergers, and how mergers change the morphology of galaxies, with particular emphasis on the mass transfer processes between the different components of the merging galaxies. Our approach (first presented and described in Moster et al. 2014) consists of using high resolution smoothed particle hydrodynamic simulations of galaxy mergers where the initial conditions are taken from a combination of cosmological realization of dark matter haloes merger trees and semi-analytic models. The cosmological merger trees ensure that the orbits and merger timings of DM substructures are cosmologically consistent, while the SAM modelling provides a reasonable guess for the properties of galaxies living in these haloes.
We run a series of simulations from to , including both single and multiple mergers and we quantify the amount of morphological transformation in these model galaxies. We decompose the bulge and disc component of model galaxies using all the six dimensional phase space of position and velocity and considering the mass distribution as a function of the rotational support. This decomposition approach is very robust and allows us to track mass transfers from the satellite to the bulge, from the initial disc to the bulge, the mass of the disc dispersed into the stellar halo of the galaxy and the evolution. This then allows us the quantify the amount of mass transfer in each channel as a function of the merger parameters.
Mass transfers from the satellite to the bulge: In major mergers most of the satellite’s mass is deposited into the bulge of the central galaxy. On the other hand, a small satellite galaxy deposits most of its baryonic mass into the halo (due to stellar stripping and ram pressure) before its final coalescence with the central object.
Mass transfers from the central disc to the central bulge: The interaction with the incoming satellite causes matter inflows from the central disc to the central bulge. We confirm the findings of H09, that a gas rich disc is able to survive mergers more effectively. We note here that we do not resolve the small scale physics of the ISM, instead choosing to model it using an effective EOS (Springel & Hernquist, 2003). This model provides a high thermal pressure support in the ISM, which smoothes out any instabilities in the disc. This model works quite well for low redshift redshift galaxies which are not highly star forming. At high redshifts the ISM is usually very turbulent and clumpy. Recent studies have shown that masses and sizes of disc components that survive a major merger are severely reduced when the hydrodynamics of the high redshift ISM are modelled properly (Bournaud et al., 2011). Since the starting point of our simulations is , the disc is expected to be much more calm. Therefore the ISM model used in our work is quite sufficient to capture the physics of mergers at the redshifts we consider.
However, our results show that the amount of central stellar disc mass transferred to the central bulge is quite low. Even for mergers only of the central stellar disc is given to the central bulge. In addition a fraction of the central disc mass is expelled outwards due to close gravitational encounters (about for mergers), adding up to the diffuse stellar halo population. This mass transfer channel is generally poorly modelled in many SAMs.
Merger driven star formation: Our results also confirm that there is a sharp enhancement of star formation during a merger. Many SAMs assume that all of the merger driven starburst takes places in the bulge. However, our simulations echo recent results (Powell et al., 2013; Moreno et al., 2015), which show that there is an enhancement of star formation in the discs of central galaxies in addition to the enhancement in the bulge. As expected, larger starbursts are attributed to major mergers, but the relative contribution of disc starburst to the overall star formation enhancement is larger for minor mergers.
Effect of hot halo: One of the major improvements of this work, with respect to previous similar attempts, lies in the modelling of a hot gaseous halo component: the existence of such a component (in addition to the cold phase present in the disc of the galaxy) is predicted by cosmological simulations (e.g. Sommer-Larsen 2006; Johansson et al. 2009; Rasmussen & Ponman 2009; Hansen et al. 2011) and observations (e.g. Owen & Warwick 2009, Anderson et al. 2013). The hot gaseous halo affects the final bulge to total ratio of the galaxy: in fact it is able to replenish the galaxy disc with fresh infalling cold gas, keeping it gas rich and fuelling disc star formation over longer time scales.
We thus propose a series of new fitting formulae able to capture the trends in the relations between the amplitude of mass transfers and baryonic (stars + cold gas) merger ratio. We are well aware of the limitation of our analysis, a relatively small sample of simulated haloes. More work is of course needed to increase the simulation sample, including more merger trees at different mass scales and widening the range of orbital/merger parameter. This larger sample would then provide us with better constrains on both the mean relations and their scatter, as well as a testbed for extreme cases, such as multiple merger scenarios. Despite the small sample considered in this paper, our results are indicative of a need for revision in our understanding of mass flows involved in a galaxy merger. In a work (Fontanot et al., in preparation), we plan to include our fitting formulae in state-of-the-art SAMs, to study the implications of our findings on a cosmologically significant galaxy sample, in determining the fraction of bulge and disc dominated galaxies.
Overall our study shows that the combined effect of satellite accretion and disc destruction in building bulges is not as efficient as previously thought and this will possibly alleviate some of the tensions between the observed fraction of bulgeless galaxies and the hierarchical scenario for structure formation as predicted by the CDM model.
Acknowledgments
The numerical simulations used in this work were performed on the THEO cluster of the Max-Planck-Institut für Astronomie at the Rechenzentrum in Garching. RK and AVM acknowledge the support of SFB 881 (subproject A1) of the German research foundation (DFG). FF acknowledges financial support from the Klaus Tschira Foundation and the Deutsche Forschungsgemeinschaft through Transregio 33, “The Dark Universe”.
References
- Anderson et al. (2013) Anderson M. E., Bregman J. N., Dai X., 2013, ApJ, 762, 106
- Bernardi et al. (2013) Bernardi M., Meert A., Sheth R. K., Vikram V., Huertas-Company M., Mei S., Shankar F., 2013, MNRAS, 436, 697
- Bournaud et al. (2011) Bournaud F., Chapon D., Teyssier R., Powell L. C., Elmegreen B. G., Elmegreen D. M., Duc P.-A., Contini T., Epinat B., Shapiro K. L., 2011, ApJ, 730, 4
- Boylan-Kolchin et al. (2008) Boylan-Kolchin M., Ma C.-P., Quataert E., 2008, MNRAS, 383, 93
- Brook et al. (2012) Brook C. B., Stinson G., Gibson B. K., Wadsley J., Quinn T., 2012, MNRAS, 424, 1275
- Cavaliere & Fusco-Femiano (1976) Cavaliere A., Fusco-Femiano R., 1976, A&A, 49, 137
- Chang et al. (2013) Chang J., Macciò A. V., Kang X., 2013, MNRAS
- Chilingarian et al. (2010) Chilingarian I. V., Di Matteo P., Combes F., Melchior A.-L., Semelin B., 2010, A&A, 518, A61
- Christensen et al. (2014) Christensen C. R., Brooks A. M., Fisher D. B., Governato F., McCleary J., Quinn T. R., Shen S., Wadsley J., 2014, MNRAS, 440, L51
- Cox et al. (2008) Cox T. J., Jonsson P., Somerville R. S., Primack J. R., Dekel A., 2008, MNRAS, 384, 386
- Davies & Illingworth (1983) Davies R. L., Illingworth G., 1983, ApJ, 266, 516
- De Lucia et al. (2010) De Lucia G., Boylan-Kolchin M., Benson A. J., Fontanot F., Monaco P., 2010, MNRAS, 406, 1533
- De Lucia et al. (2011) De Lucia G., Fontanot F., Wilman D., Monaco P., 2011, MNRAS, 414, 1439
- D’Onghia et al. (2006) D’Onghia E., Burkert A., Murante G., Khochfar S., 2006, MNRAS, 372, 1525
- Dutton et al. (2013) Dutton A. A., Treu T., Brewer B. J., Marshall P. J., Auger M. W., Barnabè M., Koo D. C., Bolton A. S., Koopmans L. V. E., 2013, MNRAS, 428, 3183
- Eke et al. (1998) Eke V. R., Navarro J. F., Frenk C. S., 1998, ApJ, 503, 569
- Fall & Efstathiou (1980) Fall S. M., Efstathiou G., 1980, MNRAS, 193, 189
- Fisher & Drory (2011) Fisher D. B., Drory N., 2011, ApJL, 733, L47
- Fontanot et al. (2011) Fontanot F., De Lucia G., Wilman D., Monaco P., 2011, MNRAS, 416, 409
- Gadotti (2009) Gadotti D. A., 2009, MNRAS, 393, 1531
- Gingold & Monaghan (1977) Gingold R. A., Monaghan J. J., 1977, MNRAS, 181, 375
- Governato et al. (2010) Governato F., Brook C., Mayer L., Brooks A., Rhee G., Wadsley J., Jonsson P., Willman B., Stinson G., Quinn T., Madau P., 2010, Nature, 463, 203
- Governato et al. (2007) Governato F., Willman B., Mayer L., Brooks A., Stinson G., Valenzuela O., Wadsley J., Quinn T., 2007, MNRAS, 374, 1479
- Guedes et al. (2011) Guedes J., Callegari S., Madau P., Mayer L., 2011, ApJ, 742, 76
- Haardt & Madau (1996) Haardt F., Madau P., 1996, ApJ, 461, 20
- Hansen et al. (2011) Hansen S. H., Macció A. V., Romano-Diaz E., Hoffman Y., Brüggen M., Scannapieco E., Stinson G. S., 2011, ApJ, 734, 62
- Hernquist (1990) Hernquist L., 1990, ApJ, 356, 359
- Hopkins et al. (2009) Hopkins P. F., Cox T. J., Younger J. D., Hernquist L., 2009, ApJ, 691, 1168
- Hopkins et al. (2009) Hopkins P. F., Somerville R. S., Cox T. J., Hernquist L., Jogee S., Kereš D., Ma C.-P., Robertson B., Stewart K., 2009, MNRAS, 397, 802
- Hubble (1926) Hubble E. P., 1926, ApJ, 64, 321
- Johansson et al. (2009) Johansson P. H., Naab T., Ostriker J. P., 2009, ApJL, 697, L38
- Jones & Forman (1984) Jones C., Forman W., 1984, ApJ, 276, 38
- Kannan et al. (2014) Kannan R., Stinson G. S., Macciò A. V., Hennawi J. F., Woods R., Wadsley J., Shen S., Robitaille T., Cantalupo S., Quinn T. R., Christensen C., 2014, MNRAS, 437, 2882
- Karman et al. (2015) Karman W., Maccio A. V., Kannan R., Moster B. P., Somerville R. S., 2015, ArXiv e-prints
- Katz et al. (1996) Katz N., Weinberg D. H., Hernquist L., 1996, ApJS, 105, 19
- Kennicutt (1998) Kennicutt Jr. R. C., 1998, ApJ, 498, 541
- Kim et al. (2009) Kim J.-h., Wise J. H., Abel T., 2009, ApJL, 694, L123
- Kormendy et al. (2010) Kormendy J., Drory N., Bender R., Cornell M. E., 2010, ApJ, 723, 54
- Kormendy & Kennicutt (2004) Kormendy J., Kennicutt Jr. R. C., 2004, ARA&A, 42, 603
- Kroupa (2001) Kroupa P., 2001, MNRAS, 322, 231
- Li et al. (2007) Li Y., Hernquist L., Robertson B., Cox T. J., Hopkins P. F., Springel V., Gao L., Di Matteo T., Zentner A. R., Jenkins A., Yoshida N., 2007, ApJ, 665, 187
- Lucy (1977) Lucy L. B., 1977, AJ, 82, 1013
- Makino et al. (1998) Makino N., Sasaki S., Suto Y., 1998, ApJ, 497, 555
- Marinacci et al. (2014a) Marinacci F., Pakmor R., Springel V., 2014a, MNRAS, 437, 1750
- Marinacci et al. (2014b) Marinacci F., Pakmor R., Springel V., 2014b, MNRAS, 437, 1750
- Martig et al. (2012) Martig M., Bournaud F., Croton D. J., Dekel A., Teyssier R., 2012, ApJ, 756, 26
- Mayer et al. (2008) Mayer L., Governato F., Kaufmann T., 2008, Advanced Science Letters, 1, 7
- Mo et al. (1998) Mo H. J., Mao S., White S. D. M., 1998, MNRAS, 295, 319
- Monaco et al. (2007) Monaco P., Fontanot F., Taffoni G., 2007, MNRAS, 375, 1189
- Monaco et al. (2002) Monaco P., Theuns T., Taffoni G., 2002, MNRAS, 331, 587
- Monaco et al. (2002) Monaco P., Theuns T., Taffoni G., Governato F., Quinn T., Stadel J., 2002, ApJ, 564, 8
- Monaghan (1992) Monaghan J. J., 1992, ARA&A, 30, 543
- Moreno et al. (2015) Moreno J., Torrey P., Ellison S. L., Patton D. R., Bluck A. F. L., Bansal G., Hernquist L., 2015, MNRAS, 448, 1107
- Moster et al. (2014) Moster B. P., Macciò A. V., Somerville R. S., 2014, MNRAS, 437, 1027
- Moster et al. (2011) Moster B. P., Macciò A. V., Somerville R. S., Naab T., Cox T. J., 2011, MNRAS, 415, 3750
- Moster et al. (2012) Moster B. P., Macciò A. V., Somerville R. S., Naab T., Cox T. J., 2012, MNRAS, 423, 2045
- Owen & Warwick (2009) Owen R. A., Warwick R. S., 2009, MNRAS, 394, 1741
- Porter et al. (2014) Porter L. A., Somerville R. S., Primack J. R., Johansson P. H., 2014, MNRAS, 444, 942
- Powell et al. (2013) Powell L. C., Bournaud F., Chapon D., Teyssier R., 2013, MNRAS, 434, 1028
- Rasmussen & Ponman (2009) Rasmussen J., Ponman T. J., 2009, MNRAS, 399, 239
- Robertson et al. (2006) Robertson B., Bullock J. S., Cox T. J., Di Matteo T., Hernquist L., Springel V., Yoshida N., 2006, ApJ, 645, 986
- Scannapieco et al. (2010) Scannapieco C., Gadotti D. A., Jonsson P., White S. D. M., 2010, MNRAS, 407, L41
- Somerville et al. (2012) Somerville R. S., Gilmore R. C., Primack J. R., Domínguez A., 2012, MNRAS, 423, 1992
- Sommer-Larsen (2006) Sommer-Larsen J., 2006, ApJL, 644, L1
- Spergel et al. (2007) Spergel D. N., Bean R., Dore O., al e., 2007, ApJS, 170, 377
- Springel (2005) Springel V., 2005, MNRAS, 364, 1105
- Springel et al. (2005) Springel V., Di Matteo T., Hernquist L., 2005, MNRAS, 361, 776
- Springel & Hernquist (2002) Springel V., Hernquist L., 2002, MNRAS, 333, 649
- Springel & Hernquist (2003) Springel V., Hernquist L., 2003, MNRAS, 339, 289
- Springel & Hernquist (2005) Springel V., Hernquist L., 2005, ApJL, 622, L9
- Steinmetz & Navarro (1999) Steinmetz M., Navarro J. F., 1999, ApJ, 513, 555
- Stinson et al. (2013) Stinson G. S., Brook C., Macciò A. V., Wadsley J., Quinn T. R., Couchman H. M. P., 2013, MNRAS, 428, 129
- Taffoni et al. (2003) Taffoni G., Mayer L., Colpi M., Governato F., 2003, MNRAS, 341, 434
- Taffoni et al. (2002) Taffoni G., Monaco P., Theuns T., 2002, MNRAS, 333, 623
- Weinzirl et al. (2009) Weinzirl T., Jogee S., Khochfar S., Burkert A., Kormendy J., 2009, ApJ, 696, 411
- White & Rees (1978) White S. D. M., Rees M. J., 1978, MNRAS, 183, 341
- Wilman & Erwin (2012) Wilman D. J., Erwin P., 2012, ApJ, 746, 160
- Wilman et al. (2013) Wilman D. J., Fontanot F., De Lucia G., Erwin P., Monaco P., 2013, MNRAS, 433, 2986