Pressure-Induced Structural Phase Transition in CeNi: X-ray and Neutron Scattering Studies and First-Principles Calculations
Abstract
The pressure-induced structural phase transition in the intermediate-valence compound CeNi has been investigated by X-ray and neutron powder diffraction techniques. For the first time it is shown that the structure of the pressure-induced CeNi phase (phases) can be described in terms of the space group. Equations of state for CeNi on both sides of the phase transition are derived and an approximate phase diagram is suggested for GPa and K. The observed structural transition is analyzed using density functional theory (DFT) calculations, which successfully reproduce the ground state volume, the phase transition pressure, and the volume collapse associated with the phase transition.
pacs:
71.27.+a, 71.20.Eh, 61.50.Ks, 61.05.cp, 61.05.fmI INTRODUCTION
The 4-metals, and their alloys and intermetallic compounds exhibit rich pressure-temperature-composition phase diagrams. Often, transitions between different phases are accompanied by a dramatic change in the material properties, including abrupt volume variation, and in particular the extent to which the electron localization changes under such phase transitions is of great scientific interest.
The transition between localized and itinerant behaviour is at the forefront of physics of strongly correlated systems. Such a transition occurs in the 5 electron shell of the pure actinide metals - the 5 electrons behave in a localized fashion in the heavy actinides but in a more delocalized manner in the light actinides - centering near Pu and Am. A quantitative and conclusive understanding of this phenomenon is still missing.Tobin et al. (2005) In the lanthanide series, where the 4 orbitals are spatially less extended than the 5 orbitals in the actinides, localized-itinerant transitions occur at the beginning (around Ce), in the middle (Sm, Eu) and at the end (Yb). Application of high pressure leads to a 4 delocalization and, in some cases, to structural phase transformations accompanied by a volume discontinuity. The most famous example is cerium, which exhibits the isostructural volume-collapse phase transition upon either cooling or application of external pressure. Several interpretations have been suggested to explain the origin of this phenomenon however its nature is still widely debated.Chakrabarti et al. (2014); Lanatà et al. (2013, 2014) The intermediate-valence compound CeNi represents another interesting example of a system experiencing a pressure-induced structural instability.
CeNi has the CrB-type orthorhombic crystal structure (space group ) with the room-temperature crystal lattice parameters Å, Å, Å.Tinney and Rosenzweig (1961) The orthorhombic crystal structure repeatedly appears in rare-earth and actinide metals under pressure such as -Ce, Pa, Nd, and Pr. The -U metal also has this type of structure which is usually stable up to very high pressures. Of course, at hundreds of GPa of pressures, closed-packed metal structures, such as fcc, hcp, and bcc, are once again favored due to large electrostatic repulsions ruling out the more open and lower symmetry structures. CeNi shows a different behavior. Already at ambient pressure CeNi displays clear signatures of lattice instability upon cooling,Clementyev et al. (1998) but a structural transformation does not occur down to the lowest temperature. In 1985 Gignoux and Voiron found a pressure-induced first-order structural phase transition in CeNi and determined its phase diagram up to 0.5 GPa and 150 K.Gignoux and Voiron (1985); Gignoux et al. (1987) Later the CeNi phase diagram was extended up to 2 GPa and 300 K using neutron diffraction and magnetic measurements.Mirmelstein et al. (2009) However, neither the space group nor atomic positions of the pressure-induced CeNi phase were established at the time.
Here we report the results of two diffraction studies performed to investigate the pressure-induced structural phase transition in CeNi. The first study was performed at room temperature using X-ray diffraction, and the second study employed neutron powder diffraction at 100 K. In both the cases we observed a pressure-induced structural phase transition in CeNi accompanied by a volume jump. The results obtained show that the structure of pressure-induced CeNi phase (phases) can be described with the space group. We show that density functional theory (DFT) calculations successfully reproduce the ground state volume, the phase transition pressure, and the volume collapse associated with the phase transition.
II EXPERIMENTAL
Stoichiometric amounts of elemental reactants, Ce (chunks, Ames) and Ni (Alfa) were loaded into alumina crucibles, which were baked at 800∘ C prior to use, and then placed inside quartz tubes. Additional alumina crucibles containing Zr pieces were placed on top as potential oxygen sponges during sample synthesis process. The quartz tubes were sealed under vacuum, and subsequently heated in box furnaces at 800∘ C for 6 hours, followed by 1∘ C/h cooling to 600∘ C. The phase purity of the synthesized samples was verified using X-ray powder diffraction and magnetization measurements which showed that the desired CeNi phase ( space group) had formed with a small amount of an impurity phase (% of CeNi2). Magnetization measurements performed with a commercial Physical Properties Measurement System (Quantum Design) showed good agreement with the published data.Clementyev et al. (1998)
Room temperature high-pressure synchrotron powder diffraction measurements were carried out at beamline 17-BM at the Advanced Photon Source using a 100 micron monochromated X-ray beam at a wavelength of Å. Variable pressure diffraction data were collected in situ using a Perkin Elmer amorphous-Si flat panel detector centered on the X-ray beam. The sample-to-detector distance was nominally set at 300 mm, yielding an available 2 scattering angle of 27.5 deg., corresponding to access of Bragg reflections with -spacing as low as 1.52 Å. The diffractometer geometrical parameters (such as precise sample-to-detector distance and tilt of the detector) were optimized with respect to a NIST a LaB6 (660a) standard.
The CeNi powdered sample was loaded in a membrane-driven diamond anvil cell fitted with a pair of 800 micron culet diamonds. The gasket was made from 250 m thick full-hard 301 stainless steel, pre-indented to about 120 m and drilled with a 400 m hole. Gold was added to the sample as a pressure manometer and silicone oil was used as pressure transmitting medium. The pressure on the DAC membrane was increased in 25 steps up to a maximum sample pressure of 7.8 GPa. The pressure values were determined by fitting the measured gold unit cell volume to a third-order Birch-Murnaghan equation of state (EOS)Murnaghan (1944); Birch (1947) using the parameters V Å3, B GPa, and B, where V0 is the Au primitive cell volume at ambient conditions, B0T is the bulk modulus, and B is its first pressure derivative.Fei et al. (2007)
Time-of-flight neutron diffraction measurements at 100 K were performed at the Spallation Neutrons and Pressure (SNAP) beamline of the Spallation Neutron Source at Oak Ridge National Laboratory. Neutron detectors were located at 50 deg. and 90 deg. with respect to the incident beam. The sample-to-detector distance was 50 cm. The accessible range in this configuration extended from 30 deg. to 115 deg., up to ±7.5 deg. out of the scattering plane. The wavelength range of the neutrons was between 0.3 Åand 3.7 Å, which allows a sampling of Bragg reflections between Å. The incident beam final collimation is a rectangular aperture measuring 15 mm, designed to match the sample shape and the beam divergence. For sample loading a pellet was made from powdered CeNi mixed with Pb, which serves a dual role of pressure calibration standard and pressure transmitting medium. Pressure was generated in a Paris-Edinburgh high-pressure press fitted with boron nitride (BN) toroidal anvilsBesson et al. (1992) and using a null scattering (TiZr) alloy that adds no coherent Bragg scattering to the data. The equatorial configuration of the cell was chosen allowing a wide angular aperture for the scattered beam. For reference, we also measured the room temperature neutron diffraction pattern of the pressure cell filled with CeNi and Pb at SNAP and used the standard value of the Pb crystal lattice constant Å Owen and Yates (1933) for fitting. To cool the pressure cell down to 100 K we used liquid nitrogen flow. After cooling, the Pb crystal lattice parameter was refined for every measurement to determine the actual pressure values using a third-order Birch-Murnaghan EOSMurnaghan (1944); Birch (1947) with measured value V0(=100 K) Å3 and the parameters B GPa and B from work of Schulte and Holzapfel.Schulte and Holzapfel (1995)
To index the high-pressure (HP) phases we used the POWDERCELLKraus and Nolze (1996) and DICVOL06Boultif and Louër (2004) program packages. Neutron diffraction data reduction was done using the Mantid software suite.Arnold et al. (2014) Structural parameters were refined with the FullProf software.Rodríguez-Carvajal (1993)
III EXPERIMENTAL RESULTS
Figure 1 shows the integrated X-ray diffraction (XRD) intensities for the CeNi sample along with the gold pressure standard as a function of increasing pressure at room temperature. The peaks observed around 18 and 21 degrees are (111) and (200) Bragg reflections of Au used for pressure determination. The low pressure (LP) CeNi structure remains stable from ambient pressure up to GPa. Between 0.7 and 2.1 GPa the XRD patterns of CeNi exhibit remarkable changes. In particular, the appearance of new peaks around 15, 17.5 deg. and the suppression of diffraction peaks at 8, 12, 15.5, 16 deg. clearly indicate a pressure-induced phase transition. Above 2.1 GPa only subtle variations of peak positions and intensities are observed, however upon further increase in pressure a new diffraction pattern develops suggesting one more structural transformation starting at GPa.
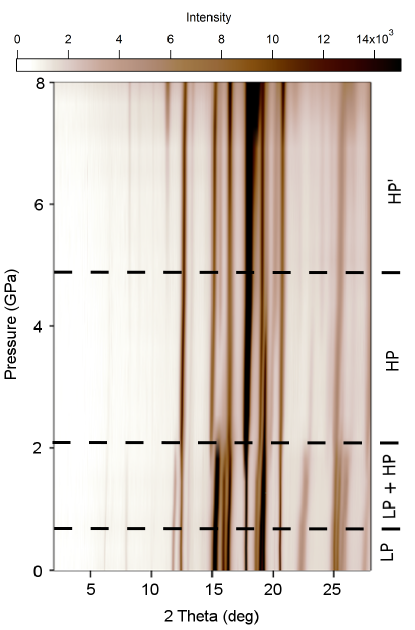
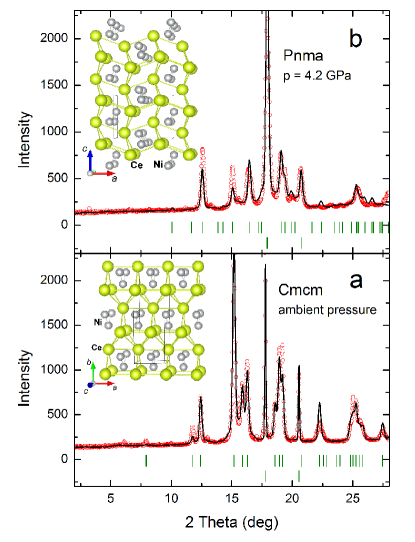
Figure 2 shows typical XRD patterns obtained for the LP and HP phases of CeNi. The CeNi LP phase (below GPa) adopts the CrB-type orthorhombic structure described by the space group. The CeNi primitive cell contains two Ce and two Ni ions, both located at (4c) Wyckoff positions. A Rietveld refinement at ambient pressure resulted in the following structural parameters: Å, Å, Å, (Ce), (Ni), which is in good agreement with values previously reported in the literature.Tinney and Rosenzweig (1961); Gignoux and Gomez-Sal (1984)
The measured XRD pattern of the HP phase (pressure range between 2.1 and 4.9 GPa) was indexed to belong to the FeB-type orthorhombic crystal structure ( space group). For example, the Rietveld refinement resulted in the following structural parameters at GPa: Å, Å, Å, (Ce), (Ce), (Ni), (Ni) (Fig. 2). Within the structural transition region at GPa the X-ray diffraction pattern is described as a superposition of diffraction patterns resulting from 212 volume percent of CrB-phase and 797 volume percent of FeB-phase. Attempts to refine the CeNi crystal structure from the powder diffraction patterns at pressures above 4.9 GPa (HP phase) did not enable us to extract reliable structural parameters or atomic positions. Thus we cannot quantitatively describe the structure evolution in this pressure range. It seems that above 4.9 GPa the diffraction patterns can no longer be ascribed to a single phase. This issue will be discussed in Section IV.
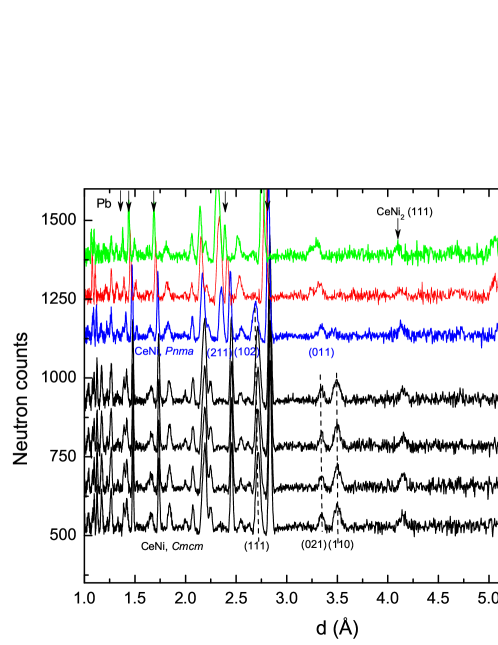
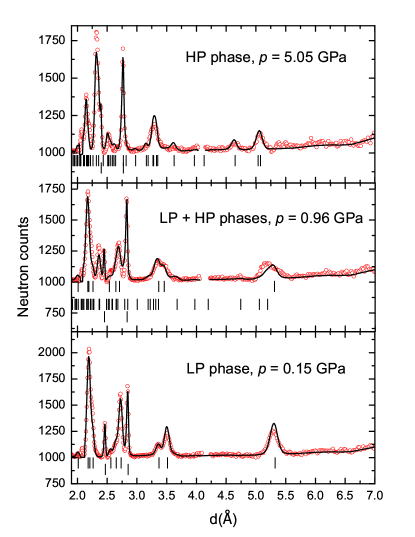
In order to extend the phase diagram to lower temperatures we performed neutron powder diffraction study of the CeNi structure under pressures up to GPa at K. Our experimental data are summarized in Fig. 3. It is seen that the initial CrB-type structure is conserved at low pressures. For example, a FullProf refinement gives the following structural parameters at GPa: Å, Å, Å, (Ce), (Ni) (Fig.4, bottom). At GPa a modification in the CeNi diffraction pattern is seen that is compatible with the expected symmetry change. In fact, the (111), (110), and (020) reflections fully disappear between 0.96 and 2.94 GPa. On the other hand, the representative reflections, for instance, (211) and (011) appear in the same pressure region. This means that CeNi transforms into a mixed low-pressure-high-pressure state. At and 5.05 GPa the diffraction pattern varies again as compared to that observed at the lower pressures. In addition to the reflections of FeB phase, new Bragg peaks appear, the most noticeable at Å. Indexing the CeNi diffraction pattern at GPa with DICVOL06Boultif and Louër (2004) leads to a new orthorhombic cell with crystal lattice parameters close to those found for the quenched modification of the TbNi compound, Å, Å, Å ( space group).Lemaire and Paccard (1970)
This structure is closely related to the FeB type structure with transformation equations ; ; . Assuming the CeNi high-pressure phase at 100 K to have this type of structure (we will call it 3 for a convenience), we performed Rietveld refinement of the experimental data at 5.05 GPa and obtained a rather good agreement between the experimental and calculated diffraction patterns (Fig. 4, top). The resulting crystal lattice parameters are Å, Å, Å, close to that for the quenched TbNi composition.Lemaire and Paccard (1970) Moreover, we were able to describe the experimental data at GPa, assuming this state to be a mixture of low-pressure and high-pressure 3 structures (Fig. 4, middle). According to the FullProf analysis, the volume fraction of low-pressure phase is 371%, and the high-pressure phase occupies 631% of the sample volume. However, we note that a complete FullProf refinement of the high-pressure diffraction patterns is hardly possible due to large number of fitting parameters (for 3 structure there are three nonequivalent Ce ions and three nonequivalent Ni ions located at (4c) positions). Moreover, the peak broadening at high pressure leads to significant overlap of reflections making the fit of atomic positions ambiguous. Finally, CeNi ingots always possess strong texture (or preferred orientations) which cannot be averaged out completely by milling the ingots to powder. As a result, a texture effect is seen clearly even in the X-ray diffraction pattern measured at ambient pressure (Fig. 2). Because of these circumstances, the calculated diffraction patterns for and 5.05 GPa in Fig. 4 were obtained with the atomic coordinates equal to those reported for TbNi in ref. Lemaire and Paccard, 1970 and fixed. A similar procedure of fixing atomic positions was also applied for the FullProf analysis of the mixed-phase room-temperature X-ray diffraction pattern at GPa.
IV DISCUSSION OF EXPERIMENTAL RESULTS
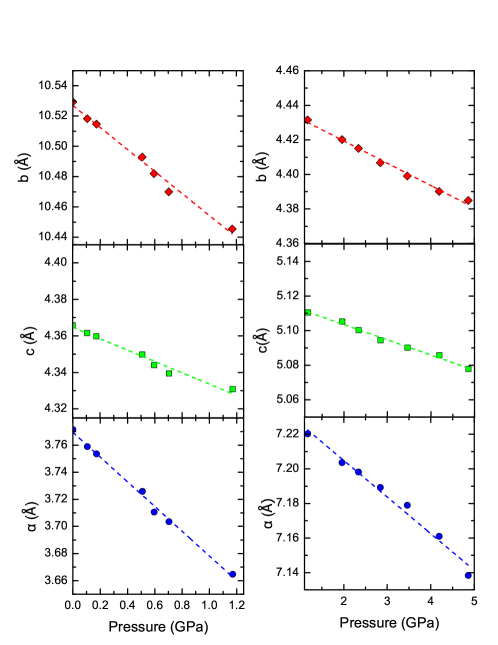
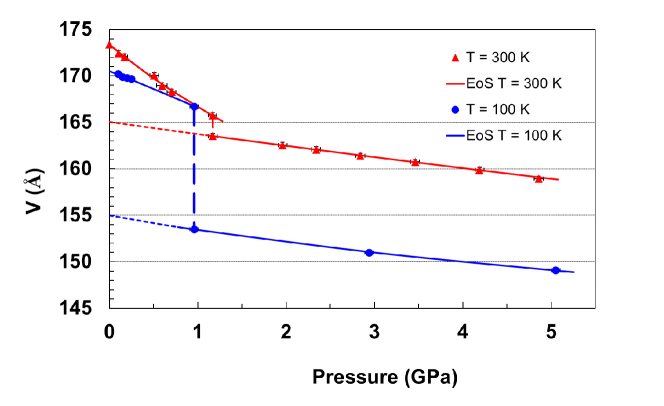
Figure 5 shows the pressure dependences of the crystal lattice parameters for the LP CrB and HP FeB phases of CeNi as obtained from experimental XRD measurements at room temperature. In the pressure range below 1.2 GPa (LP phase including phase coexistence region) the parameters , , and shrink by 2.8%, 0.8%, and 0.8%, respectively, so that the change in volume is about 4.4%. The parameters , , and of the HP FeB lattice are reduced by 1.1%, 1.1%, and 0.6%, respectively, when going from GPa to 4.86 GPa. The corresponding change in volume of the HP phase is about 2.8%. For a comparison, as seen from Fig. 6, the volume jump at the transition ( GPa) is 1.3% only at room temperature ( K). However at lower temperature ( K, GPa) the jump increases to 7.9%. Volume vs. pressure dependences shown in Fig. 6 were analyzed using a third order Birch-Murnaghan EOS.Murnaghan (1944); Birch (1947) The obtained EOS parameters (see Table 1) indicate that the CeNi HP structure is less compressible than the LP phase.
| K | K | DFT calculated | ||||
|---|---|---|---|---|---|---|
| LP phase | HP phase | LP phase | HP phase | LP phase | HP phase | |
| V0 (Å3) | 173.4(2) | 165.0(1) | 170.5(2) | 155.0(2) | 164.6 | 162.3 |
| B0T (GPa) (Å3) | 22(3) | 124(11) | 50(17) | 88(4) | 57 | 164 |
| B | 7(6) | 3(4) | -12(22) | 22.4(1) | 18 | 20 |
| B | -1.0 | -0.03 | -5.5 | -4.1 | ||
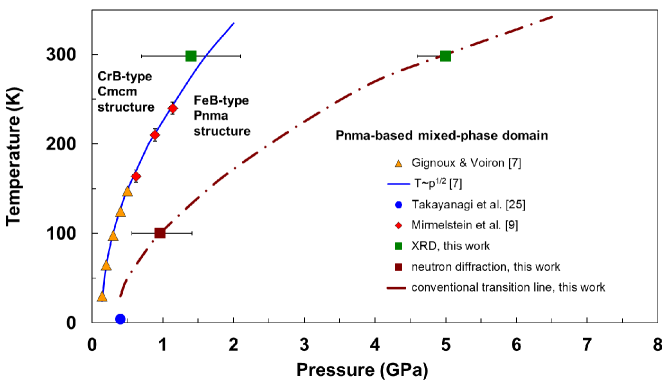
The experimental results described above allow us to draw some conclusions about the phase diagram of CeNi (Fig. 7). First, we found that at room temperature the LP structure of CeNi transforms into the FeB-type of structure belonging to the space group. The latter structure is typical for the Ni compounds where is the rare-earth metal from the second half of the lanthanide series, while light lanthanides, including cerium, form the crystal lattice of the CrB type.Dwight et al. (1965) Therefore, the symmetry is more favorable for the small rare earth ionic volume than . Both the FeB and CrB type structures contain a common structural unit, the trigonal prism, which is stacked differently to form either structure.Lemaire and Paccard (1970); Dwight et al. (1965) If the value of the sites in the structure goes to zero, one obtains the higher-symmetry structure.Heathman et al. (2000) Thus, the pressure-induced conversion from a CrB to a FeB type structure is not surprising. Furthermore, Hohnke and ParthéHohnke and Parthë (1966) established the set of transformation equations between the crystal lattice parameters of these two structures:
| (1) |
For this “ideal” case the volumes of FeB and CrB structures are equal. The room temperature lattice parameters of the CrB structure at GPa (two phases coexist at this pressure) are Å, Å, Å(Fig. 5). For these parameters, Eqs. (1) predict the FeB structure to have Å, Å, Å, so that deviations from the experimental values at K and GPa are -4%, -2%, and +7%, respectively. The fact that the experimental FeB crystal lattice parameters are found to be close to the expected “ideal” values is an additional argument in favor of symmetry of room temperature CeNi phase with pressure range between 1 and 5 GPa. The deviation of the experimental unit cell parameters from the “ideal” values is the result of a 1.3% volume jump due to the transition. Similar behavior of the unit cell parameters is found also at K. At GPa we have Å, Å, Åfor LP phase. Equations (1) give Å, Å, Å, while experimental values are Å, Å, Å. The volume jump at the transition ( K, GPa) is 7.9%, that is, as expected, much bigger than at room temperature.
Now we can establish an approximate phase diagram of CeNi (Fig. 7). At K, the (CrB FeB) transformation starts at 0.7 GPa and ends at 2.1 GPa (see Fig. 1). The middle point GPa almost coincides with the empirical transition line reported in Ref. Gignoux and Gomez-Sal, 1984. At K and GPa the CeNi sample is found to be inside the transition region (Fig. 6), however not with the pure FeB structure but its 3 modification. We did not observe the pure FeB structure at 100 K. Thus, we cannot say whether or not there is a pressure window for the FeB structure between the transition line established in Ref. Gignoux and Gomez-Sal, 1984 and confirmed in Ref. Mirmelstein et al., 2009 by magnetic measurements, and the transition to the 3 at around 1 GPa (see Fig. 7). We believe that the FeB structure may appear here and then transforms, almost immediately, under increase in pressure into the observed 3 structure. Such a behavior cannot be excluded since one of these structures (CrB and FeB) can transform to the other directly or via a sequence of polymorphous transformations.Lemaire and Paccard (1970); Hohnke and Parthë (1966) In fact, a very similar picture is observed at 300 K. The CrB FeB conversion does occur at 300 K, and then a second structure modification takes place at pressure above 4.9 GPa.
As mentioned in Section III, the X-ray diffraction patterns of CeNi above this pressure can no longer be described by a single phase, neither pure FeB nor its polymorphous modifications of the type ( etc.). Therefore, it seems quite reasonable to assume that at GPa and at room temperature the CeNi sample consists of a mixture of HP FeB phase and structures, which can be called “-based mixed phase structure”. If this is true, then the approximate CeNi phase diagram takes the form shown in Fig. 7 with the second transition line separating the FeB and -based mixed phase structural states. Note, that an extrapolation of this transition line to K goes to a critical pressure value GPa, close to that obtained by specific heat measurements under pressure in Ref. Takaynagi et al., 2001. We cannot exclude, however, a more complicated CeNi structure at pressures above, say, 5 GPa. The appearance of low scattering angle Bragg reflections in the CeNi XRD pattern at room temperature can also be considered to be the result of a coexistence of mixed FeB-CrB stacking variants similar to that found in Ni systems ( Gd and Tb).Klepp and Parthe (1981) However, the presence of the FeB-CrB mixture at high pressures does not look plausible since it requires reappearance of CrB phase. The question remains open whether such a coexistence of phases is of intrinsic origin or is a consequence of non-hydrostatic compression conditions and/or stress between grains of the powder samples. Nevertheless, based on our experimental results we can conclude that the structure of pressure-induced CeNi phase has symmetry at least at pressures below 5 GPa.
The relative stability of the and structures of CeNi under pressure can be understood by using density functional theory (DFT). Note, that we restrict our theoretical analysis to the CrB () FeB () transition. First-principles calculations were performed using the Vienna ab initio simulation package (VASP)Kresse and Furthmüller (1996) based on projector augmented wave (PAW) pseudopotentialsKresse and Joubert (1999) within the generalized gradient approximation (GGA) as parameterized by Perdew, Burke, and Ernzerhof (PBE).Perdew et al. (1996) After careful convergence tests, a plane wave cutoff energy of 350 eV and 15511 -point Monkhorst-Pack meshMonkhorst and Pack (1976) for the 8-atomic unit cell of CeNi LP phase and 91311 mesh for the HP phase were found to be sufficient to converge the total energy within 2 meV/cell. Bulk moduli have been computed by fitting to a Birch-Murnaghan equation of state.Murnaghan (1944); Birch (1947)
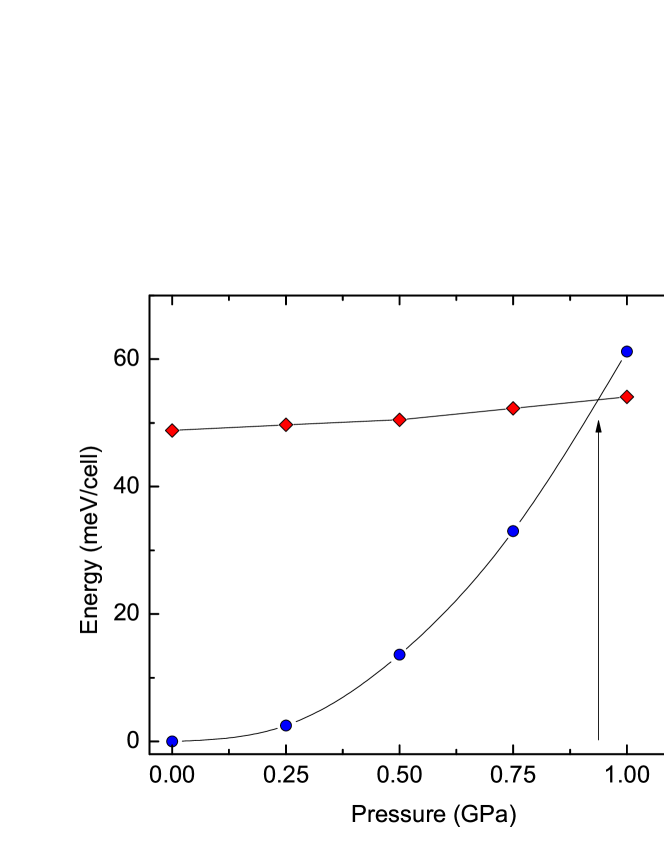
First, we started from the ground states of the and structures at ambient pressure. We determine an equilibrium state by starting from experimentally determined parameters and letting the lattice constants and the atomic positions relax. After the systems have relaxed the total energy difference between them turns out to be only 0.049(2) eV/cell, with the structure being the lower one. Next, we carried out calculations of the total energy of CeNi in both phases for different lattice parameters, which can imitate the influence of pressure. For every pressure the atomic positions were allowed to relax keeping the lattice parameters fixed. One sees in Fig. 8 that with increasing pressure (or with decrease in the lattice parameters in accordance to that found in our XRD measurements) the energies of the LP and HP phases cross at about 0.94 GPa. This confirms the stability of the CeNi crystal structure at ambient pressure down to the lowest temperature and, at the same time, provides an explanation for the structural phase transition at 1 GPa. The computed unit cell volumes and bulk moduli are found to be in a reasonable agreement with the experimental values (Table 1). Note, that the calculated bulk modulus of the structure turns out to be lower than that of the structure, consistent with the experiment.
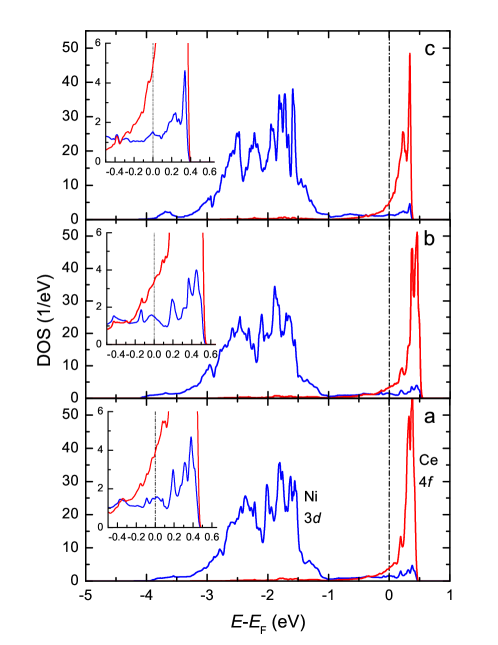
The electronic densities of states (DOS) for CeNi on both sides of the structural phase transition resulting from our DFT-GGA calculations are shown in Fig. 9(a,c). For comparison, the anticipated DOS for a phase at GPa is also shown (Fig. 9(b)). As expected, DFT calculations give metallic behavior of CeNi for both LP and HP phases, as indicated by a non-zero DOS at the Fermi level (). The site projected DOS of Ni 3 and Ce 4 orbitals overlap in the vicinity of , suggesting their hybridization. Fig. 9 demonstrates a rather weak but distinct impact of a moderate pressure, GPa, on the electronic states of CeNi. It can be seen that the structural transformation affects the DOS more than the pressure in the persistent structure, the Ni 3 states near being the most affected.
As mentioned in Introduction, CeNi is a well known intermediate-valence system, characterized by the magnetic susceptibility of enhanced Pauli type at low temperature and passing through a broad maximum at around 140 K, a moderately high value of the electronic specific heat coefficient mJ mol-1 K-2,Gignoux et al. (1983) and the characteristic spin fluctuation energy (Kondo scale) meV.Lazukov et al. (1996) The intermediate-valence behavior of CeNi implies a rather strong hybridization of the 4 electrons with Ni 3 states. The pressure-induced volume-collapse structural transition indicates essential changes of the CeNi electronic states. What can be deduced about these changes from the structural data obtained in the present study? Let us consider the variations of interatomic distances in CeNi due to the structural transition from the ambient pressure CrB-type of structure to FeB-type of structure ( GPa) at room temperature. Ce ions in the structure have seven Ni ions in the first coordination sphere at nearly equal distances R1(LP) = 2.938 Å (2 ions), R2(LP) = 2.948 Å (4 ions), and R3(LP) = 3.011 Å (1 ion). The next coordination sphere consists of eight Ce ions at R4(LP) = 3.601 Å (2 ions), R5(LP) = 3.752 Å (4 ions), and R6(LP) = 3.771 Å (2 ions). In the structure, Ce ions are surrounded by six nearest neighboring Ni ions at R1(HP) = 2.357 Å (1 ion), R2(HP) = 2.761 Å (1 ion), R3(HP) = 2.794 Å (2 ions), and R4(HP) = 2.980 Å (2 ions). The second coordination sphere of the structure, as well as structure, contains eight Ce ions at R5(HP) = 3.525 Å(2 ions), R6(HP) = 3.611 Å (2 ions), R7(HP) = 3.773 Å (4 ions). Thus, Ce-Ni interatomic distances shrink essentially due to transition. Ce-Ce interatomic distances decrease also, but their variation is less pronounced. The decrease of the Ce-Ni distances suggests an enhanced Ce 4 Ni 3 hybridization in the high pressure CeNi phase as compared to the ambient pressure structure. As a result, one can expect an increase of the characteristic magnetic fluctuation energy , and a correlated decrease of the electronic specific heat coefficient and the low temperature value of the Pauli-like magnetic susceptibility (both these values are generally inversely proportional to , which plays a role of an effective band width). Obviously, these expectations agree with the experimental results.Gignoux and Voiron (1985); Mirmelstein et al. (2009); Takaynagi et al. (2001) In fact, at an applied pressure of about 0.5 GPa both the electronic specific heat coefficient (see Fig. 3 in Ref. [Takaynagi et al., 2001]) and the magnetic susceptibility ( K) (red curve in Fig. 1 of Ref. [Mirmelstein et al., 2009]) decrease by the same factor of about 1.4. Note, that the smoothing of the peak structure of Ni 3 DOS in the vicinity of (Fig. 9(c)) may also be interpreted as a result of an enhanced 4 3 hybridization due to the structural transition. However, to achieve more direct and complete understanding of the evolution of the 4 electronic states across the volume-collapse transition (including the variation of and the 4 occupation number as a function of pressure) inelastic neutron scattering experiments are required.
V CONCLUSIONS
By means of X-ray and neutron powder diffraction measurements we have shown that pressure induces in CeNi structural phase transitions from a low-pressure CrB-type of structure ( space group) to high-pressure phases belonging to the space group. The experimental results allow us to draw an approximate phase diagram of CeNi according to which CeNi undergoes two successive phase transitions within the domain GPa, K. The first transition converts the LP structure into the FeB () structure (which was not, however, observed experimentally at K), while the second transition separates the FeB structure (HP phase) and -based mixed phase HP′ state.
DFT calculations predict that at ambient pressure the total energies of the and crystal structures are finely balanced, the latter energy being by 0.05 eV per unit cell higher than the former one. In terms of a DFT approach the pressure-induced structural phase transition in CeNi can be understood as a result of the higher compressibility of LP phase as compared to the HP phase: the LP total energy rises rapidly with pressure leading to a phase transition at the estimated pressure of 0.94 GPa.
Acknowledgements.
We are grateful to M.V. Ryzhkov for enlightening discussions on the DFT calculations. Research at Oak Ridge National Laboratory’s Spallation Neutron Source was supported by the Scientific User Facilities Division, Office of Basic Energy Sciences, a U.S. Department of Energy. Part of this work was supported by the Materials Sciences and Engineering Division, a U.S. Department of Energy, Basic Energy Sciences. This research used resources of the National Energy Research Scientific Computing Center, which is supported by the Office of Science of the U.S. Department of Energy under Contract No. DE-AC02-05CH11231. Lawrence Livermore National Laboratory is operated by Lawrence Livermore National Security, LLC, for the U.S. Department of Energy, National Nuclear Security Administration under Contract DE-AC52-07NA27344. JGT wishes to thank the Office of Advanced Simulation and Computing for support of his travel to Oak Ridge National Laboratory for experiments at the Spallation Neutron Source. Work at RFNC-VNIITF was supported in part by Contract B601122 between LLNL and RFNC-VNIITF. This research used resources of the Advanced Photon Source, a U.S. Department of Energy (DOE) Office of Science User Facility operated for the DOE Office of Science by Argonne National Laboratory under Contract No. DE-AC02-06CH11357.References
- Tobin et al. (2005) J. G. Tobin, K. T. Moore, B. W. Chung, M. A. Wall, A. J. Schwartz, G. van der Laan, and A. L. Kutepov, Phys. Rev. B 72, 085109 (2005).
- Chakrabarti et al. (2014) B. Chakrabarti, M. E. Pezzoli, G. Sordi, K. Haule, and G. Kotliar, Phys. Rev. B 89, 125113 (2014).
- Lanatà et al. (2013) N. Lanatà, Y.-X. Yao, C.-Z. Wang, K.-M. Ho, J. Schmalian, K. Haule, and G. Kotliar, Phys. Rev. Lett. 111, 196801 (2013).
- Lanatà et al. (2014) N. Lanatà, Y.-X. Yao, C.-Z. Wang, K.-M. Ho, and G. Kotliar, Phys. Rev. B 90, 161104 (2014).
- Tinney and Rosenzweig (1961) J. Tinney and A. Rosenzweig, Acta Cryst. 14, 69 (1961).
- Clementyev et al. (1998) E. S. Clementyev, P. A. Alekseev, M. Braden, J.-M. Mignot, G. Lapertot, V. N. Lazukov, and I. P. Sadikov, Phys. Rev. B 57, R8099 (1998).
- Gignoux and Voiron (1985) D. Gignoux and J. Voiron, Phys. Rev. B 32, 4822 (1985).
- Gignoux et al. (1987) D. Gignoux, C. Vettier, and J. Voiron, J. Magn. Magn. Mater. 70, 388 (1987).
- Mirmelstein et al. (2009) A. Mirmelstein, E. Clementyev, O. Kerbel, D. Kozlenko, Y. Akshentsev, V. Voronin, and I. Berger, J. Nucl. Mater. 385, 57 (2009).
- Murnaghan (1944) F. Murnaghan, Proc. Natl. Acad. Sci. U.S.A. 30, 244 (1944).
- Birch (1947) F. Birch, Phys. Rev. 71, 809 (1947).
- Fei et al. (2007) Y. Fei, A. Ricolleau, M. Frank, K. Mibe, G. Shen, and V. Prakapenka, Proc. Natl. Acad. Sci. U.S.A. 104, 9182 (2007).
- Besson et al. (1992) J. Besson, R. Nelmes, G. Hamel, J. Loveday, G. Weill, and S. Hull, Physica B: Cond. Matter 180-181, 907 (1992).
- Owen and Yates (1933) E. Owen and E. Yates, Philosophical Magazine Series 7 15, 472 (1933).
- Schulte and Holzapfel (1995) O. Schulte and W. B. Holzapfel, Phys. Rev. B 52, 12636 (1995).
- Kraus and Nolze (1996) W. Kraus and G. Nolze, J. Appl. Cryst. 29, 301 (1996).
- Boultif and Louër (2004) A. Boultif and D. Louër, J. Appl. Cryst. 37, 724 (2004).
- Arnold et al. (2014) O. Arnold, J. Bilheux, J. Borreguero, A. Buts, S. Campbell, L. Chapon, M. Doucet, N. Draper, R. F. Leal, M. Gigg, et al., Nucl. Instrum. Meth. A 764, 156 (2014).
- Rodríguez-Carvajal (1993) J. Rodríguez-Carvajal, Physica B: Cond. Matter 192, 55 (1993).
- Gignoux and Gomez-Sal (1984) D. Gignoux and J. C. Gomez-Sal, Phys. Rev. B 30, 3967 (1984).
- Lemaire and Paccard (1970) R. Lemaire and D. Paccard, J. Less-Common Metals 21, 403 (1970).
- Dwight et al. (1965) A. Dwight, R. Conner, and J. Downey, Acta Cryst. 18, 837 (1965).
- Heathman et al. (2000) S. Heathman, R. G. Haire, T. Le Bihan, A. Lindbaum, K. Litfin, Y. Méresse, and H. Libotte, Phys. Rev. Lett. 85, 2961 (2000).
- Hohnke and Parthë (1966) D. Hohnke and E. Parthë, Acta Cryst. 20, 572 (1966).
- Takaynagi et al. (2001) S. Takaynagi, S. Araki, R. Settai, Y. Onuki, and N. Mori, J. Phys. Soc. Jap. 70, 753 (2001).
- Klepp and Parthe (1981) K. Klepp and E. Parthe, Acta Cryst. B 37, 495 (1981).
- Kresse and Furthmüller (1996) G. Kresse and J. Furthmüller, Phys. Rev. B 54, 11169 (1996).
- Kresse and Joubert (1999) G. Kresse and D. Joubert, Phys. Rev. B 59, 1758 (1999).
- Perdew et al. (1996) J. P. Perdew, K. Burke, and M. Ernzerhof, Phys. Rev. Lett. 77, 3865 (1996).
- Monkhorst and Pack (1976) H. J. Monkhorst and J. D. Pack, Phys. Rev. B 13, 5188 (1976).
- Gignoux et al. (1983) D. Gignoux, F. Givord, R. Lemaire, and F. Tasset, J. Less-Common. Met. 94, 165 (1983).
- Lazukov et al. (1996) V. Lazukov, P. Alekseev, E. Clementyev, R. Osborn, B. Rainford, I. Sadikov, O. Chistyakov, and N. Kolchugina, Europhys. Letters 33, 141 (1996).