Steric modulation of ionic currents in DNA translocation through nanopores
Abstract
Ionic currents accompanying DNA translocation strongly depend on molarity of the electrolyte solution and the shape and surface charge of the nanopore. By means of the Poisson-Nernst-Planck equations it is shown how conductance is modulated by the presence of the DNA intruder and as a result of competing electrostatic and confinement factors. The theoretical results reproduce quantitatively the experimental ones and are summarized in a conductance diagram that allows distinguishing the region of reduced conductivity from the region of enhanced conductivity as a function of molarity and the pore dimension.
I Introduction
Translocation of DNA in narrow pores plays a central role in many biological processes, such as viral infection by phages and interbacterial DNA transduction Lodish et al. (1996) as much as in the development of novel devices for high-throughput and low-cost biotechnological applications Dekker (2007); Venkatesan and Bashir (2011). In the last decade, several experimental studies have explored the translocation process of DNA through protein channels across cellular membranes or microfabricated channels Vlassiouk et al. (2008).
Solid state nanopores have attracted considerable attention as ideal devices for reading off the base pairs while tracking the DNA motion through nanopores Branton et al. (2008). Experimentally, during the DNA translocation through a nanopore one measures rapid variations of the ionic currents due both to the steric hindrance and the negative DNA charge density distribution. In principle, these variations can be used to decypher the DNA base pair sequence, if one is able to finely identify the factors which modulate the current. To this purpose, one must characterize the differences between the ionic signal when the DNA is in the pore or away from it. One observes that the ionic current shows a larger/lower value when the DNA is inside/outside the pore depending on the concentration of the electrolyte. Since the reservoirs provide an amount of counterions sufficient to screen the DNA charge the number of charge carriers increases and thus determines a larger conductance, in spite of the fact that the effective section available to the passage of ions is smaller.
From the theoretical point of view DNA translocation and the accompanying electrokinetic transport of electrolytes involve the comprehension of the competition between electrostatic, excluded volume and fluid-atom hydrodynamic couplings, with the key role played by the local confinement. Therefore, understanding the physical mechanisms that regulate ionic transport calls for an accurate determination of each contribution and, wherever possible, for realistic computational modeling. In addition, as the diameters of the pore and of DNA can be as small as a few nanometers, ionic transport is genuinely microscopic. At such length scale a careful evaluation of the local interactions requires a sophisticated theoretical treatment Marconi et al. (2013).
When DNA translocates in a solid state pore, it assumes an elongated conformation, due to both the electrostatic repulsion stemming from different parts of the DNA backbone, and by the axisymmetric and narrow shape of the pore. One of the most interesting effects of the high confinement is that the ensuing ionic current can be modulated in different and opposing ways. In fact, several authors have reported that ionic current can be either enhanced or blocked by the presence of DNA within the pore Meller et al. (2001); Fologea et al. (2005); Mara et al. (2004); Storm et al. (2005); Cao et al. (2012); Gupta et al. (2014). Current blockage refers to the fact that ionic current could be temporarily reduced when DNA is present within the channel. Such effect is typically associated with the occlusion due to DNA that diminishes the ionic fluxes. Vice versa, current enhancement is also possible in a low-concentration electrolyte. Such effect can be ascribed to the excess of charge carriers accompanying DNA as it occupies the pore region, that are loosely bound to the biomolecule and therefore available to conduction. Both blockage and enhancement are observable in experiments and their occurrence depends on the molarity, the degree of confinement, the nanopore material (such as or ), and possibly other physico-chemical parameters Dekker (2007); Luan and Stolovitzky (2013).
In the present paper, we analyze how current modulation depends by several parameters by employing a dual theoretical/computational approach. Due to the high level of confinement, one usually ignores the presence of convective currents, that is, considers frictional forces strong enough to effectively damp out electro-osmotic effects. To test such an issue we shall compare results obtained by taking into account convective currents with those that exclude these contributions. Our description is encoded by the well-known Poisson-Nernst-Planck (PNP) theory Zheng and Wei (2011), as largely employed in the study of ionic transport in biological ion channels, such that only electrostatic, diffusive and migration contributions are considered. In addition, in order to simplify the analysis an effective one-dimensional equation based on a suitable homogenization procedure is written down Marconi and Melchionna (2013). By identifying the entropic forces arising from the degree of confinement and, by imposing the local electroneutrality condition, the conductance of the pore-DNA system can be estimated. The enhancement/blockage diagram of the system reveals how the ionic current is modulated as a function of molarity, pore geometry, effective charge on DNA and pore surface. In addition, besides the role of the DNA intruder in the pore, the equations allow determining the contribution of the reservoirs, with the related access resistance, to the overall transport. Being a one-dimensional differential equation, the analysis is particularly manageable in terms of computational and modeling efforts. For instance, we will represent DNA as either a smooth or a corrugated cylinder, being either at rest or in motion within the pore, and assess how the enhancement/blockage diagram varies correspondingly. With respect to our previous study Marconi and Melchionna (2013), we have improved the solution by replacing the local electroneutrality approximation used to determine the electric field by the more refined solution of the Poisson equation. The computational cost of the approach is modest and can serve as a useful method to perform an early survey of DNA/pore systems.
The paper is organized as follows in section II we define the model and its governing one dimensional effective equations. In section III we perform numerical calculations and discuss the results concerning the conductance and a conductance diagram obtained by considering the variation of the conductance upon inserting into the pore a long thin cylindrical charged object mimicking the DNA molecule. Finally, in section IV we present a few concluding remarks.
II Model system and reduction to a one-dimensional effective problem
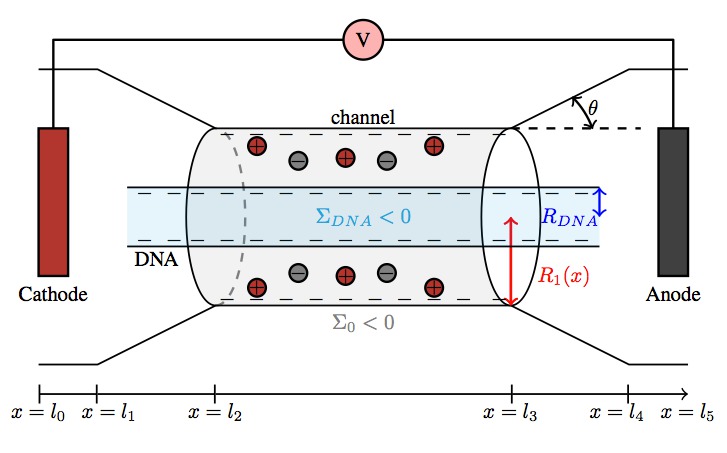
We start by describing the system and how it is modelled in effective one-dimensional terms. The geometry of the three dimensional pore is sketched in Fig. 1 and consists of two conical funnels connecting a straight pore. The radius of the channel, which has cylindrical symmetry, can be written as a function of alone:
| (1) |
The two conical funnels of variable radius are joined by the channel with section of constant radius and length , whose inner walls carry a fixed surface charge of area density , is the slope of the funnel and moreover and . Each funnel connects the pore to a reservoir and are the coordinates of the inlet and outlet of the cylinder, respectively. The DNA molecule is described as a very long thin cylinder of radius and with , whose axis coincides with the one of the pore Marconi and Melchionna (2013). The space between the pore walls and the DNA is filled by an electrolytic solution and the cathode and the anode are placed at and , respectively, and a potential difference is applied between them, as shown in Fig. 1.
The evolution of the ionic concentrations is described within the framework of the Poisson-Nernst-Planck theory, which combines Fick’s diffusion law with the drift induced by the electric field and the convection of the ions due to the motion of the solvent determined by the DNA movement Vlassiouk et al. (2008). The PNP three-dimensional model can be solved numerically, however an effective one-dimensional description can shed some light and has gained increasing popularity in recent times Schuss et al. (2001); Cervera et al. (2005). In situations of interest the geometry of the channels is such that it is possible to neglect the variations of the relevant fields along some directions and reduce the description to a one-dimensional problem. In nanochannels of constant section, whose transverse width is much shorter than the longitudinal size, the reduction is straightforward, otherwise one must take into account the effect of the varying shape.
The lengths which determine the electrostatic properties of the system are the Debye screening length , , the Bjierrum length , the typical radius of the pore, of DNA and the pore length. The Debye length is a function of the bulk densities of each ionic species, , the dielectric permittivity, , and the temperature , the electronic valence according to , where is the Boltzmann constant and the elctronic charge. The Bjerrum length is and under standard ambient conditions and for aqueous solutions is typically of the order of nm, while in electrolytic solutions of concentrations in the range M, varies between and . Thus in channels of nanometric diameter can exceed their transverse size and the ensuing behaviour of the solution is mainly determined by the presence of the surface charges due to the partial overlap of the double layers of different bounding surfaces. One finds that the resulting ionic atmosphere is mainly composed by counterions, a feature of capital importance because it yields the possibility of controlling through the surface charge the ionic currents through the pores.
In the present treatment we only consider the steady current regime which does not require the full time dependent solution of the PNP equations. The condition that the ionic current densities, , must have vanishing divergence, , together with the property of impenetrability of the walls, yield the following relation between the average axial component, , of the three-dimensional current and the variable section of the pore:
| (2) |
where is the transverse section of the system and the current. After this premise, in the stationary state is the sum of four different terms: the diffusive contribution, the entropic term, accounting for the modulation of the confinement Jacobs (1967); Zwanzig (1992); Reguera and Rubi (2001), the migration contribution stemming from the driving electric field and a convective term due to the electro-osmotic flow induced by the charges present on the pore and DNA surfaces. The r.h.s. of the following expression encodes the four different contributions,
| (3) |
where is the species coefficient of diffusion.
The convective velocity , will be discussed below, depends on the surface charges of the pore and DNA and on the electric field along the axis direction. Equation (II) represents an ordinary first order differential equation for the one-dimensional linear density of species , which is related to the three dimensional ionic densities by the following sectional averaging:
| (4) |
where the sectional area for the system shown in Fig. 1 is
| (5) |
Similarly, we define the sectionally averaged electric field:
| (6) |
which as shown in ref. Marconi and Melchionna (2013); Gillespie et al. (2002) satisfies the following differential equation
| (7) |
where is the wall charge density, being in the pore and zero elsewhere.
The terms proportional to the surface charge of the walls and of the DNA intruder appear as source terms in the one-dimensional representation and stem from the boundary conditions and on the reduction of the original three dimensional problem. The geometrical term containing the logarithm of enforces the conservation of the flux of the electric field in a system of variable pore section.
The set of effective one-dimensional equations here considered represents a convenient approach to the solution of full three-dimensional problems, which involve a demanding numerical effort. As far as the performance of the one-dimensional PNP model (PNP1) versus the corresponding three dimensional model (PNP3) we verified that the narrower the channel, the larger is the difference in profiles between the two types of solutions Marconi et al. (2013).
In the case of a binary electrolytic solution one has to solve three coupled differential equations: the two equations (II) are needed to determine the local concentrations of the species, while the third equation (7) determines the electric field produced by the ionic charge distribution and the fixed charges. In the literature one often employs the so-called local electroneutrality approximation (LEN) Kontturi et al. (2008); Dickinson et al. (2011) because it avoids the effort of finding the solution of eq.(7) which is not known in closed analytical form. The LEN approximation states that locally there is no charge separation, a fact that may be justified because the typical values of the screening length are small as compared with the system dimensions, such as the longitudinal and transverse channel sizes. In other words one assumes that at each point the mobile charges exactly balance the fixed surface charges, as it occurs in the limit of vanishing . The electric field does not satisfy the one dimensional Poisson equation (7), but takes values that enforce the absence of charge separation. Under steady state conditions one can express the charge density distribution in terms of the fixed surface charge distribution and obtain a very simple equation for the density profiles in terms of the electric current and the mass current Marconi and Melchionna (2013). On the other hand, dimensional analysis shows that the LEN may break down in nanometric systems, that is, when the system size is of the same order as .
To fix the convective velocity, , that plays the role of an input parameter in the PNP model, we follow Ghosal’s treatment Ghosal (2007, 2012, 2006). The presence of surface charges and of the applied electric field, , along the axis, generates an electroosmotic flow (EOF), whose velocity is parallel to . The resulting radial velocity profile, of the fluid, vanishing at the pore surface, reads:
| (8) |
where the potential is the solution of the two dimensional Debye-Huckel equation in the anular region :
| (9) |
is the value at , a characteristic electroosmotic velocity and the dynamic viscosity of the solution. and are modified Bessel functions of integral order. The constants and are determined (see ref. Ghosal (2007)) by imposing the boundary conditions
| (10) | |||||
| (11) |
We approximate the convective velocity featuring in eq. (II) by the following sectional average:
| (12) |
Notice that in the cases here considered such a velocity turns out to be larger than the translocation velocity of the DNA molecule whose value can be estimated as:
In order to give an idea of the importance of the electric current associated with the EOF, , with respect to the conduction current, , we consider the ratio :
For sodium ions in water at 1 M concentration the above ratio is approximately , where and are the diffusion coefficient of the ions and the dynamic viscosity of water, respectively.
As mentioned in the introduction to detect the passage and eventually sequence DNA, one monitors the ionic conductance of the pore. On theoretical grounds, the total resistance of the system shown in Fig. 1 is the sum of the resistances of five different pieces: the resistance associated with the two funnels plus the resistance due to the two cylindrical regions adjacent the electrodes and the central part, . In the absence of surface charges the total conductance can be approximated by the following Ohmic formula (see ref. Marconi and Melchionna (2013)) :
| (13) |
where is the resistivity defined in terms of the coefficient as . We first evaluate the effect of the presence of a cylindrical intruder of radius within the pore in the limit of and and no charges. By taking into account the reduced section available one estimates the difference in conductance between the free and the obstructed pore we find from eq. (13):
| (14) |
Although the conductance due to the obstruction always results negative on the basis of steric arguments, the presence of negative charges on the DNA and not included in formula (13), may lead to a different answer. In fact, some positive ions migrate from the reservoirs towards the negative surfaces and increase locally the number of mobile carriers and one observes a conductivity larger than in the absence of DNA. Such a phenomenon is particularly relevant at low ionic concentrations and is related to the so-called surface conduction mechanism Bocquet and Charlaix (2010); Lyklema and Minor (1998).
The competition between enhanced conduction due to the presence of surface charges and the depletion due to the reduction of the available pore section due to the DNA leads to an interesting dependence of the relative conductance on the DNA features.
Hereafter, we shall study the conductance variations, as the concentration of the solution and the surface charge are varied, by comparing the numerical results relative to the one-dimensional PNP model with the predictions based on the LEN theory, which provides simple expressions for small potential and concentration drops.
III Methods and numerical results
The simulations were performed considering systems comprised of the five different regions illustrated in Fig. 1. In the numerical calculations took values between and , while the other geometrical parameters were always , , . The DNA is modelled as a long rigid cylinder of radius , coaxial to the nanochannel, and having surface charge density . This schematic representation of DNA is justified by the persistence length of the dsDNA molecule which is about . The surface charge densities were assumed to have values , , . A voltage drop was applied on the ends of the system:
| (15) |
In order to solve numerically eqs. (II) and (7) we have introduced a one-dimensional mesh and defined non dimensional quantities in the following way: the Debye length, , the concentration, , the charge density , the electric potential , the applied potential difference .
In the following, unless explicitly stated we shall perform calculations by neglecting the convective contribution to the current and include this term only when computing the global phase diagram.
We started by measuring the dependence of the total electric current, , on the applied potential difference for various values of the salt concentration relative to a solution of ions of identical masses and mobilities and extracted the conductance . In the case of the empty pore we found the characteristic to be linear at concentrations , , (data not reported). On the other hand, the conductance as concentration is lowered at first decreases almost linearly, showing a standard bulk Drude behavior, but finally reaches a plateau value when is of order of the ratio .
In order to understand the effect of the two vestibules we compared the results relative to the set up of Fig. 1 with those relative to a system with constant radius , that is a straight cylindrical pore. Fig. 2 displays the ionic current versus molarity in these two cases for the empty system and for the system partially occluded by DNA when . We observe that the total ionic current in the non uniform channel, by virtue of its larger cross section, is larger than the one relative to the straight model. In the inset of Fig. 2 the currents of counterions and coions are reported separately, limited to the case of the inhomogeneous pore. One can observe that the counterion current, , is always larger in the presence of DNA than in the free-DNA case due to the surface induced enrichment and that the difference increases at low molarities where the surface conduction mechanism is more evident. On the contrary, the coion current, , is sensibly higher for the free-DNA case at large molarities where the steric hindrance overwhelms the Coulombic repulsion, but the difference disappears as the Debye length increases.
Variations in conductance associated with the presence of DNA are best appreciated by considering the relative conductance deviation defined as the ratio:
| (16) |
where is the conductance of the free pore, while is the same quantity in the presence of DNA.


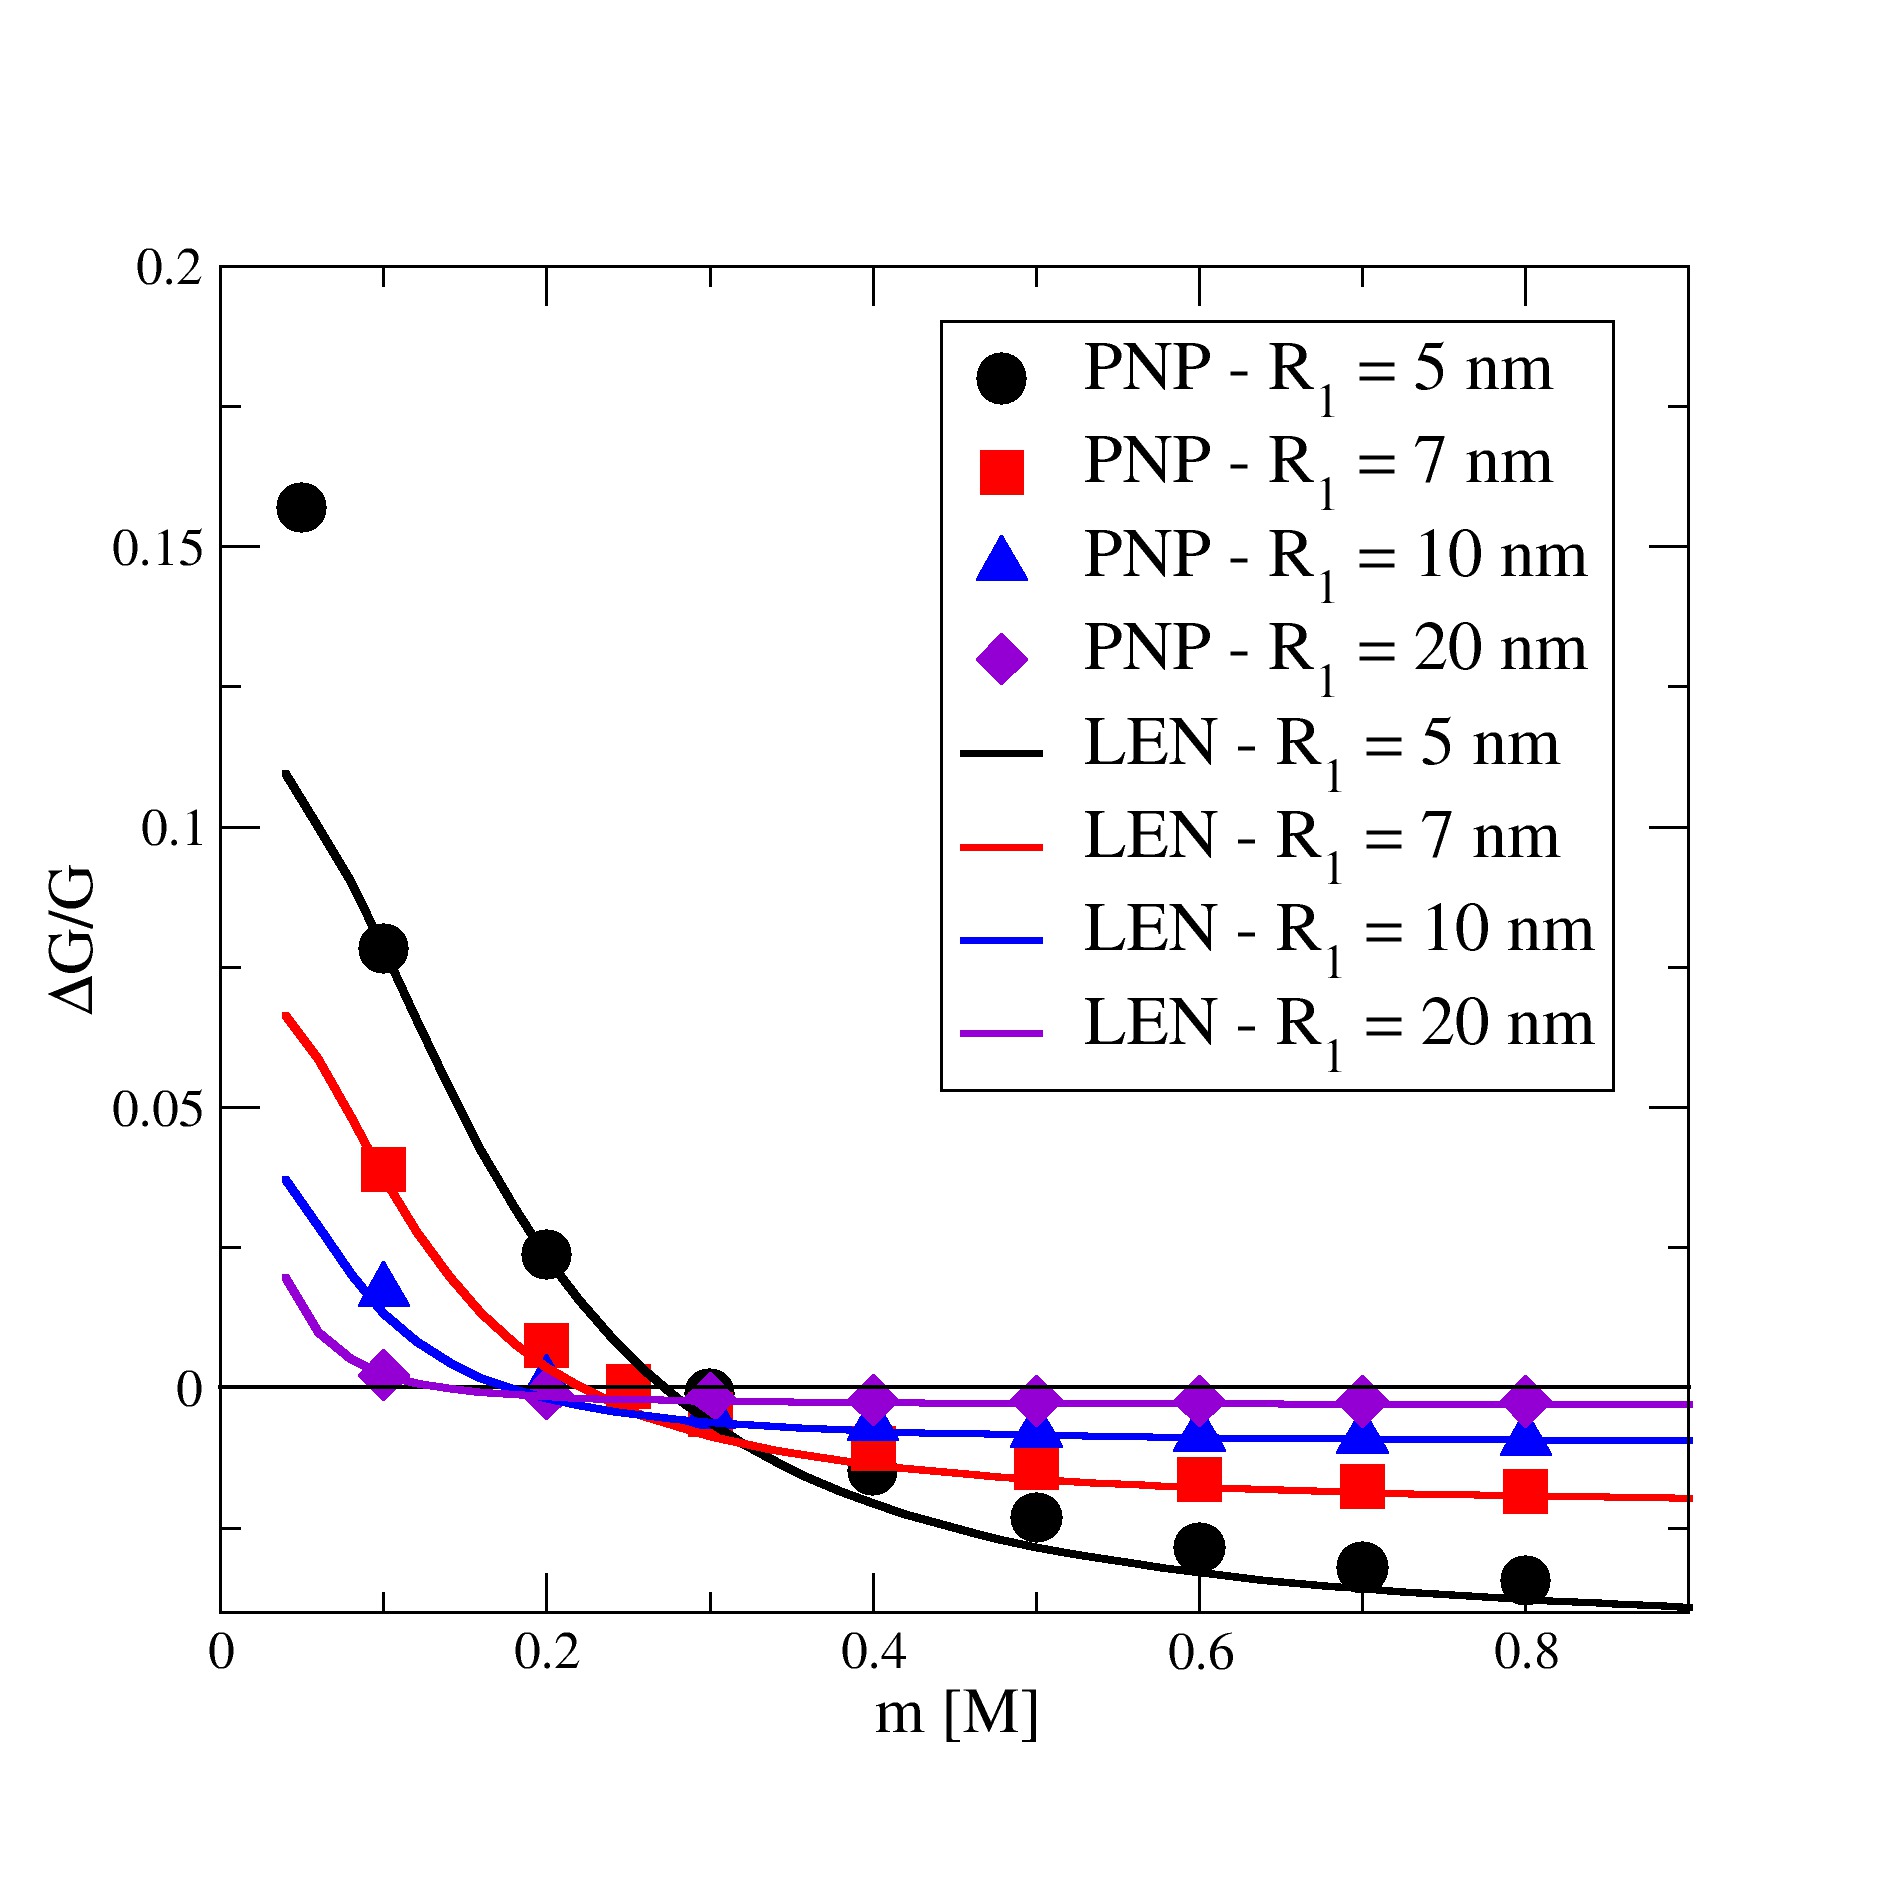
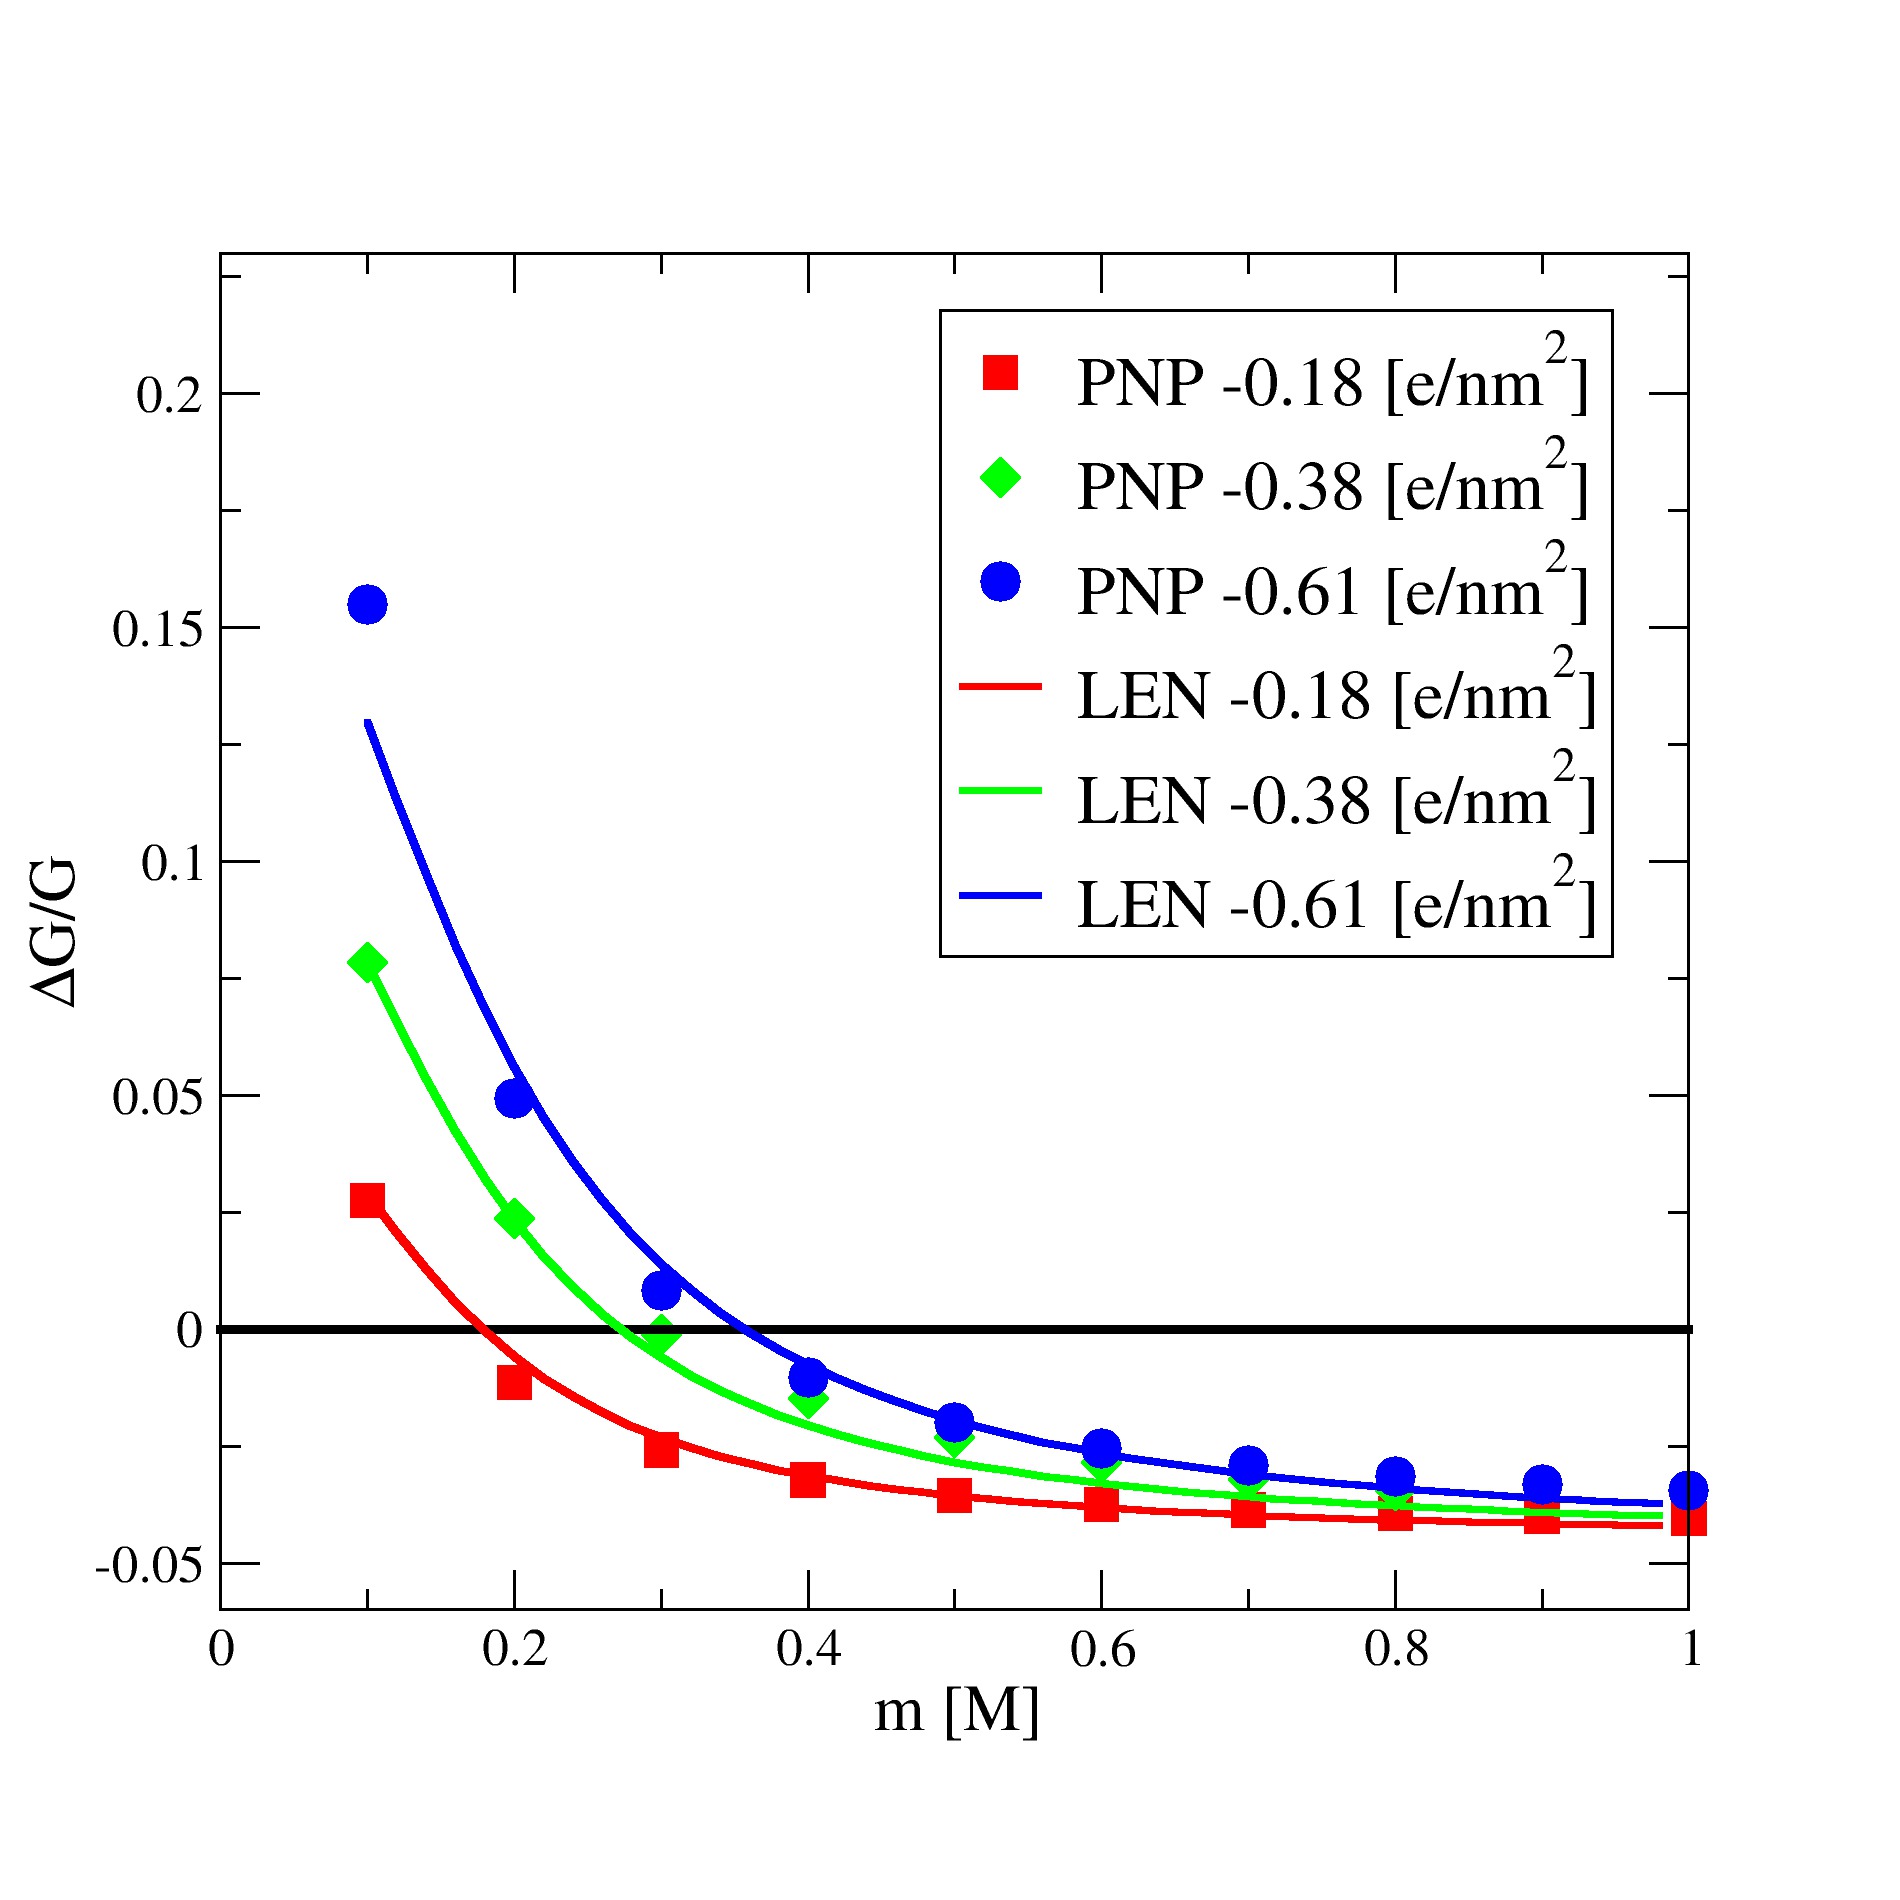

Fig. 3 illustrates the behavior of such an observable as the electrolyte concentration is varied. When the molarity is below a certain threshold value, , one observes a positive value of , which corresponds to an enhanced conductance with respect to the free-DNA case. Above , instead, the presence of the DNA intruder partially hinders the passage of ions and determines a reduction of the conductance with respect to its open pore value. Following the name convention the two regimes are named enhancement and blockage, respectively. We have also tested the importance of the geometry by comparing the relative conductance of a straight cylindrical pore with that relative to the double funnel-cylinder system. The effect of the inhomogeneity appears to be relevant only at low concentrations () while the critical concentration, , results nearly independent on the channel geometry. Fig. 3 seems to indicate that the straight pore geometry is more sensitive to the presence of DNA since the relative conductance varies faster with decreasing molarity. We ascribe this feature to the fact that the absolute value of its conductance is lower than the one associated with the double funnel, while the variations due to the DNA intrusion are comparable in the two situations. In Fig. 3 we also reported the results obtained using the LEN approximation, where one can appreciate that at large molarities the agreement between the data obtained in the present work and the LEN is fairly good, whereas at low molarities corresponding to larger Debye lengths the LEN theory tends to underestimate the difference in conductance between the DNA-free and DNA case.
The importance of the radius of the pore is stressed in Fig. 4, where the relative conductance is shown for , for a reduction of of the nominal charge DNA density, while the remaining parameters were the same as in Fig. 3. One can see not only that the larger the radius the smaller the crossover concentration, but also that the sensitivity decreases with increasing size as one can see from the fact that for a fixed value of the molarity the relative conductance of the corresponding to is in general lower than the conductance relative to . For the sake of comparison, we also display the corresponding results of the LEN approximation and remark that for the crossover value appears to be underestimated by the LEN, which predicts that the blockage extends to lower molarities with respect to the PNP.

Fig. 5 illustrates numerical results for for a non uniform channel of radius versus salt concentration, varying in the interval a , corresponding to Debye lengths ranging from to , for different choices of the value of the DNA charge (that is for a reduction of , e of the nominal charge DNA ) : as the DNA charge decreases the crossover point moves towards lower concentrations in agreement with the fact that the conductance is dominated by the surface conduction mechanism according to which a larger determines an enrichment of the counterions and thus a larger conductance. In this case the LEN approximation also appears to work quite well as compared to the PNP method.
An interesting aspect regards the role played by the roughness of the surface of the DNA molecule. So far, we represented the DNA as a uniform cylinder of radius and neglected its double helix structure. We, now, consider DNA as having a corrugated shape of cylindrical symmetry and radius varying along the symmetry axis according to the law:
| (17) |
where , and . Consistently, eqs. (II) and (7) are modified in order to take into account the variation of with position. Fig. 6 shows that the effect of the corrugation is appreciable only in the low concentration regime where the surface conduction dominates and is influenced by and the currents are more sensitive to the geometrical details of the charge distribution. The same figure also shows the comparison between the theoretical results and the corresponding experimental result of Dekker and coworkers Smeets et al. (2006).
A global picture of the conducting properties of DNA-pore system is provided by the two dimensional conductance diagram, whose axes are the molar concentration and the channel diameter as shown in Fig. 7. For each pore diameter, one determines the critical concentration where the relative conductance changes sign, as for instance shown in Fig. 5. The plane shown in Fig. 7 is divided in two regions: above the line the ionic electric current is reduced since in wider pores the prevailing mechanism of conduction is Ohmic and the geometric effect beats the surface conduction; below the line, instead, the extra charges made available to conduction within the pore by the presence of fixed charges gives rise to the surface conduction and thus to an enhanced current. Each point displayed in Fig. 7 represents the value of the critical concentration where the crossover enhancement/blockage occurs. In Fig 7 for the sake of comparison we have included the effect on the variation of the relative conductance of the convective term using the value provided by formula (12). The three different lines refer to: a) the channel shown in Fig. 1, b) the same set up but with a corrugated DNA intruder as described by (17) and c) the effect of the convection velocity, , given by formula (12) on the phase diagram. Fig. 7 also shows the effect of DNA convection, which is negligible for radii larger than . Indeed, one can observe that the inclusion of convection determines only a small shift of the ”coexistence line”. On the other hand, Fig. 7 also indicates that the conductance diagram is shifted in the direction of higher molar concentrations when one includes the possibility of DNA corrugation. In addition, Fig. 7 shows that by increasing the pore radius the critical concentration decreases slightly and tends to be independent on the pore size. At high concentration the enhancement current can not be recognized. However, it is possible to detect the passage of DNA in the pore by the current blockage.
IV Conclusions
We have employed a simple one-dimensional representation of a pore-electrolyte-DNA system widely used in experiments on DNA translocation. Our focus has been in understanding how the ionic currents are altered by the presence of DNA in the pore, modelled as a charged cylindrical intruder. The analysis is based on a one-dimensional reduction of the three dimensional PNP model which treats the ions in the continuum and the electrostatic interactions in a mean field fashion. The resulting effective equations are of diffusive type and display the presence of the so-called entropic term, stemming from the variations of the geometry of the channel along the direction of the axis, and of a driving electric field due to the charges.
We have found instructive to compare the results of one dimensional PNP model with the corresponding results of the LEN theory. The latter in spite of its simplicity can give a first hint of the behavior of a complex system such as a pore. The LEN calculation shows that the crossover from blockage to enhancement is qualitatively reproduced, but quantitatively its predictions become more inaccurate especially at low molarities. It is evident that the LEN yields crossover values for pores of large radius which are too low. We attribute this feature, to the fact that the LEN underestimates the effect of the surface charges and thus determines a lower conductance. In the future work the results of this one dimensional model will be tested against full three dimensional Lattice Boltzmann simulations Melchionna and Marini Bettolo Marconi (2011); Marini Bettolo Marconi and Melchionna (2012).
References
- Lodish et al. (1996) Lodish, H.; Baltimore, D.; Berk, A.; Zipursky, L.; Matsudaira, P.; Darnell, J. Molecular Cell Biology; W. H. Freeman, New York, 1996; Vol. 1
- Dekker (2007) Dekker, C. Nature Nanotechnology 2007, 2, 209–215
- Venkatesan and Bashir (2011) Venkatesan, B. M.; Bashir, R. Nature Nanotechnology 2011, 6, 615–624
- Vlassiouk et al. (2008) Vlassiouk, I.; Smirnov, S.; Siwy, Z. Nano letters 2008, 8, 1978–1985
- Branton et al. (2008) Branton, D. et al. Nature biotechnology 2008, 26, 1146–1153
- Marconi et al. (2013) Marconi, U. M. B.; Melchionna, S.; Pagonabarraga, I. The Journal of chemical physics 2013, 138, 244107
- Meller et al. (2001) Meller, A.; Nivon, L.; Branton, D. Physical Review Letters 2001, 86, 3435
- Fologea et al. (2005) Fologea, D.; Gershow, M.; Ledden, B.; McNabb, D. S.; Golovchenko, J. A.; Li, J. Nano letters 2005, 5, 1905–1909
- Mara et al. (2004) Mara, A.; Siwy, Z.; Trautmann, C.; Wan, J.; Kamme, F. Nano Letters 2004, 4, 497–501
- Storm et al. (2005) Storm, A. J.; Storm, C.; Chen, J.; Zandbergen, H.; Joanny, J.-F.; Dekker, C. Nano Letters 2005, 5, 1193–1197
- Cao et al. (2012) Cao, Q.; Zuo, C.; Li, L.; Li, Y.; Yang, Y. Biomicrofluidics 2012, 6, 034101
- Gupta et al. (2014) Gupta, C.; Liao, W.-C.; Gallego-Perez, D.; Castro, C.; Lee, L. Biomicrofluidics 2014, 8, 024114
- Luan and Stolovitzky (2013) Luan, B.; Stolovitzky, G. Nanotechnology 2013, 24, 195702
- Zheng and Wei (2011) Zheng, Q.; Wei, G.-W. The Journal of chemical physics 2011, 134, 194101
- Marconi and Melchionna (2013) Marconi, U. M. B.; Melchionna, S. Molecular Physics 2013, 1–9
- Vlassiouk et al. (2008) Vlassiouk, I.; Smirnov, S.; Siwy, Z. Acs Nano 2008, 2, 1589–1602
- Schuss et al. (2001) Schuss, Z.; Nadler, B.; Eisenberg, R. S. Physical Review E 2001, 64, 036116
- Cervera et al. (2005) Cervera, J.; Schiedt, B.; Ramirez, P. EPL (Europhysics Letters) 2005, 71, 35
- Jacobs (1967) Jacobs, M. Diffusion processes; Springer-Verlag New York, 1967
- Zwanzig (1992) Zwanzig, R. The Journal of Physical Chemistry 1992, 96, 3926–3930
- Reguera and Rubi (2001) Reguera, D.; Rubi, J. Physical Review E 2001, 64, 061106
- Gillespie et al. (2002) Gillespie, D.; Nonner, W.; Eisenberg, R. S. Journal of Physics: Condensed Matter 2002, 14, 12129
- Kontturi et al. (2008) Kontturi, K.; Murtomäki, L.; Manzanares, J. A. Ionic transport processes: in electrochemistry and membrane science; OUP Oxford, 2008
- Dickinson et al. (2011) Dickinson, E. J.; Limon-Petersen, J. G.; Compton, R. G. Journal of Solid State Electrochemistry 2011, 15, 1335–1345
- Ghosal (2007) Ghosal, S. Physical review letters 2007, 98, 238104
- Ghosal (2012) Ghosal, S. arXiv preprint arXiv:1203.1945 2012,
- Ghosal (2006) Ghosal, S. Physical Review E 2006, 74, 041901
- Bocquet and Charlaix (2010) Bocquet, L.; Charlaix, E. Chemical Society Reviews 2010, 39, 1073–1095
- Lyklema and Minor (1998) Lyklema, J.; Minor, M. Colloids and Surfaces A: Physicochemical and Engineering Aspects 1998, 140, 33–41
- Smeets et al. (2006) Smeets, R. M.; Keyser, U. F.; Krapf, D.; Wu, M.-Y.; Dekker, N. H.; Dekker, C. Nano letters 2006, 6, 89–95
- Melchionna and Marini Bettolo Marconi (2011) Melchionna, S.; Marini Bettolo Marconi, U. EPL (EuroPhysics Letters) 2011, 95, 44002
- Marini Bettolo Marconi and Melchionna (2012) Marini Bettolo Marconi, U.; Melchionna, S. Langmuir 2012, 28, 13727–13740