ALEVS: Active Learning by Statistical Leverage Sampling
Abstract
Active learning aims to obtain a classifier of high accuracy by using fewer label requests in comparison to passive learning by selecting effective queries. Many active learning methods have been developed in the past two decades, which sample queries based on informativeness or representativeness of unlabeled data points. In this work, we explore a novel querying criterion based on statistical leverage scores. The statistical leverage scores of a row in a matrix are the squared row-norms of the matrix containing its (top) left singular vectors and is a measure of influence of the row on the matrix. Leverage scores have been used for detecting high influential points in regression diagnostics (Chatterjee & Hadi, 1986) and have been recently shown to be useful for data analysis (Drineas et al., 2008) and randomized low-rank matrix approximation algorithms (Gittens & Mahoney, 2013). We explore how sampling data instances with high statistical leverage scores perform in active learning. Our empirical comparison on several binary classification datasets indicate that querying high leverage points is an effective strategy.
1 Introduction
A passive supervised learning algorithm for classification induces a model with the available set of labeled instances. However, in many modern machine learning applications, in addition to this limited set of labeled instances, there is a large pool of unlabeled instances. For cases where the cost of labeling data is high relative to that of collecting the unlabeled data, active learning strategies have been shown to be useful. In a classical active learning framework for supervised classification (Cohn et al., 1994; Settles, 2009), the learner can interact with an oracle (i.e. human annotator) that provides labels when queried. Typically, an active learner begins with a small set of labeled instances, selects one or a batch of examples from a pool of unlabeled data and queries the labels for these selected examples. Once the oracle provides the new labels, these examples are augmented to the training set; the active learner is retrained, and this process is repeated until a halting criterion (i.e. desired accuracy) is satisfied. Through selectively deciding which examples to label, the active learner aims to obtain a classifier of high accuracy by using fewer label requests and thereby reducing the total labeling cost. Different strategies (Settles, 2009) of querying examples have been suggested. In this work, we explore a novel direction for querying that is based on statistical leverage scores.
The statistical leverage has found extensive applications in diagnostic regression analysis (Chatterjee & Hadi, 1986; Hoaglin & Welsch, 1978). Statistical leverage scores have been recently shown to be useful for data analysis such as CUR decomposition and randomized low-rank matrix approximation algorithms. In CUR decomposition, the matrix is approximated with a product , where and are respectively small subsets of the columns and rows of the matrix is computed from and (Drineas et al., 2006). (Drineas et al., 2008) introduced a method where the matrix columns are sampled randomly with probability proportional to their leverage scores. Similarly, Nyström extensions are sampling based randomized low-rank approximations to positive-semidefinite matrices. Gittens et al. analyzed different Nyström sampling strategies for SPSD matrices and showed that samplings based on leverage scores are quite effective (Gittens & Mahoney, 2013).
In the aforementioned work, leverage scores were used for approximation purposes. The intuition in these methods is that leverage score sampling ensures important columns (or rows) are included in the approximation. In this study we instead exploit leverage scores to find examples with important feature vectors in the data and query the instances with high statistical leverage scores. Our proposed method, Active Learning by Statistical Leverage Sampling (ALEVS), exhibits good empirical performance on different benchmark datasets. The rest of the paper is organized as follows: in section 2, we describe the problem set up and our approach ALEVS; in section 3, the experiments are described in detail; in section 4 we discuss the empirical performance of ALEVS on different datasets; in section 5 results are elaborated on and the conclusions are stated.
2 Problem Set Up and Approach
2.1 Problem Set Up
We denote the training data set that contains instances, where each instance is a vector of dimension and is the class label of . The initial dataset comprises a small set of labeled examples, and a large pool of unlabeled examples. At each iteration of active learning, a perfect oracle is queried with an unlabeled example and the oracle returns the label with uniform cost across examples. We denote the labeled set of training examples at iteration with and the set of unlabeled examples with . Our aim is to attain a good accuracy classifier with minimal number of queried examples.
2.2 ALEVS: Sampling Based on Statistical Leverage Scores
At an iteration , the classifier, is trained only with the labeled training examples and the data is divided into two portions based on class memberships. Two feature matrices are formed. is a feature matrix, where the rows are the feature vectors of examples with positive class membership at iteration . These examples are those that are positively labeled in and those that are in but have predicted positive labels according to . is similarly constructed from negatively predicted and labeled examples.
After the prediction of the labels of unlabeled data, ALEVS computes a kernel matrix over and separately. In our experiments we employed linear kernel and Gausian Radial Basis (RBF) kernel. Over a set of data points the linear kernel matrix corresponding to those points is given by
| (1) |
RBF kernel matrix corresponding to these same points is given by
| (2) |
In the above equation is a nonnegative real number that determines the scale of the kernel. The choice of is discussed in the experimental section.
As described in (Gittens & Mahoney, 2013), the leverage scores of a SPSD kernel matrix can be calculated as follows. is the eigen decomposition of . We can partition as
| (3) |
where comprises orthonormal columns spanning the top -dimensional eigenspace of . The leverage score of the th column of is defined as the squared Euclidean norm of the th row of
| (4) |
After the leverage scores are computed within each class, the example to query is determined by selecting the unlabeled example with the highest leverage score:
| (5) |
Steps of ALEVS are summarized in Algorithm 1.
3 Experiments
We compare ALEVS with the following baseline approaches: (1) Random Sampling: randomly select query instances, (2) Uncertainty Sampling: selects the instance with maximal uncertainty, (3) Leverage on all data: computes the leverage score on the at the beginning of the iteration without paying attention to class membership and selects unlabeled queries in the order of their leverage scores. The last baseline decides whether separating the examples based on their predicted class membership has any value or not.
In Uncertainty Sampling, to find the most uncertain unlabeled datapoint based on the SVM output, we estimate the posterior probabilities of each unlabeled instance with Platt’s algorithm (Platt et al., 1999). The most uncertain point is the one with maximal .
Ten different datasets are used in our study and their descriptions are given in Table 1. The digit1, g241c, g241n, USPS datasets are from (Chapelle et al., 2006). The spambase dataset and letter are from (Lichman, 2013). The letter dataset is a multi-class dataset, we selected letter pairs that are difficult to distinguish: letter(D vs. P) and letter (U vs. V). Similarly, we work on MNIST(3 vs. 5) which is one of the most confused pairs in the handwritten digit dataset MNIST (Lecun & Cortes, ). Finally, the splice and ringnorm are culled from Gunnar Räetsch‘s benchmark datasets (Rätsch et al., 2001). In all experiments, an SVM classifier with RBF kernel is used as the classifier. For the RBF kernel scale parameter is selected automatically by a heuristic method of built-in SVM function in MATLAB.
| dataset | # instances | # features |
|---|---|---|
| digit1 | 1500 | 241 |
| g241c | 1500 | 241 |
| g241n | 1500 | 241 |
| letter (DvsP) | 1608 | 16 |
| letter (UvsV) | 1577 | 16 |
| USPS | 1500 | 241 |
| splice | 2991 | 60 |
| ringnorm | 2000 | 20 |
| spambase | 2000 | 57 |
| MNIST (3vs5) | 2000 | 784 |
Each dataset is divided into two portions at random. The first portion is held-out for testing purposes and the other half is used for training. We start with 4 initially labeled examples. At each iteration, the classifier is updated for all methods and the accuracies are calculated on the same held-out test data. For each dataset the experiment is repeated times and for each replicate, the partitioning of the whole data into training and test sets is random. The accuracies reported in figures are the average accuracies over these random trials with shaded area representing standard error. In calculating leverage scores we experimented with both RBF and linear kernel. Here we report the best performing cases.
4 Results
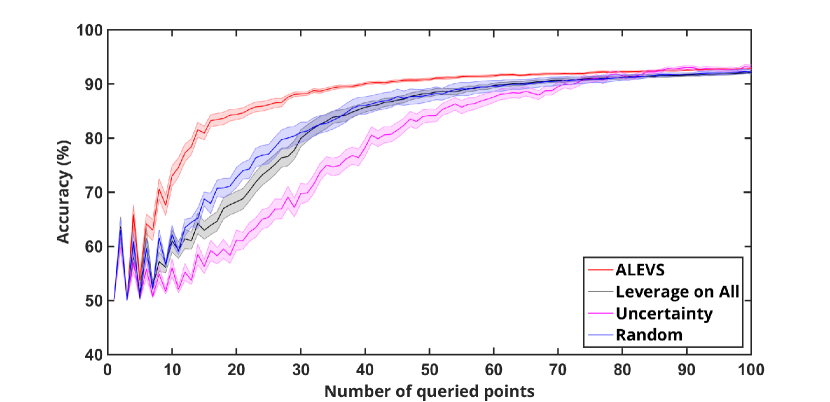
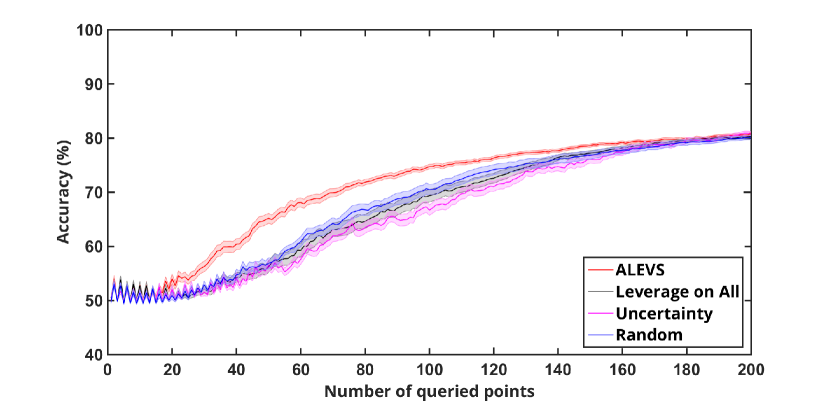
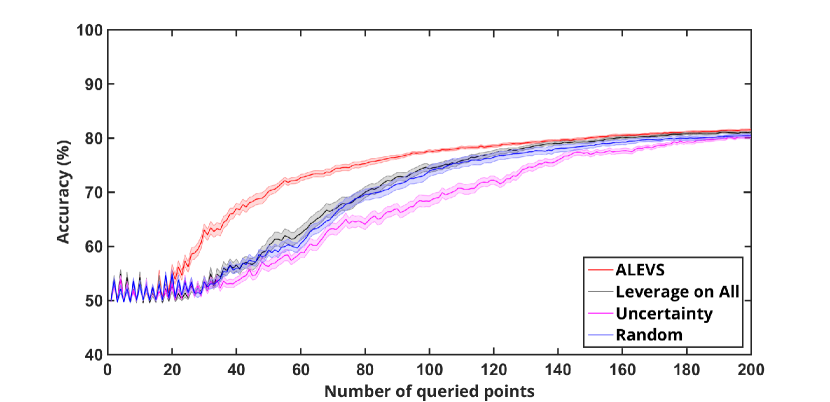
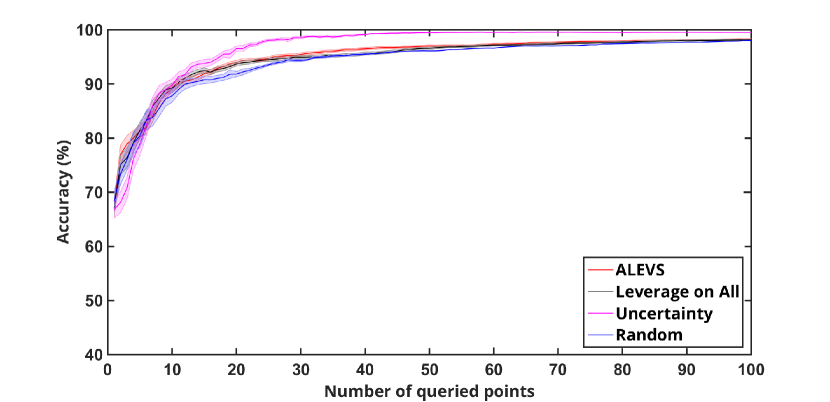
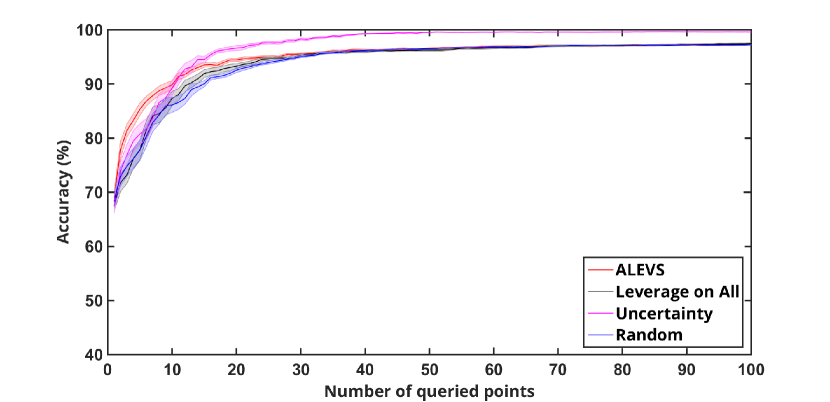
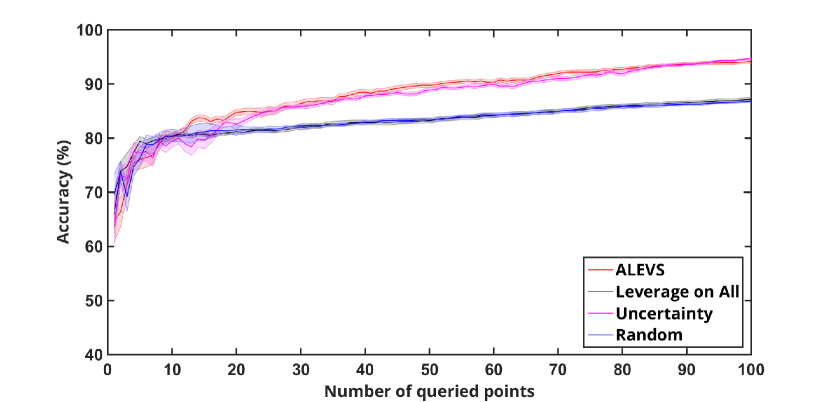
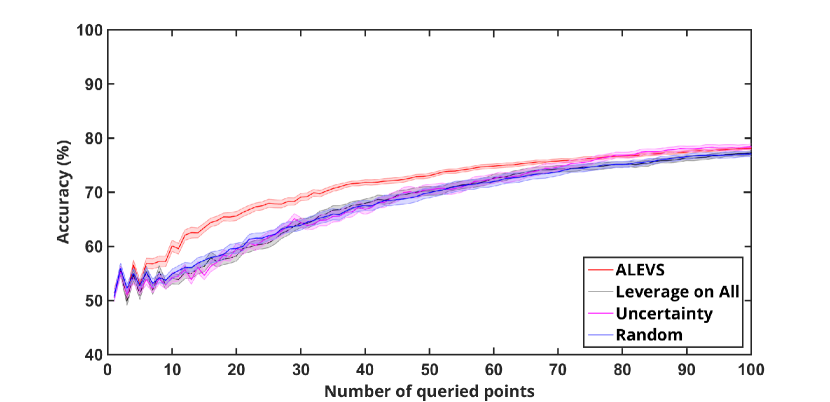
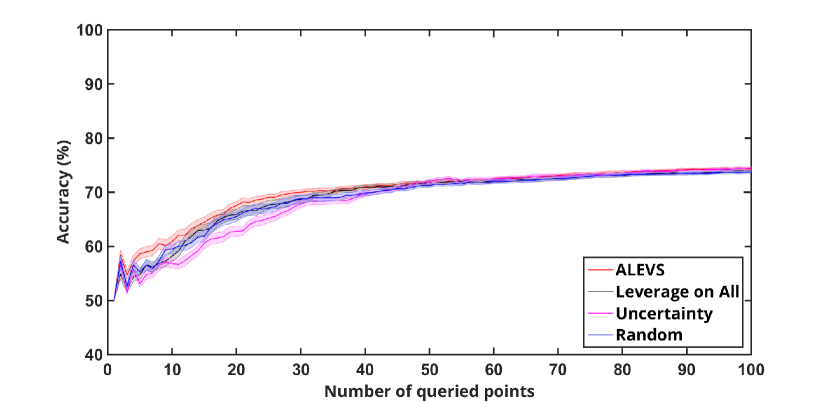
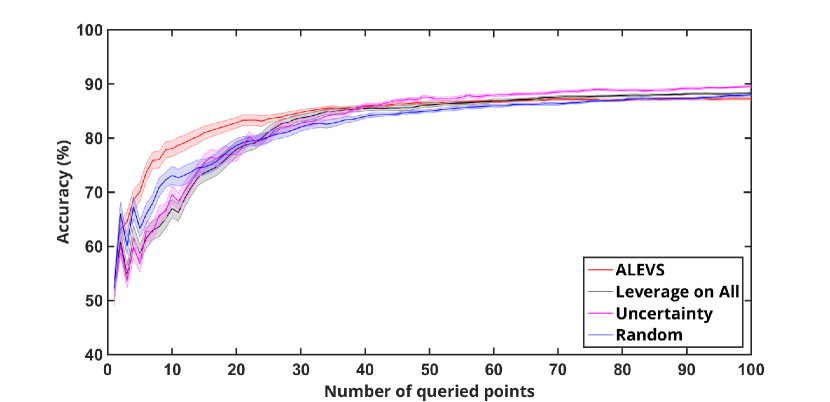
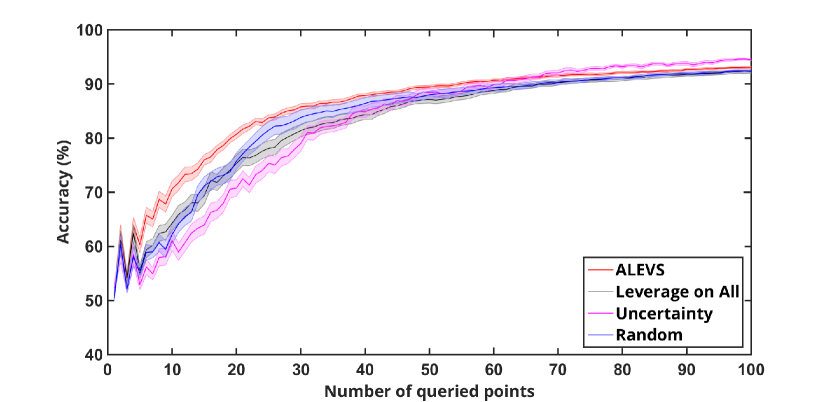
Figure 1 shows the classification accuracy of ALEVS and the baselines with varied numbers of queries. We observe that in seven out of ten datasets (Fig. a, b, c, g-j), ALEVS is able to outperform the baseline methods. In three datasets, the performance is comparable to that of uncertainty. In USPS dataset (Fig. f), ALEVS beats Random Sampling and Leverage on All, however it is performance is only as good as Uncertainty Sampling. In letter(D vs. P) (Fig. d ) and letter(U vs. V) (Fig. e) dataset, the initial performance of ALEVS is very good, but as the number of queries increased Uncertainty Sampling outperforms ALEVS. In all results, at early iterations, ALEVS seems to query better data points. One strategy could be start with ALEVS and switch to another sampling strategy at further iterations.
The baseline Leverage on All sampling achieves a performance in between ALEVS and Uncertainty Sampling. This method calculates leverage scores for the kernel matrix computed over all data, whereas ALEVS first forms partitions based on the class membership. From the results, we conclude that this division is valuable. It might even be interesting to further divide data into clusters and calculate leverage scores of examples within their own clusters.
We probed the effect of parameter to the resulting performance. In the experiments, we operated with values 20, 40, 60 and 80. For the sake of simplicity for each dataset, we include results with best values. We observe that for USPS and splice datasets, affects the accuracy drastically. In our future line of work, we will investigate systematic means to set the parameter based on the input matrix structural properties.
5 Conclusion
In this paper, we propose a new method, ALEVS, that samples data points based on their statistical leverage scores. The leverage scores are calculated on kernel matrices constructed from the feature vectors of the instances. Empirical comparison with baseline methods demonstrates that sampling high-leverage points are indeed useful. In addition to the future work discussed in the Results section, we consider improving the computational efficiency. Since the input data matrices to the leverage score computation have overlap across iterations, we will investigate ways of reusing leverage computations in previous iterations to calculate the leverage scores for the current iteration.
Acknowledgments
O.T. acknowledges support from Bilim Akademisi - The Science Academy, Turkey under the BAGEP program and the support from L’Oreal-UNESCO under the UNESCO-L’OREAL National Fellowships Programme for Young Women in Life Sciences.
References
- Chapelle et al. (2006) Chapelle, O., Schölkopf, B., Zien, A., et al. Semi-supervised learning. 2006.
- Chatterjee & Hadi (1986) Chatterjee, S. and Hadi, A. S. Influential observations, high leverage points, and outliers in linear regression. Statist. Sci., 1(3):379–393, 08 1986. doi: 10.1214/ss/1177013622.
- Cohn et al. (1994) Cohn, D., Atlas, L., and Ladner, R. Improving generalization with active learning. Mach. Learn., 15(2):201–221, May 1994. ISSN 0885-6125. doi: 10.1023/A:1022673506211.
- Drineas et al. (2006) Drineas, P., Kannan, R., and Mahoney, M. W. Fast Monte Carlo algorithms for matrices III: Computing an efficient approximate decomposition of a matrix. SIAM J. Comput., 36(1):184–206, 2006.
- Drineas et al. (2008) Drineas, P., Mahoney, M. W., and Muthukrishnan, S. Relative-Error CUR Matrix Decompositions. SIAM J. Matrix Anal. Appl., 30:844–881, 2008.
- Gittens & Mahoney (2013) Gittens, A. and Mahoney, M. Revisiting the Nyström method for improved large-scale machine learning. In Proc. 30th International Conference on Machine Learning, 2013.
- Hoaglin & Welsch (1978) Hoaglin, D. C. and Welsch, R. E. The hat matrix in regression and ANOVA. American Statistician, 32:17–22, 1978.
- (8) Lecun, Y. and Cortes, C. The MNIST database of handwritten digits. URL http://yann.lecun.com/exdb/mnist/.
- Lichman (2013) Lichman, M. UCI machine learning repository, 2013. URL http://archive.ics.uci.edu/ml.
- Platt et al. (1999) Platt, J. et al. Probabilistic outputs for support vector machines and comparisons to regularized likelihood methods. Advances in large margin classifiers, 10(3):61–74, 1999.
- Rätsch et al. (2001) Rätsch, G., Onoda, T., and Müller, K-R. Soft margins for adaboost. Machine learning, 42(3):287–320, 2001.
- Settles (2009) Settles, B. Active learning literature survey. Computer Sciences Technical Report 1648, University of Wisconsin–Madison, 2009.