Coexistence of two dengue virus serotypes
and forecasting for Madeira island††thanks: This is a preprint of a paper whose
final and definite form is in Operations Research For Health Care,
ISSN 2211-6923. Paper submitted 21/Nov/2014; revised 17/May/2015 and 07/Jul/2015;
accepted for publication 14/Jul/2015.
University of Minho, Campus de Gualtar, 4710–057 Braga, Portugal
2Center for Research and Development in Mathematics and Applications (CIDMA), Department of Mathematics, University of Aveiro, 3810–193 Aveiro, Portugal
3School of Business Studies, Viana do Castelo Polytechnic Institute,
Avenida Miguel Dantas, 4930–678 Valença, Portugal
4Algoritmi R&D Center, Department of Production and Systems,
University of Minho, Campus de Gualtar, 4710–057 Braga, Portugal)
Abstract
The first outbreak of dengue occurred in Madeira Island on 2012, featuring one virus serotype. Aedes aegypti was the vector of the disease and it is unlikely that it will be eliminated from the island. Therefore, a new outbreak of dengue fever can occur and, if it happens, risk to the population increases if two serotypes coexist. In this paper, mathematical modeling and numerical simulations are carried out to forecast what may happen in Madeira Island in such scenario.
Keywords: modeling infectious diseases; dengue; virus serotype; multistrain.
2010 Mathematics Subject Classification: 92B05; 93A30.
1 Introduction
Dengue is the most rapidly spreading mosquito-borne viral disease in the world [46, 48]. In the last decades, dengue’s incidence has grown 30-fold and is now endemic throughout tropical and subtropical regions, present in more than 100 countries. According to World Health Organization (WHO), over 40% of world’s population is at risk [5, 39]. In Europe, in the last decade, some outbreaks have occurred [19, 23, 36].
Dengue is transmitted from an infected human to an Aedes mosquito, mainly Aedes aegypti, and then from the mosquito on to other humans. The virus, which is circulating in the blood of the infected subject, is ingested by a female mosquito when it bites. After the incubation period, the infectious mosquito can transmit the virus on to other humans in subsequent bites [47]. The mosquito life cycle has four distinct stages: egg, larva, pupa and adult. The first three stages take place in the water, while the adult stage occurs in the air.
Dengue can be caused by four different serotypes, named DEN-1,2,3,4. It is well documented in the literature that there are differences among the serotypes (see, e.g., [3]), but it is still to be determined which clinical characteristics correspond to which serotype [3]. However, several reports have indicated that serotypes DEN-2 and DEN-3 may cause more severe disease than the serotypes DEN-1 and DEN-4 (see, e.g., [26, 43]). Infection by one serotype provides lifelong immunity against that virus and temporary immunity against the other three. After a cross-immunity period of 2 to 3 months, a subject can be infected with a different serotype [15, 45]. The existence of four different viruses causes a wide clinical spectrum that includes asymptomatic cases, classic cases of dengue fever and more severe cases known as Dengue Hemorrhagic Fever (DHF). There is good evidence that a subsequent infection by other serotype increases the risk of developing severe dengue [1, 8, 14].
As there is no vaccine or specific treatment for dengue, prevention is very important. To prevent the dengue virus transmission, the mosquito vector must be controlled to avoid reproduction and consequent bites. Control of vector is mainly achieved by eliminating the places where the mosquito lays their eggs, such as artificial water containers. As adult mosquitoes bite inside or outside houses, during the day or at night when the lights are on, it is also essential for humans to apply repellent on skin and also to use personal household protection like window screens, insecticide treated materials and long-sleeved clothes [2, 7, 10].
Rich literature investigating the dengue disease from the mathematical point of view exist. Some run simulations on specific regions of the globe [20, 24, 31, 32, 33] and others make studies using the effects of the disease spread considering biological issues [14, 28, 30, 34, 35]. In this paper we aim to study a preview scenario for Madeira Island in the case of a second outbreak with two serotypes circulating. This is important because DHF is 15 to 80 times more likely in secondary infections, being positively associated with pre-existing dengue virus antibodies [41].
In the Portuguese island of Madeira, the first outbreak of dengue fever occurred between October 2012 and February 2013. This outbreak was caused by only one serotype, DEN-1 virus, and it was declared controlled March 12, 2013. The vector was the mosquito Aedes aegypti, detected in Madeira for the first time in 2005. The mosquito is still not eradicated from Madeira and the Portuguese Ministry for Health consider that it can hardly be [12, 22, 40]. The island has an intensive trade with areas where the disease is already endemic and the number of tourists has been increasing. These two factors, beneficial to the local economy, can also lead to the appearance of a new serotype in the island and an outbreak can occur at any moment [38].
The main motivation of this work is to analyze what may happen in Madeira Island in a dengue outbreak if two serotypes of dengue coexist. Mathematical modeling is used to simulate this hypothetical outbreak, caused by two different serotypes, considering the use of insecticide as a control measure. The article is organized as follows: Section 2 provides a brief description of the first outbreak in Madeira and in Section 3 we formulate the mathematical model to describe the interaction between human and vectors. Numerical experiments are presented in Section 4 and conclusions ensue in Section 5.
2 Madeira’s 2012 outbreak
The outbreak affected mainly Funchal, the main city of the island, and lasted for 21 weeks, ending late February 2013. By that time, 2171 probable cases of dengue fever had been reported and, of these, 1084 were confirmed in the laboratory. In Figure 1 the reported cases per week are presented.
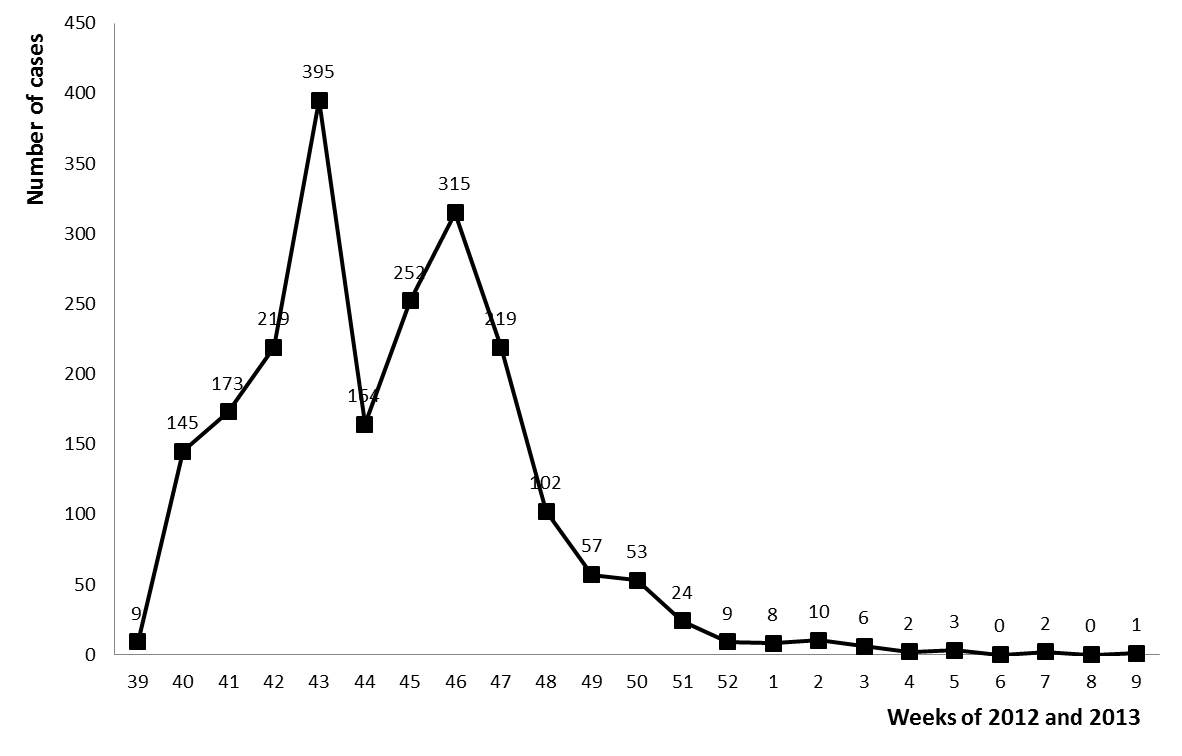
No deaths or cases of DHF were reported [40, 49]. In order to control the mosquito vector, local authorities took a whole range of measures, including the usage of a massive quantity of insecticide, starting even before the outbreak. However, Aedes aegypti has shown a high level of resistance against the insecticide [38]. As a response, educational campaigns were conducted. Media coverage in newspapers, television, radio, the internet and through flyers was a powerful tool. In particular, the population was informed about the importance of using repellent and covering arms and legs. Artificial water containers, such as cans, jars, barrels, plastic containers and broken bottles were requested to be removed. In addition, a medical appointment, exclusively dedicated to dengue fever, was implemented in Bom Jesus Health Centre. Nowadays, local authorities continue to monitor Aedes aegypti entomological activity through a program of traps monitoring [12, 40].
3 The mathematical model
In order to describe what can happen if two virus serotypes coexist, a mathematical model based on [36] is here proposed. The novelty is the presence of a second serotype of dengue and the consequent presence of a new set of variables:
| — | susceptible human (who can contract the disease); | |
| — | human infected by serotype (who can transmit the serotype ); | |
| — | human resistant to serotype (infected by serotype and recovered); | |
| — | human infected by serotype (who can transmit the serotype ); | |
| — | human resistant to serotype (infected by serotype and recovered); | |
| — | human infected first by serotype and after by serotype ; | |
| — | human first resistant to serotype and after to serotype ; | |
| — | human first infected by serotype and after by serotype ; | |
| — | human first resistant to serotype and after to serotype ; | |
| — | susceptible mosquitoes; | |
| — | aquatic phase (stages that take place in water: egg, larva and pupa); | |
| — | mosquitoes infected by serotype (that can transmit the disease); | |
| — | mosquitoes infected by serotype (that can transmit the disease). |
The index refers to the virus serotype DEN-1, the responsible for the first outbreak in Madeira Island. The new index , , refers to different virus serotypes (DEN-2, 3 or 4).
The first nine state-variables are related to human population while the last four are concerned with the female mosquito. These compartments are mutually-exclusive [11]. It should be noted that there is no variable to represent resistant mosquitoes or to represent mosquitoes infected by a second serotype. Indeed, given that mosquitoes have a very short lifespan, there is no time for them to recover from an infection. Thus, once infected, the mosquito remains infected until its death [9, 47].
The application of insecticides is the most common control measure. In order to simplify the model, insecticide was the only control measure considered. More precisely, we consider to be the proportion of insecticide applied at time , with .
The system of differential equations for the human population is:
|
|
(1) |
while for the vector is given by
|
|
(2) |
The differential equations are subject to the initial conditions
|
A wide range of parameters is used to build the model, e.g., by we denote the total human population in Madeira; mortality is equal to the inverse of lifespan with a constant rate to human population and for the mosquito population; an infected mosquito can transmit dengue to a susceptible human with a probability per bite while an infected human transmits the disease to a susceptible mosquito with a probability per bite. Table 1 presents the model parameters, their meaning and their values. An explanation is, however, necessary.
There is evidence that a secondary infection increases the risk of developing DHF, which can be explained by the ADE phenomenon (Antibody-Dependent Enhancement) [44]. Recovering from one serotype of dengue, the immune system responds by producing antibodies to the virus, gaining lifelong immunity against that serotype. However, when a new serotype of dengue is contracted, the same antibodies that protect against the previous serotype, facilitate the entry of the new virus into host cells, enhancing the infection, with an increase in viral production. Viral loads are associated with transmissibility, and several researchers believe that subjects are more infectious in the second infection than during the first, and consequently the transmission rate increases [6]. In this paper we use to represent death from DHF and to represent the ADE phenomenon [1, 14]. Note that the total population is not constant in our model because we are considering a probability of death from DHF different from zero. This is in contrast with [36]. Our approach to the multistrain model consists of using different parameter values for different strains: and/or . For simplicity of notation, in Table 1 we omit the specific strain or , .
| Para- | Description | Range of values | Used | Source |
|---|---|---|---|---|
| meter | in the literature | values | ||
| total population | 112000 | [21] | ||
| average daily biting (per day) | 1/3 | [16] | ||
| transmission probability from (per bite) | [0.25, 0.33] | 0.25 | [16] | |
| transmission probability from (per bite) | [0.25, 0.33] | 0.25 | [16] | |
| average lifespan of humans (in days) | [21] | |||
| average viremic period (in days) | [4, 15] | 7 | [9] | |
| average lifespan of adult mosquitoes (in days) | [8, 45] | 15 | [18, 20, 25] | |
| number of eggs at each deposit per capita (per day) | 6 | [37] | ||
| natural mortality of larvae (per day) | 0.2363 | [4] | ||
| maturation rate from larvae to adult (per day) | [1/11, 1/7] | 1/9 | [29] | |
| number of larvae per human | 0.9 | [17, 45] | ||
| ADE phenomenon | [0, 5] | 0,5; 1.1; 2.5 | [27] | |
| probability of death from DHF | [0.01, 0.1] | [8, 47] |
In our model we assume that:
-
•
Infected mosquitoes do not transmit the virus onto their eggs;
-
•
The population is homogeneous;
-
•
There is no immigration or emigration;
-
•
There is no seasonality;
-
•
There is an homogeneous mixing of human and mosquito population, having the vector an equal probability to bite any human;
-
•
Humans and mosquitoes are assumed to be born susceptible.
The scheme of the model (1)–(2) is shown in Figure 2. An arrow pointing into a compartment is associated with a positive member of the corresponding differential equation while an arrow pointing out of the compartment represents a negative member of the equation.
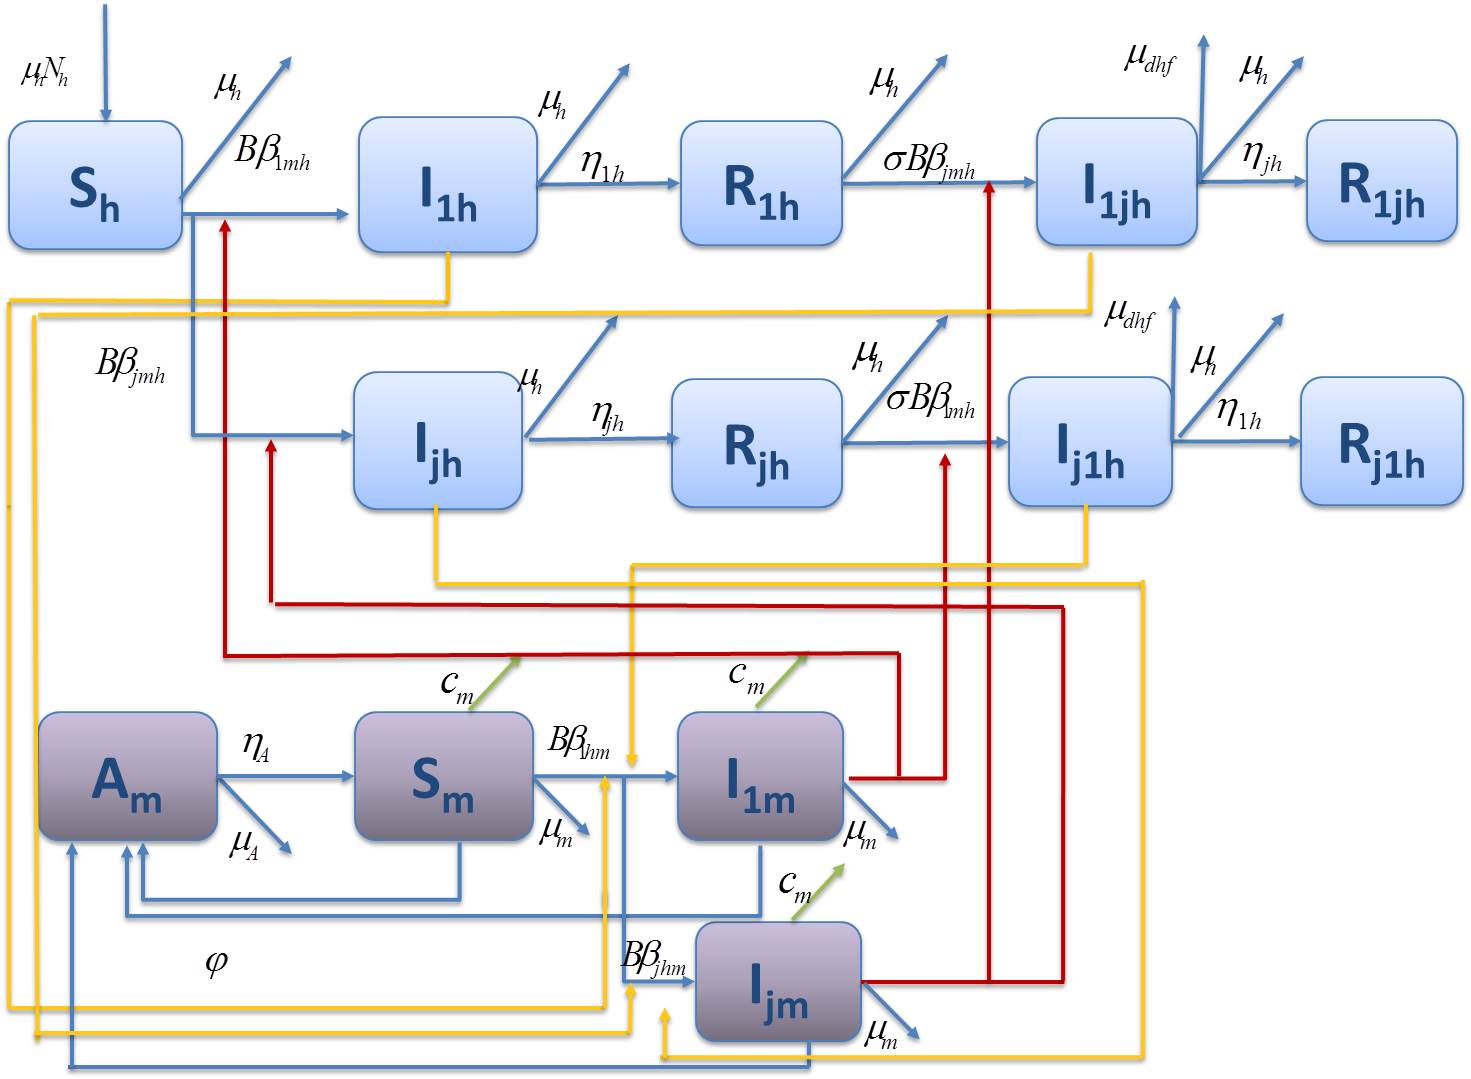
Comparing our model with the previous one [36], this one is more complex. The coexistence of two serotypes of dengue leads to 13 state variables, more than doubling the 6 state variables in the previous model [36]. As a consequence, the interaction between human and vector has become more complex and the number of arrows in Figure 2 has increased with respect to the scheme of [36]. It is also noted that there are no equilibrium points and, therefore, the basic reproduction number based on [42] cannot be computed. This is also in contrast with [36].
The impact of ADE on the model can be profound: single strain models usually cannot have isolated equilibria and show fluctuations without external seasonal drives or noise, while multistrain models with ADE phenomenon may present oscillations [6].
4 Computational experiments
The software used in our simulations was Matlab with the routine ode45. This solver is based on an explicit (4,5) Runge–Kutta formula, the Dormand–Prince pair. The numerical solver ode45 combines fourth and fifth order methods, both of which are similar to the classical fourth-order Runge–Kutta method. These vary the step size, choosing it at each step in an attempt to achieve the desired accuracy.
Our computational experiments simulate a hypothetical outbreak in Madeira Island caused by two different serotypes 1 and , . We considered that the initial values related with serotype DEN-1 are the final values of Madeira’s outbreak of 2012. Funchal has a total population of 112 000. Of these, 2171 were infected. Serotype DEN- is new, so . As the other initial values are unknown, we presumed the following values:
-
•
and , (hypothetical values, assuming that with these infected numbers, health authorities could act and take measures to control the disease);
-
•
, (individuals who have recovered from the outbreak and are now infected by serotype ).
As the first outbreak caused no deaths, all the infected have recovered from serotype . However, of these are now infected by serotype , so
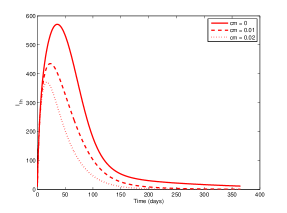
Thus, the initial value for susceptible humans is . We considered different virulence and transmission intensities. Two scenarios are possible: or , and and are not lower than those of DEN-1 (more aggressive case); or , and and do not have higher values than those of DEN-1 (less aggressive case). In order to evaluate the influence of the and parameters and the insecticide control , some numerical tests were carried out. At a first step, we fixed and and tested the model varying the control . The corresponding results are shown in Figure 3. It should be noted that in Figures 3, 5, 6 and 8, the scale of the infected human axis is smaller in secondary infections than in first infections. This was essential due to the following reasons:
-
•
in the first infection people are naive to the disease;
-
•
there are a substantial number of resistant individuals;
-
•
there is a partial and transient immunity from the first infection to the second one, which delays second infections.
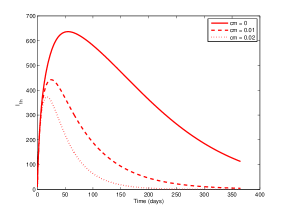
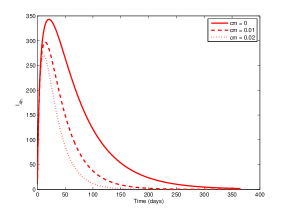
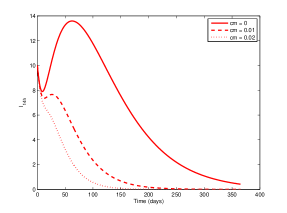
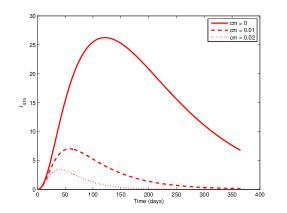
Figure 3 shows the fluctuation of the number of infected human with the application of different proportions of insecticide. It is patent that insecticide is a very efficient measure. Even with small quantities, its influence is huge. Note that with , in the considered time interval, the number of infected is tending to zero.
It is clear that should a new outbreak of dengue with two different serotypes occur, health authorities should pay particular attention to the more aggressive serotype: if the new serotype is DEN-2/3, then the priority is to take care of people infected by DEN-2/3 (see Figure 5); if the new serotype is DEN-, then health authorities should pay particular attention to DEN- (see Figure 3). In all cases, the control has an important role on the number of infected people and “doing nothing” should not be an option to health authorities.
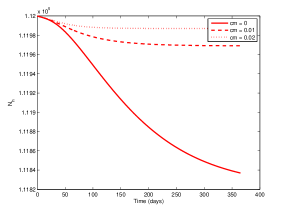
One important information is the evolution of the human population . Figure 4(a) presents this evolution considering and for different controls. Using no insecticide, 450 deaths are expected at the end of 154 days. However, the application of a small quantity of insecticide reduces this number to 50.
(, )
(, )
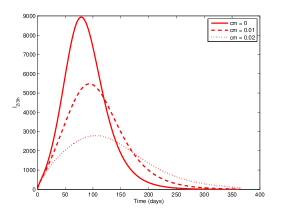
We now increase to keeping and varying the control to study the influence of the transmission probability (see Figure 5). As expected, the number of infected people rises, having increased almost four-fold. It is thus concluded that is a very sensitive parameter. As before, the impact of the control is crucial.
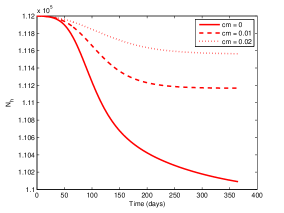
Figure 4(b) reports the evolution of the total population using and for different controls. In this figure the application of insecticide is even more evident: with no control, human population can suffer a significant decline. With , the fluctuation of total population is almost non-existing. Comparing with Figure 4(a), it is also noticeable the influence of . Increasing the transmission probability from infected individuals, the population fall is bigger. Note that starts decreasing at , about the same time the number of secondary infections become significant (Figures 5(c) and (d)).
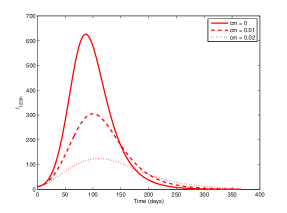
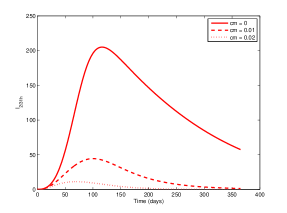
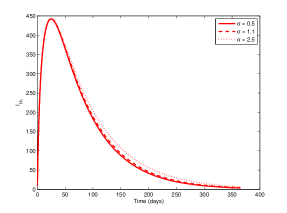
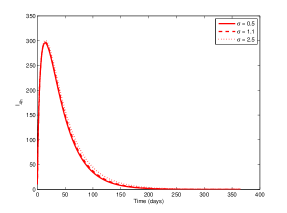
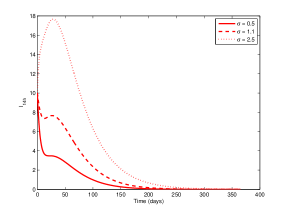
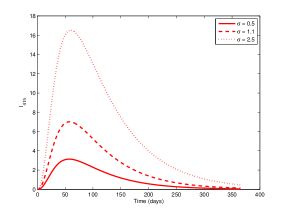
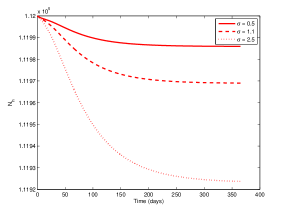
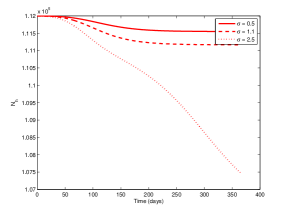
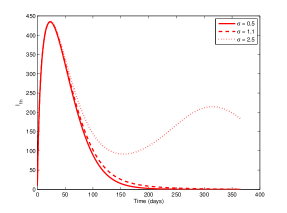
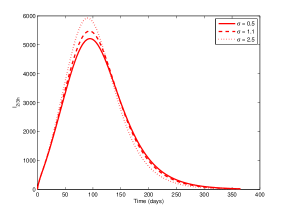
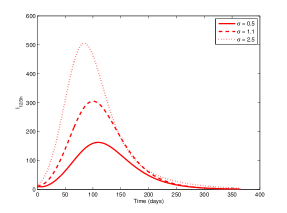
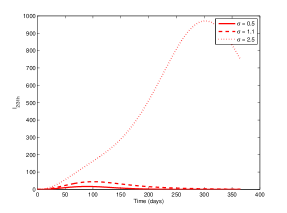
In the second phase of the numerical experiments, we fixed and and tested the model varying (see Figure 6). In Figures 6(a) and 6(b) the influence of the parameter is residual. Although the ADE phenomenon is just related to a secondary infection, slightly affects the number of infected mosquitos and, consequently, has an impact, even though small, on the first infection. For this reason, this small influence only appears a few days after the beginning of the outbreak. In Figures 6(c) and 6(d) the ADE phenomenon is considerable. Increasing from to leads to a five-fold increase of second infections ( and ).
Figures 7 and 8 show the results for increased to while keeping the control and varying . This allows to learn about the influence of the transmission probability ( seems to be more sensitive with at ). On one hand, it is evident in Figure 8 the influence of ADE phenomenon. On the other hand, when compared to Figure 6, it is obvious the importance of the parameters.
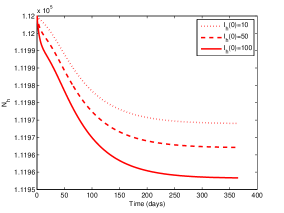
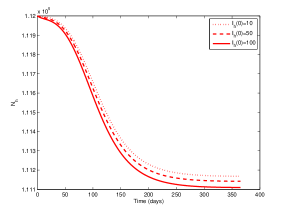
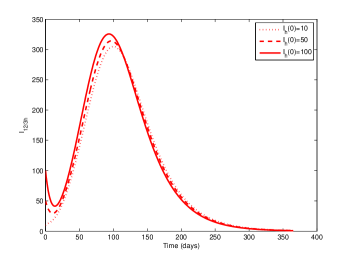
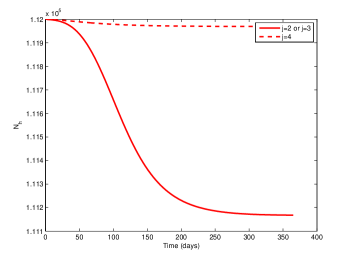
Additionally, we also study how many initial infections of new serotypes would allow these serotypes to persist in the population if no control measures were to be taken. For this, we set the value and considered different initial values of infected people by the new serotype. More precisely, at time zero we considered with . For both serotypes DEN-2/3 or DEN-4 the curves have almost the same shape, the small variations in value being the expected ones: the curves , , , , , , , , , , , , increase continuously with the increase of the initial value ; the curve decrease continuously with the increase of the initial value : see Figure 9.
(, )
(, )
Curiously, as can be seen in Figure 10, an exception in behavior occurs in the first month for the curve , .
We finalize by remarking that the scales of figures for scenario (serotype more aggressive than DEN-1) and for scenario (serotype less aggressive than DEN-1) are quite different. Figure 11 illustrates well how much more aggressive DEN-2 or DEN-3 is than DEN-4.
5 Conclusion
According to the World Health Organization (WHO), at least 40% of the world population is at risk from dengue and several outbreaks have appeared recently in Europe. The first was recorded in Greece and consisted of two serotypes, Madeira’s outbreak was the second epidemics of dengue in Europe. Local authorities in Madeira continue to monitor Aedes aegypti entomological activity through a program of traps [12, 40]. Moreover, the report [13] of the European Centre for Disease Prevention and Control (ECDC) concludes that “The important increase of co-circulation of different dengue virus serotypes worldwide is a potential source of its re-introduction to Madeira in the future” and “The possibility of sustainability of the virus during the winter season and subsequent reemergence when climatic conditions again favor Aedes aegypti mosquito activity exists”. Motivated by these, we proposed an epidemic model for dengue fever infection that considers the simultaneous spreading of two different serotypes throughout shared non-naive host population, with different virulence and transmission intensity. Its dynamics was discussed in the context of Madeira island, and the influence of the infected transmission probability (human and mosquito) analyzed. The Antibody-Dependent Enhancement (ADE), which results from a new infection with a particular serotype in an individual with acquired immunity to a different serotype, was also studied. The higher the value of ADE, the higher is the number of infected individuals. More important, while classical dengue fever causes negligible mortality, ADE leads to the development of a significantly more dangerous dengue. The important role of insecticide as a control measure, is also a relevant conclusion.
This study is useful for strategies of health control on Madeira Island. For example, we used one control variable related with application of insecticide. It turns out that application of insecticide was done in Madeira intensively, mainly carbamate formulations (bendiocarb) and Bacillus thuringiensis israelensis (bti), which is a bacteria-derived toxin that is lethal when ingested by larvae [5]. Indoor spraying at the biting time of the Aedes aegypti mosquito (early morning or late afternoon) is also easily done by population (dwelling rooms were sprayed by inhabitants of Madeira Island at the end of the day with doors closed, e.g., bathrooms, kitchens and toilets). However, the model investigated here is sufficiently general to be applied in other contexts.
Acknowledgements
This work was supported by The Portuguese Foundation for Science and Technology (FCT): Rodrigues and Torres through CIDMA within project UID/MAT/04106/2013; Monteiro by the ALGORITMI R&D Center and project UID/CEC/00319/2013; Torres by project PTDC/EEI-AUT/1450/2012, co-financed by FEDER under POFC-QREN with COMPETE reference FCOMP-01-0124-FEDER-028894. The authors are grateful to Alexandre Aragão for improving the English; and to two referees for several constructive comments and remarks.
References
- [1] B. Adams, E. C. Holmes, C. Zhang, M. P. Mammen, Jr., S. Nimmannitya, S. Kalayanarooj and M. Boots. Cross-protective immunity can account for the alternating epidemic pattern of dengue virus serotypes circulating in Bangkok. PNAS 103(38):14234–14239, 2006.
- [2] R. M. Anderson and R. M. May. Infectious diseases of humans: Dynamics and control. Oxford University Press, 1991.
- [3] A. Balmaseda et al. Serotype-specific differences in clinical manifestations of dengue. Am. J. Trop. Med. Hyg., 74(3):449–456, 2006.
- [4] J. Barrios, A. Piétrius, G. Joya, A. Marrero and H. de Arazoza. A differential inclusion approach for modeling and analysis of dynamical systems under uncertainty. Application to dengue disease transmission. Soft Comput, 17:239–253, 2013.
- [5] S. Bhatt et al. The global distribution and burden of dengue. Nature, 496:504–507, 2013.
- [6] S. Bianco, L. B. Shaw and I. B. Schwartz Epidemics with multistrain interactions: the interplay between cross immunity and antibody-dependent enhancement. Chaos, 19(4):043123, 2009.
- [7] P. Cattand et al. Tropical Diseases Lacking Adequate Control Measures: Dengue, Leishmaniasis, and African Trypanosomiasis. Disease Control Priorities in Developing Countries, DCPP Publications, 451–466, 2006.
- [8] CDC. Centers for Diseases Control and Prevention Dengue Fever (DF). http://www.cdc.gov/dengue/faqFacts/fact.html.
- [9] M. Chan and M. A. Johansson. The Incubation Periods of Dengue Viruses. PLoS ONE, 7(11):e50972, 2012.
- [10] Dengue Virus Net. http://denguevirusnet.com, 2013.
- [11] O. Diekmann and J. A. P. Heesterbeek. Mathematical epidemiology of infectious diseases: Model building, analysis and interpretation. New York, John Wiley and Sons, 2000.
- [12] DGS. Directorate-General of Health. Dengue Madeira. http://www.dgs.pt.
- [13] ECDC. Dengue outbreak in Madeira, Portugal, October November 2012. European Centre for Disease Prevention and Control, Stockholm, 2013.
- [14] L. Esteva and C. Vargas Coexistence of different serotypes of dengue virus, J. Math. Biol., 46:31–47, 2003.
- [15] Z. Feng, J. X. Velasco-Hern ndez Competitive exclusion in a vector-host model for the dengue fever, J. Math. Biol., 35:523–544, 1997.
- [16] D. A. Focks, R. J. Brenner, J. Hayes and E. Daniels. Transmission thresholds for dengue in terms of Aedes aegypti pupae per person with discussion of their utility in source reduction efforts. Am. J. Trop. Med. Hyg., 62:11–18, 2000.
- [17] D. A. Focks, E. Daniels, D. G. Haile, J. E. Keesling. A simulation model of the epidemiology of urban dengue fever: literature analysis, model development, preliminary validation, and samples of simulation results. Am. J. Trop. Med. Hyg., 53:489–506, 1995.
- [18] D. A. Focks, D. G. Haile, E. Daniels and G. A. Mount Dynamic life table model for Aedes aegypti (Diptera: Culicidae): analysis of the literature and model development J. Med. Entomol., 30:1003–1017, 1993.
- [19] I. Gjenero-Margan et al. Autochthonous dengue fever in Croatia, August-September 2010. Euro Surveill. 16(9), 2011.
- [20] L. C. Harrington et al. Analysis of survival of young and old Aedes aegypti (Diptera: Culicidae) from Puerto Rico and Thailand Journal of Medical Entomology, 38:537–547, 2001.
- [21] INE. Statistics Portugal. http://censos.ine.pt
- [22] INSA. National Health Institute Doutor Ricardo Jorge. Dengue Madeira. http://www.insa.pt/sites/INSA/Portugues/ComInf/Noticias/Paginas/DengueMadeiraDiagLab.aspx, 2012.
- [23] G. La Ruche et al. First two autochthonous dengue virus infections in metropolitan France, September 2010. Euro Surveill. 15(39), 2010.
- [24] P. M. Luz, C. T. Codeço, E. Massad and C. J. Struchiner. Uncertainties Regarding Dengue Modeling in Rio de Janeiro, Brazil. Mem. Inst. Oswaldo Cruz, 98(7):871–878, 2003.
- [25] R. Maciel-de-Freitas, W. A. Marques, R. C. Peres, S. P. Cunha and R. Lourenço-de-Oliveira. Variation in Aedes aegypti (Diptera: Culicidae) container productivity in a slum and a suburban district of Rio de Janeiro during dry and wet seasons. Mem. Inst. Oswaldo Cruz, 102:489–496, 2007.
- [26] A. Nisalak et al. Serotype-specific dengue virus circulation and dengue disease in Bangkok, Thailand from 1973–1979. Am. J. Trop. Med. Hyg., 68: 191–202, 2003.
- [27] N. Nuraini, E. Soewono and K.A. Sidarto, Mathematical Model of Dengue Disease Transmission with Severe DHF Compartment, Bull. Malays. Math Sci. Soc, 39(2):143–157, 2007.
- [28] M. Otero, N. Schweigmann and H. G. Solari. A stochastic spatial dynamical model for aedes aegypti. Bull. Math. Biol., 70(5):1297–1325, 2008.
- [29] H. Padmanabha, C. C. Lord and L. P. Lounibos. Temperature induces trade-offs between development and starvation resistance in Aedes aegypti (L.) larvae. Med. Vet. Entomol., 25(4):445–453, 2011.
- [30] H. S. Rodrigues, M. T. T. Monteiro and D. F. M. Torres. Optimization of dengue epidemics: a test case with different discretization schemes. AIP Conf. Proc., 1168(1):1385–1388, 2009. arXiv:1001.3303
- [31] H. S. Rodrigues, M. T. T. Monteiro and D. F. M. Torres. Insecticide control in a dengue epidemics model. AIP Conf. Proc., 1281(1):979–982, 2010. arXiv:1007.5159
- [32] H. S. Rodrigues, M. T. T. Monteiro and D. F. M. Torres. Dynamics of dengue epidemics when using optimal control. Math. Comput. Modelling, 52(9-10):1667–1673, 2010. arXiv:1006.4392
- [33] H. S. Rodrigues, M. T. T. Monteiro and D. F. M. Torres. Dengue in Cape Verde: vector control and vaccination. Math. Popul. Stud., 20(4):208–223, 2013. arXiv:1204.0544
- [34] H. S. Rodrigues, M. T. T. Monteiro and D. F. M. Torres. Bioeconomic perspectives to an optimal control dengue model. Int. J. Comput. Math., 90(10):2126–2136, 2013. arXiv:1303.6904
- [35] H. S. Rodrigues, M. T. T. Monteiro and D. F. M. Torres. Vaccination models and optimal control strategies to dengue. Math. Biosci., 247: 1–12, 2014. arXiv:1310.4387
- [36] H. S. Rodrigues, M. T. T. Monteiro, D. F. M. Torres, A. C. Silva, C. Sousa and C. Conceição. Dengue in Madeira Island. In: Mathematics of Planet Earth: Dynamics, Games and Science (Eds. J. P. Bourguignon, R. Jeltsch, A. Pinto and M. Viana), CIM Series in Mathematical Sciences, Springer, Chapter 32, DOI:10.1007/978-3-319-16118-1_32 arXiv:1409.7915
- [37] H. S. Rodrigues, M. T. T. Monteiro, D. F. M. Torres and A. Zinober. Dengue disease, basic reproduction number and control. Int. J. Comput. Math., 89(3):334–346, 2012. arXiv:1103.1923
- [38] G. F. R. Seixas. Aedes (Stegomyia) aegypti (Diptera, Culicidae) da ilha da Madeira: origem geográfica e resistência aos insecticidas. Master Thesis, Universidade Nova de Lisboa, 2012.
- [39] E. K. Shuman. Global climate change and infectious diseases. Emerging Infectious Diseases. New England Journal of Medicine 362:1061–1063, 2010.
- [40] C. A. Sousa et al. Ongoing outbreak of dengue type 1 in the Autonomous Region of Madeira, Portugal: preliminary report. Euro Surveill 17(49), 2012.
- [41] J. R. Stephenson, Understanding dengue pathogenesis: implications for vaccine design. Bull World Health Organ. 83(4):308–314, 2005.
- [42] P. van den Driessche and J. Watmough. Reproduction numbers and sub-threshold endemic equilibria for compartmental models of disease transmission. Math. Biosci., 180: 29–48, 2002.
- [43] D. W. Vaughn et al. Dengue viremia titer, antibody response pattern, and virus serotype correlate with disease severity. J. Infect. Dis. 181: 2–9, 2000.
- [44] W. M. P. B. Wahala and A. M. de Silva The Human Antibody Response to Dengue Virus Infection. Viruses, 3(12): 2374–2395, 2011.
- [45] T. M. Watson and B. H. Kay Vector competence of Aedes notoscriptus (Diptera: Culicidae) for Barmah Forest Virus and of this species and Aedes aegypti (Diptera: Culicidae) for dengue 1-4 viruses in Queensland, Australia. Journal of Medical Entomology, 36:508–514, 1999.
- [46] H. J. Wearing. Ecological and immunological determinants of dengue epidemics. Proc. Natl. Acad. Sci USA, 103(31):11802–11807, 2006.
- [47] WHO. Dengue: guidelines for diagnosis, treatment, prevention and control. World Health Organization, 2nd edition, 2009.
- [48] WHO. Vector-borne diseases: Dengue. Fact sheet No. 387, March 2014. http://www.who.int/mediacentre/factsheets/fs387/en/index2.html
- [49] A. Wilder-Smith et al. The 2012 dengue outbreak in Madeira: exploring the origins. Euro Surveill., 19(8):pii=20718, 2014.