Triggering Collapse of the Presolar Dense Cloud Core and Injecting Short-Lived Radioisotopes with a Shock Wave. IV. Effects of Rotational Axis Orientation
Abstract
Both astronomical observations of the interaction of Type II supernova remnants (SNR) with dense interstellar clouds as well as cosmochemical studies of the abundances of daughter products of short-lived radioisotopes (SLRIs) formed by supernova nucleosynthesis support the hypothesis that the Solar System’s SLRIs may have been derived from a supernova. This paper continues a series devoted to examining whether such a shock wave could have triggered the dynamical collapse of a dense, presolar cloud core and simultaneously injected sufficient abundances of SLRIs to explain the cosmochemical evidence. Here we examine the effects of shock waves striking clouds whose spin axes are oriented perpendicular, rather than parallel, to the direction of propagation of the shock front. The models start with 2.2 cloud cores and shock speeds of 20 or 40 km s-1. Central protostars and protoplanetary disks form in all models, though with disk spin axes aligned somewhat randomly. The disks derive most of their angular momentum not from the initial cloud rotation, but from the Rayleigh-Taylor fingers that also inject shock wave SLRIs. Injection efficiencies, , the fraction of the incident shock wave material injected into the collapsing cloud core, are ∼ 0.04 - 0.1 in these models, similar to when the rotation axis is parallel to the shock propagation direction. Evidently altering the rotation axis orientation has only a minor effect on the outcome, strengthening the case for this scenario as an explanation for the Solar System’s SLRIs.
1 Introduction
Radio and sub-millimeter observations of the Type II supernova (SNe) remnant (SNR) W44 and its interaction with the W44 giant molecular cloud complex imply the presence of dense clumps of molecular gas that have been struck and compressed to sizes much less than 0.3 pc by the SNR shock front, with shock speeds of 20 to 30 km s-1 (Sashida et al. 2013; Reach et al. 2005). HST images of the Cygnus Loop Type II SNR reveal shock front thicknesses of order pc (Blair et al. 1999). Detailed two dimensional (2D) axisymmetric (Boss & Keiser 2013) and fully three dimensional (3D) (Boss & Keiser 2012, 2014; Li et al. 2014) hydrodynamical models of shock waves with these speeds and thicknesses have demonstrated the viability of triggered collapse of dense cloud cores with simultaneous injection of shock front material into the resulting collapsing protostar and protoplanetary disk. Given the problems with shocks waves associated with AGB and WR star winds (Boss & Keiser 2013), a SNR shock appears to be the leading contender for achieving simultaneous triggering and injection of core-collapse supernova-derived short-lived radioisotopes (SLRIs, e.g., 60Fe and 26Al) into the presolar cloud and the resulting solar nebula (Cameron & Truran 1977; Boss 1995).
Cosmochemical evidence for live 60Fe during the formation of refractory inclusions and chondrites has waxed and waned in recent years. Data on ferromagnesian chondrules from two ordinary chondrites (OC) implied initial 60Fe/56Fe ratios of (Tachibana et al. 2006), whereas bulk sample data from a wide range of meteorites suggested an initial ratio of only (Tang & Dauphas 2012). A combined study of 60Fe and 26Al in chondrules from unequilibrated OC (UOC) implied an initial 60Fe/56Fe ratio of (Mishra & Goswami 2014) and supported a SNe as the source of the SLRIs. Analyses of other chondrules from UOC yielded ratios in the range of (Mishra & Chaussidon 2014). While there is as yet no explanation for the discrepancy between bulk samples and chondrule fragments (Mishra & Chaussidon 2014), a SNe remains as a plausible source for the SLRIs. Indeed, evidence for possible live 135Cs in CAIs suggests its origin in a Type II SNe (or its WR progenitor) close to the presolar cloud (Bermingham et al. 2014). Furthermore, the evidence for live 10Be in FUN-CAIs appears consistent with 10Be formation in the presolar molecular cloud by galactic cosmic rays (GCRs) emitted by a SNR that thereafter triggered the collapse of the presolar cloud core (Tatischeff et al. 2014). Statistical analysis of the SLRI enrichments expected for disks and cloud cores in clusters containing massive stars showed that cloud cores receive a larger dose on average than disks (Adams et al. 2014), favoring the presolar cloud scenario (Cameron & Truran 1977; Boss 1995) over the alternative mechanism of injection into a previously formed solar nebula (Ouellette et al. 2007, 2010).
Given this strong support for the triggering and injection hypothesis for the origin of the SLRIs, we continue to calculate increasingly detailed models of the hydrodynamics of the shock-cloud interactions, in order to further understand the physics of the process. Our previous work in both 2D (Boss & Keiser 2013) and 3D (Boss & Keiser 2014) considered rotating presolar clouds, capable of collapsing to form protostellar disks. Because of symmetry constraints in 2D, these models assumed that the cloud rotation axis was parallel to the direction of shock wave propagation. For ease of comparison, our first 3D rotating cloud models (Boss & Keiser 2014) made this same assumption. Here we present the results of a set of 3D models identical to previous rotating cloud models, but with the rotation axis perpendicular to the shock front direction. We seek to discover what effect, if any, the rotational axis orientation might have on the SNe trigger and injection hypothesis.
2 Numerical Hydrodynamics Code
The numerical models were calculated with the FLASH2.5 adaptive mesh refinement (AMR) hydrodynamics code (Fryxell et al. 2000) in exactly the same manner as in our previous 3D models (Boss & Keiser 2012, 2014), except for changing the initial direction of the target cloud rotation axis to be perpendicular to the shock propagation direction. We give here a brief summary of the basic details of our implementation of the FLASH2.5 AMR code; further details about our implementation may be found in Boss et al. (2010).
We employed FLASH2.5 in Cartesian coordinates (). FLASH uses a block-structured adaptive grid approach, using the PARAMESH package, to enhance the grid resolution in regions with strong gradients of chosen variables. Initially the numerical grid has six grid blocks along the and axes and nine along the axis. The axis is the direction of propagation of the shock wave, while the rotation axis of the target cloud is the axis. The grid blocks each consist of grid points with four levels of grid refinement initially. Refined grids have one half the grid spacings of their parent grids. We use both the density and the color field (defined below) to determine when grid refinement is necessary to follow the shocked regions. While Boss et al. (2010) found that adequate resolution was obtained with a maximum of five or six levels of grid refinement, here the maximum number of levels of grid refinement permitted was increased in some models to seven levels during the evolutions, when the memory allocation of the flash cluster nodes used for the calculations permitted the use of yet another level of grid refinement. Additional levels of grid refinement (beyond four) are necessary in order to attain the highest possible resolution of the dynamically collapsing regions that occur late in the evolutions. With seven levels, the smallest grid spacing reached is then pc AU.
As in our previous models (Boss et al. 2010; Boss & Keiser 2012, 2013, 2014), we used a color field to follow the evolution of shock front gas and dust. This allows us to quantify the efficiency with which the shock front matter is injected into the target molecular cloud core. The target molecular cloud core and the surrounding, ambient low density gas are initially isothermal at 10 K. The shock front and post-shock gas are initially isothermal at 1000 K. This initial shock temperature follows from the C-shock models of Kaufman & Neufeld (1996), who found peak shock temperatures of K for shock speeds in the range of 5-45 km s-1 (see Boss et al. 2010). We then follow the compressional heating as well as cooling of the interacting shock-cloud system by molecular species. In particular, we assume cooling at a rate consistent with cooling by optically thin H2O, CO, and H2 molecules in order to follow the thermodynamics of the shock-cloud interaction. As before, we used Neufeld & Kaufman’s (1993) radiative cooling rate of erg cm-3 s-1, where is the gas-dust temperature in K and is the gas density in g cm-3. This rate is appropriate for cooling caused by rotational and vibrational transitions of optically thin, warm molecular gas (Boss et al. 2010). Note that we do not try to follow the collapsing protostellar objects and disks deep into the nonisothermal collapse regime, after the collapsing central regions become optically thick at densities above g cm-3; we leave this additional physical complication for our future models.
3 Initial Conditions
Table 1 lists the variations in the initial conditions for the six new 3D models. These models have all been previously calculated with the rotational axis aligned with the shock propagation direction, allowing a direct comparison of the results in each case (Boss & Keiser 2014). All models start with 2.2 molecular cloud cores with radii of 0.053 pc and Bonnor-Ebert radial density profiles. The clouds have solid body rotation about the axis with an angular frequency of either or rad s-1. These angular frequencies are typical of observed dense cloud cores (e.g., Harsono et al. 2014).
The shock waves propagate toward the direction with shock speeds of or 40 km s-1. The shock widths are pc for all the models, i.e., the shock widths = 0.1 in units of the standard shock width, 0.0030 pc (Boss et al. 2010). The initial shock densities () are g cm-3 or g cm-3, i.e., 200 or 400 times the reference shock density of g cm-3. Details about why these particular shock wave parameters are appropriate for a supernova shock that has travelled several pc through the interstellar medium prior to smacking the target clouds may be found in Boss & Keiser (2012, 2013, 2014). In particular, Boss et al. (2010) studied the effects of shock speeds ranging from 1 km s-1 to 100 km s-1, and found that only shock speeds in the range of 5 km s-1 to 70 km s-1 were able to trigger collapse and injection into the target cloud assumed here. Boss & Keiser (2013) studied the effects of different shock widths ( = 0.1, 1.0, and 10.0). Our use of = 0.1 is consistent with observations of the Cygnus Loop (Blair et al. 1999) and other SNRs (see Boss & Keiser 2014).
4 Results
As before (Boss & Keiser 2012, 2013, 2014), the shocks strike the top edge of the target clouds and compress the central regions into sustained self-gravitational collapse, while accelerating the clouds downstream in the shock direction. The molecular line cooling keeps the temperatures of the shocked region below 1000 K, while the un-shocked regions remain isothermal at 10 K. Rayleigh-Taylor (R-T) fingers form at the shock-cloud interface, and these R-T fingers are directly responsible for injecting supernova-derived material into the collapsing cloud core. The calculations are terminated once the maximum densities exceed g cm-3, as at those densities the collapsing regions have become optically thick and will no longer be able to cool at the rate appropriate for optically thin regions.
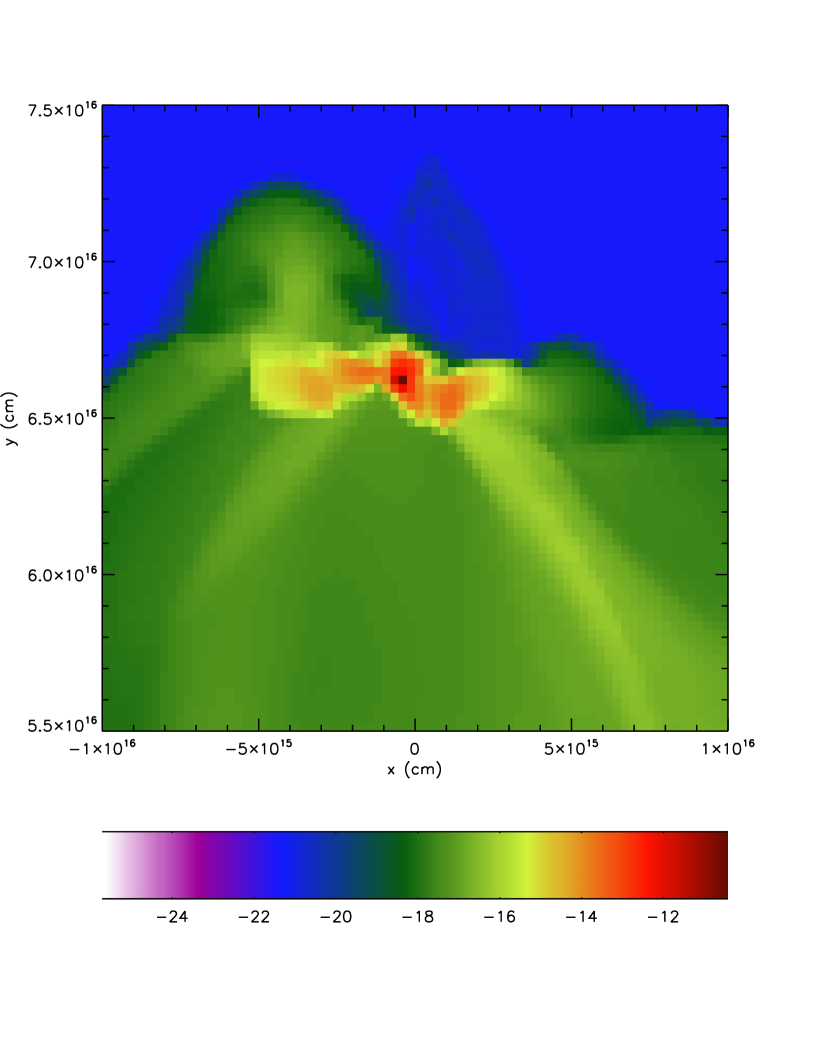
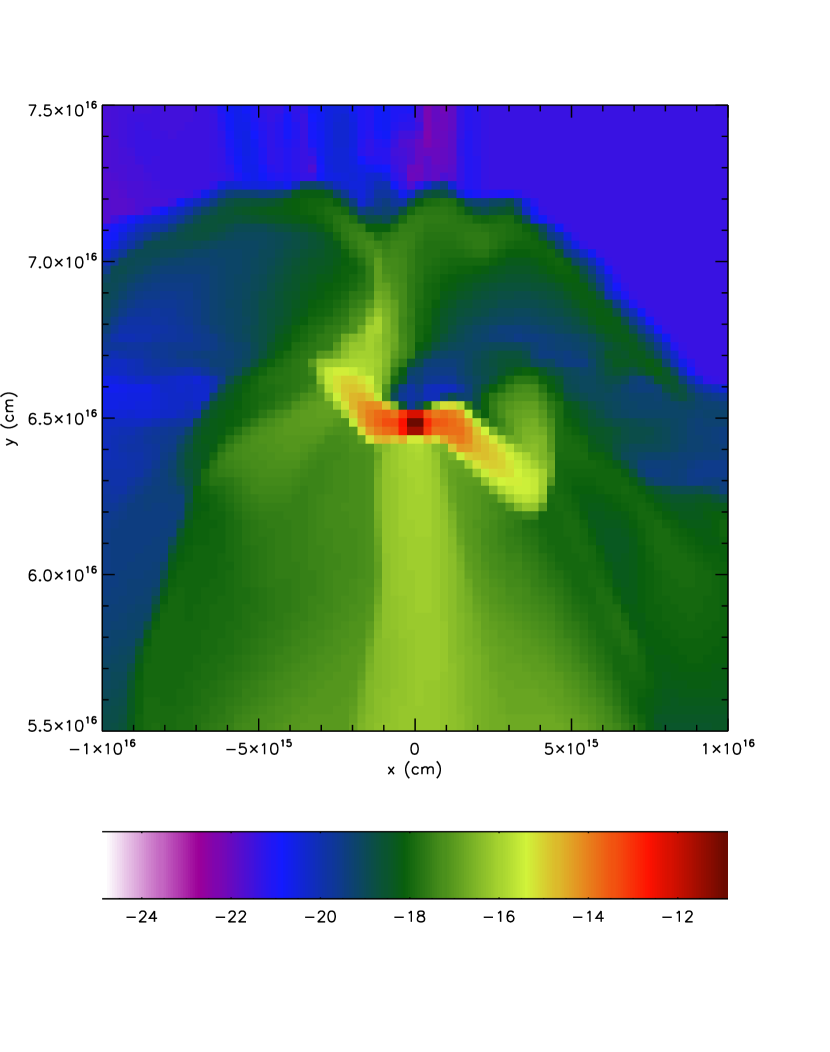
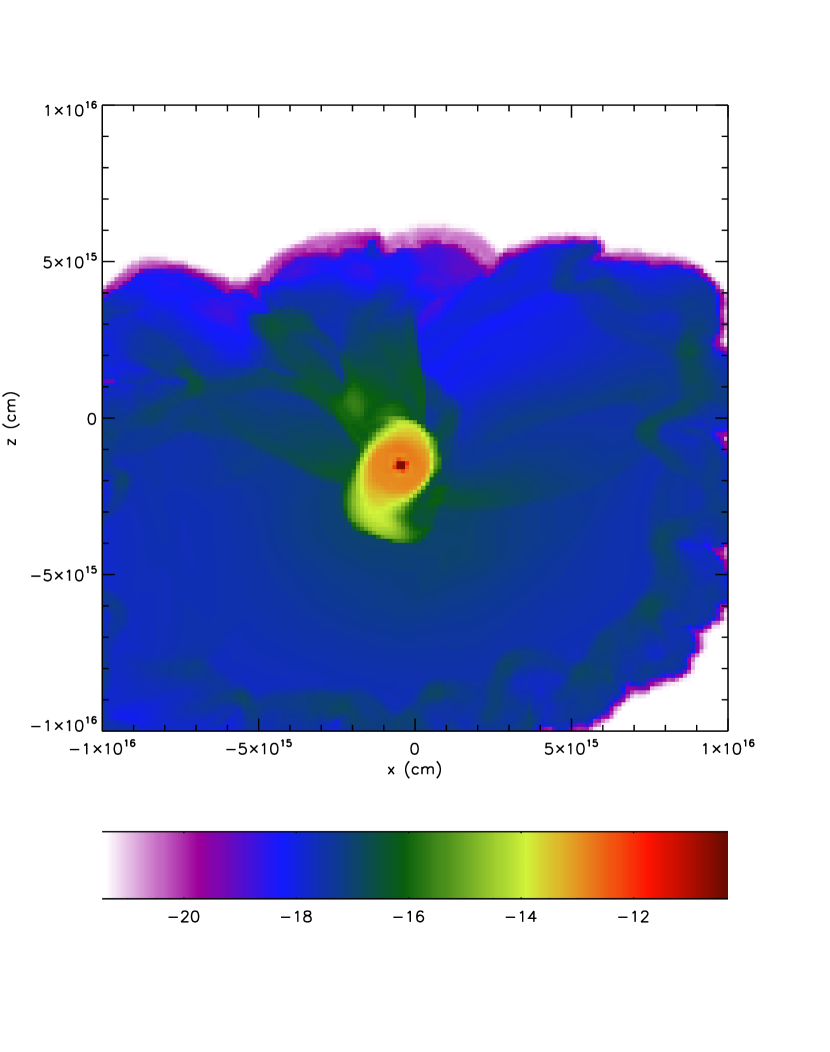
Figures 1 through 6 show the basic results for the six models defined in Table 1. It is evident that central protostars and edge-on disks form in all six models, though with overall disk structures considerably different than in models where the shock direction is parallel to the cloud rotation axes (Boss & Keiser 2014). In the latter case, the edge-on disks are always aligned with their innermost midplanes perpendicular to the shock direction, i.e., with their rotational axes aligned with the shock direction (cf., Figure 4 of Boss & Keiser 2014). This is a direct consequence of their initial rotational axes pointing downward, in the sense of Figures 1 through 6. The outermost disks, however, in the aligned axes models do warp upwards or downwards compared to the innermost disk midplane, beyond distances of AU for rad s-1 and beyond AU for rad s-1. In comparison, the edge-on disks seen in Figures 1 through 6 in some cases have innermost disk midplanes tilted compared to the perpendicular to the shock direction (e.g., Figures 3, 4, 5), while the remainder are closer to being perpendicular (Figure 1, 2, and 6). In all six models, however, the outermost disks warp away from the midplane orientations.
What is most remarkable about the disk orientations in Figures 1 through 6 is the fact that in no case are the disk midplanes seen to be aligned with the direction of the shock propagation, i.e., the axis, as might be expected considering that the initial sense of rotation of the target clouds is around an axis aligned with the axis. This is quite different from the results for the Boss & Keiser (2014) shock-aligned axes models, where the disk midplanes are perpendicular to the initial cloud spin axes, implying that the disks have derived their angular momentum from the initial target clouds. Given the fact that the new disks are warped and otherwise highly distorted (see especially Figure 5), it is unclear how to assign a single, specific direction of an overall disk rotational axis, as there evidently is no single rotational axis for these models. Considering the situation evident in Figures 1 through 6, Table 1 lists the variety of spin directions ascertained for different portions of each disk.
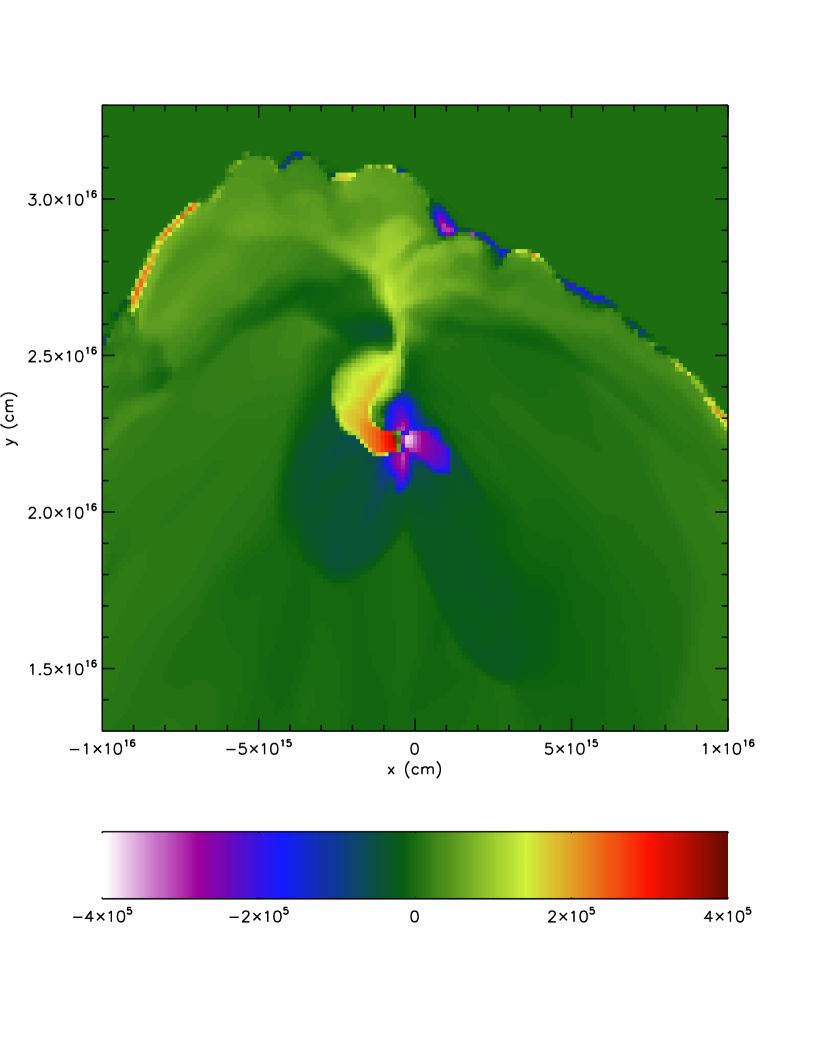
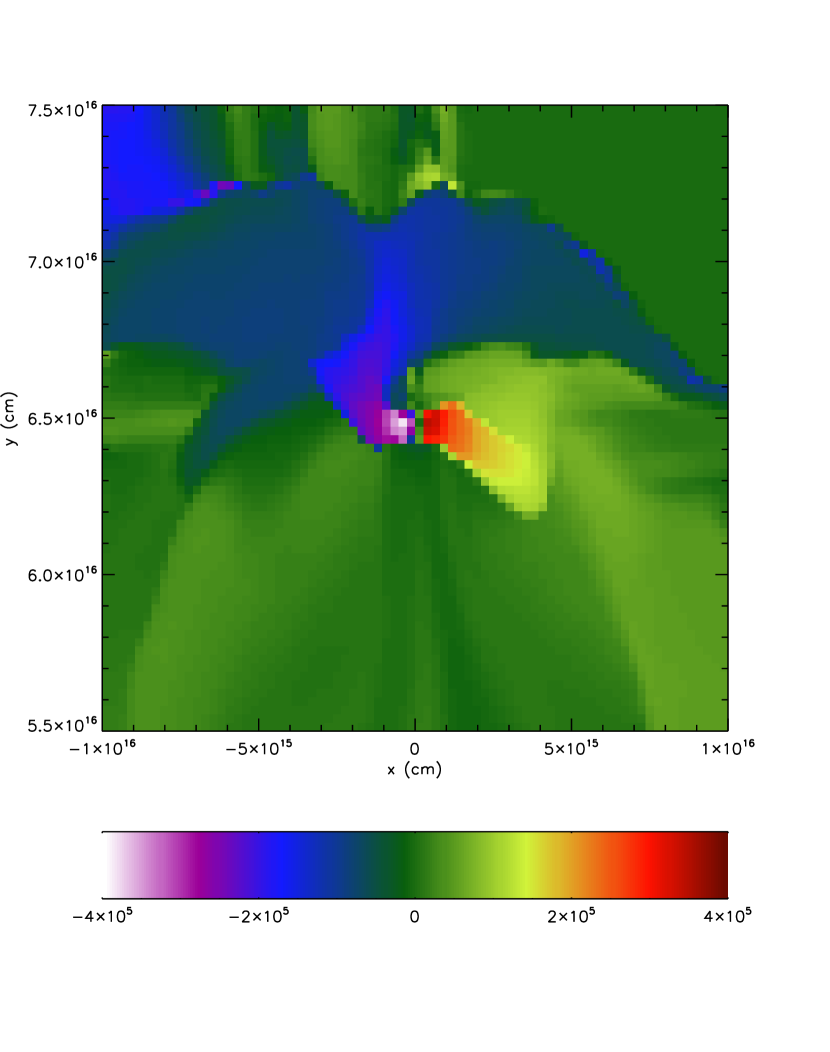
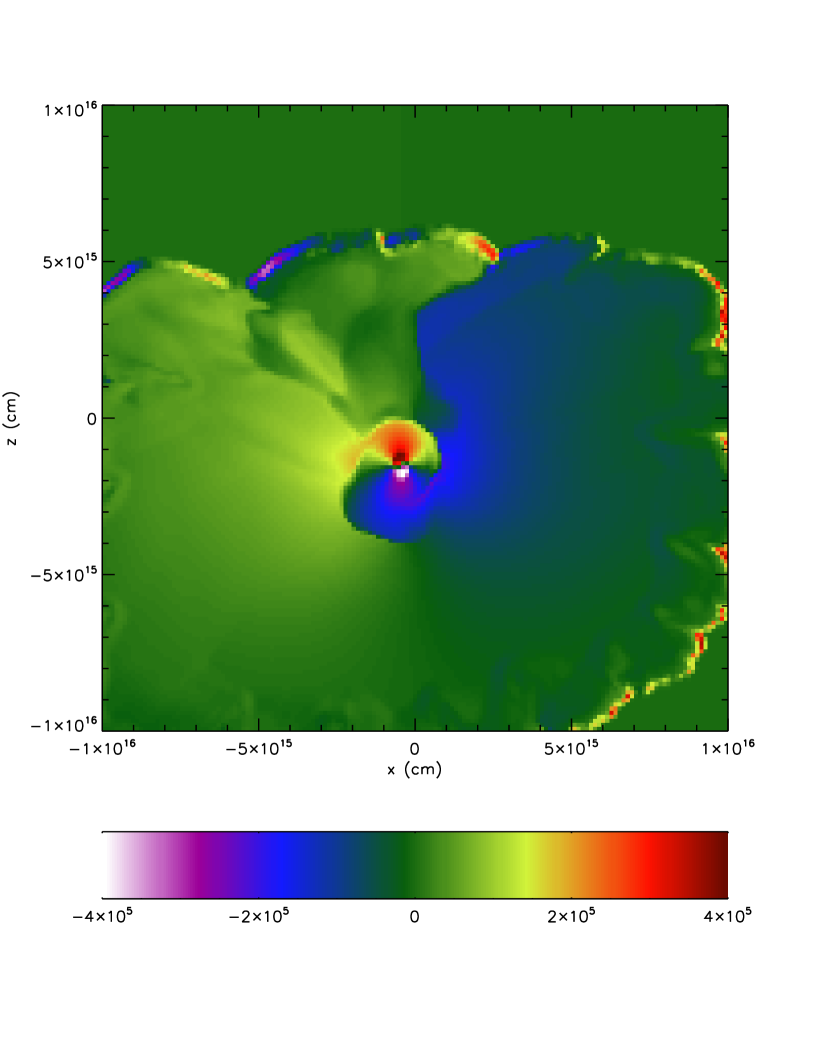
The reason for this puzzling difference in the results can be discovered first by examining the spin directions of the material in the disks. Figure 7 shows the component of the velocity field for model 40-200-pr13, plotted in the same sense as in Figure 1 for this model. Figure 7 shows that the axis of rotation of the innermost disk is along the axis, in the opposite direction of the shock propagation, and perpendicular to the initial target cloud rotation axis. Figure 8 shows the same type of plot for model 20-400-pr14, where the axis of rotation is now aligned with the axis, the opposite direction of model 40-200-pr13, again perpendicular to the initial target cloud rotation axis. Table 1 summarizes the approximate disk spin axis directions for all six models, showing no obvious pattern for the overall orientations. Evidently the disks seen in Figures 1 through 6 did not derive the majority of their angular momentum from the assumed initial cloud angular momentum.
Further investigation of Figures 7 and 8 reveals the source of the bulk of the angular momentum contained in the disks. Figure 7 shows that the largest variations in the velocity field are found in the R-T fingers in the shock front. In fact, in Figure 7, a clear stream of positive gas can be traced from the R-T fingers down to the innermost disk midplane. Similarly, in Figure 8 a large field of negative gas connects the disk midplane with the R-T fingers. This explanation is made even more robust in Figures 9 and 10, where the disk formed in model 40-200-pr13 is seen face-on, with a strong trailing one-arm spiral indicative of the disk spinning with its rotational axis aligned with the direction. Figure 10 plots the velocity component for this model’s midplane, showing the same sense of rotation as previously inferred. A plot of shows the same agreement. Again, Figure 10 shows that the greatest variations in originate in the R-T fingers, and in fact streams of similar velocity gas in the disk can be traced back to R-T fingers with the same velocity sign. Evidently the R-T fingers provide the bulk of the angular momentum for disks formed when the initial rotational axes are not aligned with the shock propagation direction. In general, one would not expect these two to be aligned, so it is important to understand how this could happen.
To further investigate this odd result, it is important to note that when the initial 3D cloud is not rotating at all, i.e., when , no obvious disks form at all, in spite of R-T fingers being present (Boss & Keiser 2012). Instead, the collapsing protostar is roughly spherical (cf., Figure 3 in Boss & Keiser 2012). This implies that it is the interaction of the initial target cloud spin with the R-T fingers formed at the shock-cloud interface that leads to the R-T fingers being sheared and deflected away from motions that would otherwise be more purely directed downward, along the axis. I.e., the momentum of the shock gets converted by the sheared R-T fingers into a complex pattern of and momentum, sufficient to provide the angular momentum of the disks seen in Figures 1 through 6. In support of this explanation, note that the Keplerian velocity of gas orbiting at 100 AU around a protostar with a mass of 0.5 is 2 km -1. Figure 7 shows that 2 km -1 is indeed a typical speed for the velocity component of the gas 100 AU out in the rotating edge-on disk in model 40-200-pr13, consistent with a disk in Keplerian rotation. Similarly, Figure 10 illustrates exactly the same situation for the component of the gas velocity at 100 AU from the central protostar in the face-on disk seen in Figure 9, for this same model. These speeds are the same as can be seen in the R-T fingers evident in Figures 7 and 10, from which the disk gas originated, and cement the case for the angular momentum sufficient to form rotating, Keplerian protostellar disks being derived from the R-T fingers, rather than from the initial cloud rotation.
In this same context, it is important to note that the shocks start with considerably higher speeds along (20 to 40 km s-1) compared to the initial target cloud rotational speeds (no more than 0.1 km s-1 for rad s-1, and no more than 0.01 km s-1 for rad s-1), so it is easy to see how even a small deflection of the shock front momentum carried by the R-T fingers can dominate the outcome for the disks that form. This phenomenon also explains the origin of the outer disk warps seen in the models with aligned rotational axes and shock directions (Boss & Keiser 2012): the addition of material to the disk with velocities influenced by the R-T fingers.
This explanation appears to be consistent with the quite different result of Li et al. (2014), who showed one model (R2) where an initial cloud rotating similar to the present models produced a disk with a spin axis in the expected direction (cf., Figure 2(d) in Li et al. 2014). While there are many differences between the present models and those of Li et al. (2014), e.g., their use of sink cells and our use of detailed thermodynamics, the fact that their R2 model started with a shock speed of 3 km s-1 implies that the shock-derived momentum was unable to overcome the initial cloud rotational motions. In addition, R-T fingers do not appear in their calculations, apparently because of insufficient spatial resolution, in spite of their using an AMR code, ASTROBEAR 2.0 (Li et al. 2014). However, Li et al. (2014) used only three levels of grid refinement, leading to a smallest grid size of about 23 AU, whereas the present models with seven levels of refinement had a smallest grid size of about 9 AU, which could be an important factor. Combined with the other differences between these two sets of models, the fact that Li et al. (2014) did not observe R-T fingers in any of their models ensures that, unlike the present models, where R-T fingers are essential to the injection process, R-T fingers could not dominate the angular momentum of the disk that formed in the Li et al. (2014) model R2.
These calculations imply that besides injecting the SLRIs found in primitive meteorites, R-T fingers may have also delivered the angular momentum that allowed a protostellar disk to form around the nascent protosun, a disk that would evolve to become the protoplanetary disk that formed our Solar System. The fact that the disk spin axis orientations listed in Table 1 are somewhat random implies that protoplanetary disks formed by this mechanism would be expected to have spin axes with roughly random orientations, orientations that are determined by the detailed development of the R-T fingers that delivered the disks’ angular momenta.
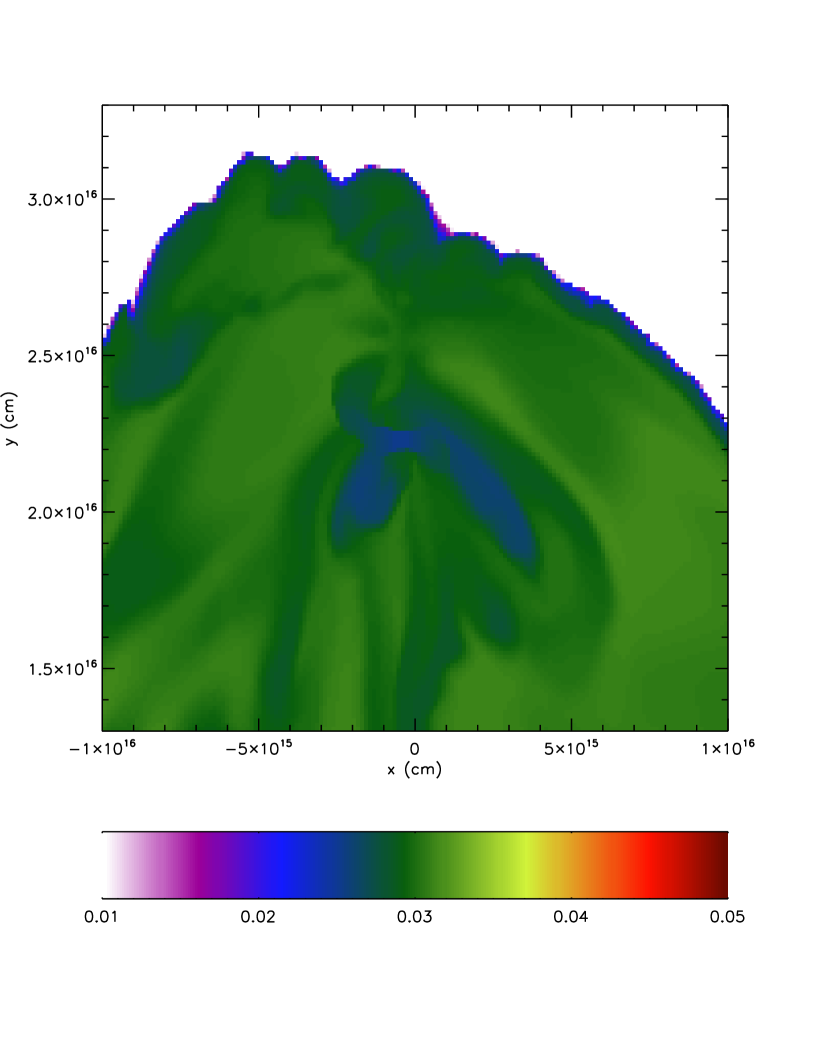
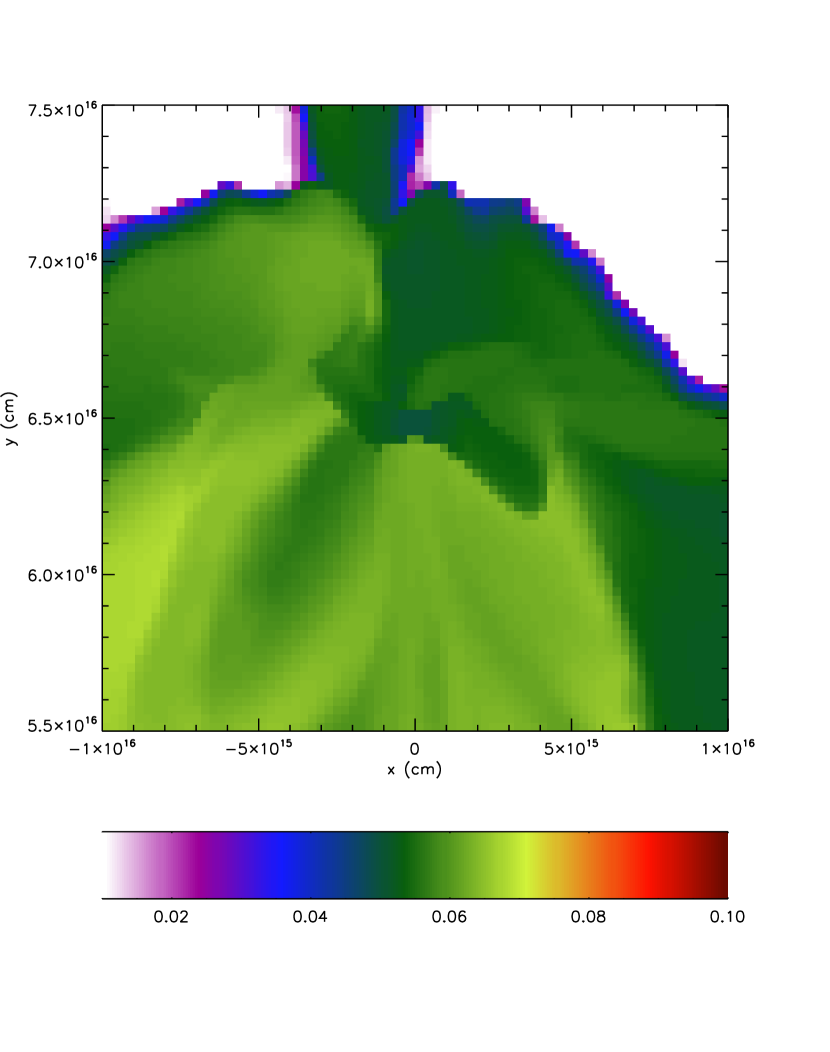
We now turn to a consideration of the injection efficiencies for these models. As before (Boss & Keiser 2012, 2013, 2014), the injection efficiency is defined as the fraction of the incident shock wave material that is injected into the collapsing cloud core. Table 1 lists the calculated values of , along with the mass () of the dynamically collapsing regions (i.e., regions with g cm-3) and the mass of the shock wave-derived material in this same region (). The calculated values of compare favorably with those for otherwise identical models with aligned rotation (cf., Table 1 in Boss & Keiser 2014). E.g., model 40-200-pr13 has = 0.037, whereas the corresponding aligned rotation model from Boss & Keiser (2014) had = 0.032. This same minor increase in is seen for the other models in Table 1 with corresponding aligned axes models as well. Clearly having non-aligned axes does not make SLRI injection any harder. The increased values of can be attributed to the larger role of the R-T fingers in the non-aligned models in providing the bulk of the disk angular momentum, along with the SLRIs. Figures 11 and 12 show the color fields for models 40-200-pr13 and 20-400-pr14, making it clear that by this advanced phase of the evolutions, the R-T fingers have successfully injected shock wave material throughout the collapsing regions.
While the new models exhibit the robustness of our previous estimates of , it must also be noted that the SNe shock waves must sweep up considerable amounts of intervening interstellar gas and dust in order to slow down to the shock speeds considered here and previously found to be the most favorable for injection (e.g., Boss et al. 2010; Boss & Keiser 2013). This implies a large amount of dilution of the pristine SLRIs formed by the SNe. As in Boss & Keiser (2012), one can define a factor to be the ratio of the shock mass originating in the SNe to the mass swept up in the intervening gas and dust. For the present shock speeds, a value of is appropriate (Boss & Keiser 2012). The dilution factor is the ratio of the amount of mass derived from the supernova to the amount of mass derived from the target cloud. For models with (Table 1), the amount of mass in the incident shock wave is 0.30 . Assuming a final mass for the protostar and disk of 1.0 , this results in . This dilution factor is in reasonable agreement with estimates for SNe-derived SLRIs of to (Takigawa et al. 2008). In spite of the ongoing uncertainty over the correct initial abundances of SLRIs in the solar nebula, as discussed in the Introduction, the dilution factor estimates of Takigawa et al. (2008) appear to be the best current values, as argued in Boss & Keiser (2014). Li et al. (2014) found insufficient SLRI injection in their models to explain the cosmochemical evidence. However, as noted above, Li et al. (2014) were not able to resolve the R-T fingers necessary for significant injection, and furthermore studied only shock speeds of 3 or 6 km s-1, at or below the lower end of the range (5 to 70 km s-1) found necessary for simultaneous triggering and injection by Boss et al. (2010).
Finally, we note from Table 1 that the injection efficiencies can be seen to increase as the amount of mass in the collapsing region with g cm-3 increases. Evidently some of the estimates of in Table 1 may be lower bounds, in that the values of are likely to increase when the calculation is taken farther in time and more mass joins the collapsing regions. In practice, the calculations are halted when the collapsing region becomes too dense for the isothermal approximation to be valid (i.e., g cm-3), which is also about when the collapsing regions reach the bottom edge of the computational domain. Both of these limitations are being addressed in a new set of models currently underway.
5 Conclusions
These models have demonstrated that the degree of alignment between a rotating molecular cloud core and the direction of propagation of a shock wave that strikes the cloud core, triggering its self-gravitational collapse, does not have a major effect on the efficiency of injection of shock-derived SLRIs into the collapsing cloud core. In fact, the injection efficiencies in the non-aligned models ( 0.04 to 0.1) are somewhat higher than in the aligned models with identical shock wave parameters (cf., Boss & Keiser 2012, 2013, 2014). Hence from the point of view of the numerical calculations of the mechanism, the supernovae shock wave triggering and injection hypothesis remains as a plausible explanation (Cameron & Truran 1977; Boss 1995).
Remarkably, these new models have also introduced a new feature of the shock wave triggering and injection mechanism: the R-T fingers responsible for SLRI injection can concomitantly result in the injection of enough momentum to largely determine the direction of the resulting disks’ spin axis orientations. In such cases, the R-T fingers may have been responsible not only for the acquisition of the SLRIs inferred to have been present in the most primitive meteorites, but also for the very fact that a rotating protostellar disk was formed, a disk that eventually led to the formation of our planetary system.
Our future 3D FLASH models will investigate the effects of the loss of molecular line cooling once the clouds become optically thick at densities well above g cm-3. In this regime, the collapsing regions begin to heat above 10 K, but continue their collapse toward the formation of the first protostellar core, at g cm-3 (e.g., Boss & Yorke 1995).
References
- (1)
- (2) Adams, F. C., Fatuzzo, M., & Holden, L. 2014, ApJ, 789, 86.
- (3)
- (4) Bermingham, K. R., Mezger, K., Desch, S. J., Scherer, E. E., & Horstmann, M. 2014, Geochim. Cosmochim. Acta, 133, 463
- (5)
- (6) Blair, W. P., Sankrit, R., Raymond, J. C., & Long, K. S. 1999, AJ, 118, 942
- (7)
- (8) Boss, A. P. 1995, ApJ, 439, 224
- (9)
- (10) Boss, A. P., & Keiser, S. A. 2012, ApJL, 756, L9
- (11)
- (12) Boss, A. P., & Keiser, S. A. 2013, ApJ, 770, 51
- (13)
- (14) Boss, A. P., & Keiser, S. A. 2014, ApJ, 788, 20
- (15)
- (16) Boss, A. P., & Yorke, H. A. 1995, ApJ, 439, L55
- (17)
- (18) Boss, A. P., Keiser, S. A., Ipatov, S. I., Myhill, E. A., & Vanhala, H. A. T. 2010, ApJ, 708, 1268
- (19)
- (20) Cameron, A. G. W., & Truran, J. W. 1977, Icarus, 30, 447
- (21)
- (22) Fryxell, B., Olson, K., Ricker, P., et al. 2000, ApJS, 131, 273
- (23)
- (24) Harsono, D., Jorgensen, J. K., van Dishoeck, E. F., et al. 2014, A&A, 562, A77
- (25)
- (26) Kaufman, M. J., & Neufeld, D. A. 1996, ApJ, 456, 611
- (27)
- (28) Li, S., Frank, A., & Blackman, E. G. 2014, MNRAS, 444, 2884
- (29)
- (30) Mishra, R. K., & Chaussidon, M. 2014, EPSL, 398, 90
- (31)
- (32) Mishra, R. K., & Goswami, J. N. 2014, Geochim. Cosmochim. Acta, 132, 440
- (33)
- (34) Neufeld, D. A., & Kaufman, M. J. 1993, ApJ, 418, 263
- (35)
- (36) Ouellette, N., Desch, S. J., & Hester, J. J. 2007, ApJ, 662, 1268
- (37)
- (38) Ouellette, N., Desch, S. J., & Hester, J. J. 2010, ApJ, 711, 597
- (39)
- (40) Reach, W. T., Rho, J., & Jarrett, T. H. 2005, ApJ, 618, 297
- (41)
- (42) Sashida, T., Oka, T., Tanaka, K., et al. 2013, ApJ, 774, 10
- (43)
- (44) Tachibana, S., Huss, G. R., Kita, N. T., Shimoda, G., & Morishita, Y. 2006, ApJ, 639, L87
- (45)
- (46) Takigawa, A., Miki, J., Tachibana, S., et al. 2008, ApJ, 688, 1382
- (47)
- (48) Tang, H., & Dauphas, N. 2012, EPSL, 59, 248
- (49)
- (50) Tatischeff, V., Duprat, J. & De Séréville, N. 2014, ApJ, 796, 124
- (51)
| Model | spin direction | ||||||
|---|---|---|---|---|---|---|---|
| 40-200-pr13 | 40 | 200 | 0.45 | 0.011 | 0.037 | + | |
| 40-200-pr14 | 40 | 200 | 0.49 | 0.012 | 0.040 | - | |
| 20-200-pr13 | 20 | 200 | 0.95 | 0.028 | 0.093 | - to + to + | |
| 20-200-pr14 | 20 | 200 | 1.04 | 0.031 | 0.103 | - to + to - | |
| 20-400-pr13 | 20 | 400 | 0.64 | 0.032 | 0.053 | - to - | |
| 20-400-pr14 | 20 | 400 | 0.72 | 0.036 | 0.060 | - |