Engineering two-dimensional electron gases at the and surfaces of TiO2 anatase using light
Abstract
We report the existence of metallic two dimensional electron gases (2DEGs) at the and surfaces of bulk-insulating TiO2 anatase due to local chemical doping by oxygen vacancies in the near-surface region. Using angle-resolved photoemission spectroscopy, we find that the electronic structure at both surfaces is composed of two occupied subbands of orbital character. While the Fermi surface observed at the termination is isotropic, the 2DEG at the termination is anisotropic and shows a charge carrier density three times larger than at the surface. Moreover, we demonstrate that intense UV synchrotron radiation can alter the electronic structure and stoichiometry of the surface up to the complete disappearance of the 2DEG. These results open a route for the nano-engineering of confined electronic states, the control of their metallic or insulating nature, and the tailoring of their microscopic symmetry, using UV illumination at different surfaces of anatase.
In its pure stoichiometric form, the transition metal oxide (TMO) TiO2 is a transparent insulator that crystallizes in mainly two different phases: rutile and anatase. Both phases have been studied extensively over the last decades, due to their photocatalytic properties discussed in several reviews Diebold2003 ; Zhang2012 ; Henderson2011 ; Fujishima2008 . Recently, a strong interest in the anatase phase of TiO2 also surged, owing to its potential for applications in other research fields. For instance, networks of anatase nanoparticles are found in dye-sensitized solar cells Hagfeldt2010 ; Gratzel2009 , anatase thin films can be used as transparent conducting oxides Furubayashi2005 , and devices based on anatase can be envisioned in spintronics Matsumoto2001 ; Fukumura2004 . To harness such a wide range of functionalities and guide potential applications using anatase, it is thus critical to understand its microscopic electronic structure, which will be ultimately responsible for the remarkable properties of this material. Moreover, as most applications in microelectronics or heterogeneous catalysis involve essentially the electronic states at the material’s surface, it is crucial to directly measure and characterize such states.
More generally, the study of two-dimensional electron gases (2DEGs) in TMO surfaces/interfaces has become a very active field of research. The archetypal example, SrTiO3-based heterostructures, display many fundamentally interesting properties Mannhart2010 ; Zubko2011 ; Hilgenkamp2013 , such as field-effect induced insulator-to-superconductor transitions Caviglia2008 , magnetism Brinkman2007 and the coexistence of magnetism and superconductivity Dikin2011 . More recently, the discoveries of 2DEGs at the bare , and surfaces of SrTiO3 Santander-Syro2011 ; Meevasana2011 ; Plumb2013 ; Wang2014 ; Roedel2014 ; Walker2014 and KTaO3 King2012 ; Santander-Syro2012 ; Bareille2014 , triggered new avenues of research. Additionally, very recent spin-resolved measurements of the 2DEG on SrTiO3 revealed a giant spin splitting of its electronic structure Santander-Syro2014 , epitomizing the richness of physical properties that can be found in these 2DEGs.
It is well established that the TiO atomic planes, and their ability to accommodate chemical doping by oxygen vacancies at the surface region, play a key role in the formation of the 2DEG at the surface of SrTiO3 . Thus, as a step forward to understand the formation of 2DEGs in TMOs, it is natural to focus on pure TiO2 crystals such as rutile or anatase. In fact, it is known that, for both rutile and anatase crystal surfaces, UV or electron irradiation creates oxygen vacancies Knotek1978 ; Shultz1995 ; Tanaka2004 . But while 2DEGs can be readily obtained at various anatase surfaces, as we will show further, the failure to observe 2DEGs on the cleaved or in-situ prepared surfaces of rutile TiO2 (Ref. Moser2013 and Supplemental Material), indicates that other factors are equally important. In fact, excess electrons in TiO2, due to oxygen vacancies at the surface, form polarons which behave quite differently for the rutile and anatase phases Setvin2014 . This demonstrates that structural factors, such as surface lattice distorsions, can determine the fate of those electrons. Thus, to elucidate the origin and realization of 2DEGs in different oxides, it is essential to probe the surface electronic structure arising in different lattice configurations.
Here we report the observation of 2DEGs at the and surfaces of TiO2 anatase. Using angle resolved photoemission spectroscopy (ARPES), we find that, for both surfaces, the electronic structure consists of two light bands of character. While the Fermi surface at the surface is isotropic, the one at the surface is highly anisotropic, reflecting the symmetry of the surface layer Roedel2014 . Moreover, we show that the character of the excess electrons (localized or delocalized) depends on the concentration of oxygen vacancies, and that the 2DEG disappears, leaving no mobile conduction electrons near the Fermi level, if the surface is reduced too much by intense UV irradiation.
The ARPES measurements were conducted at the Synchrotron Radiation Center (SRC, University of Wisconsin, Madison) and the CASSIOPEE beamline of Synchrotron Soleil (France) on surfaces cleaved at low temperatures under ultra-high vacuum – see Supplemental Material for details about the sample preparation and measurements. All through this paper, directions and planes are defined in the simple tetragonal conventional cell of anatase. We note the crystallographic directions in real space, the corresponding directions in reciprocal space, and the planes orthogonal to those directions. The indices , , and of correspond to the reciprocal lattice vectors of the body-centered unit cell.
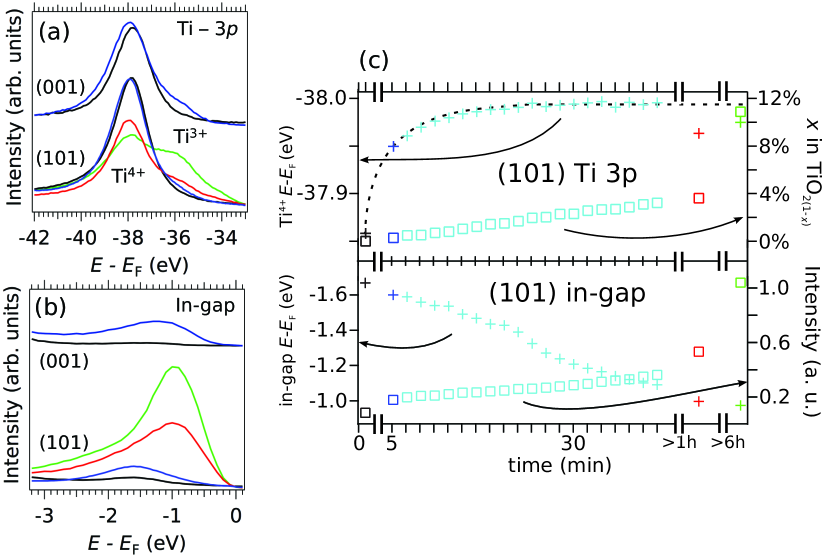
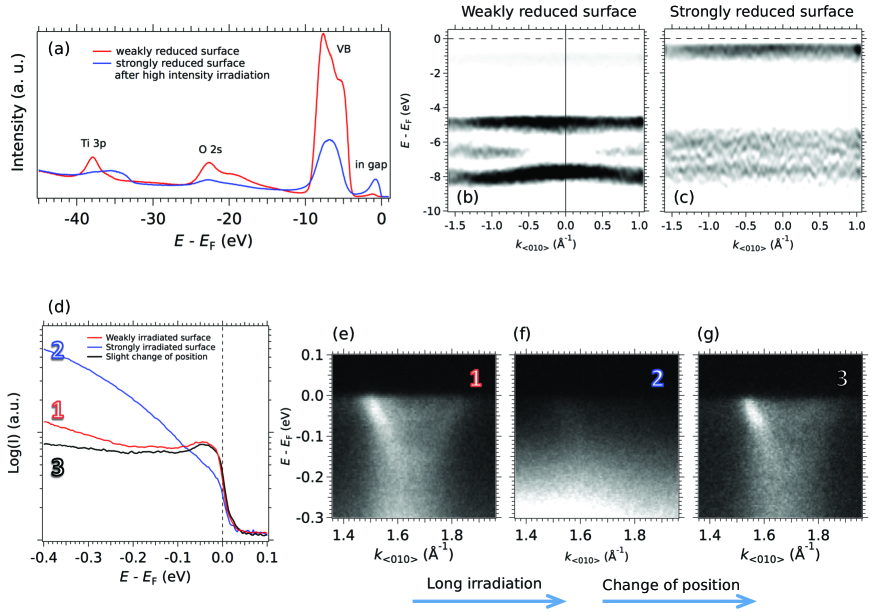
As shown in Figs. 1(a) and 1(b), the presence of oxygen vacancies in the surface region of anatase can be identified in the photoemission spectra by the formation of a shoulder in the Ti- peak related to a lower valence of the Ti cation, and the appearance of an in-gap state Thomas2003 around eV below the Fermi level (), corresponding to electrons trapped near oxygen vacancies Setvin2014 , The black curves were measured shortly after the first exposure of the sample to the synchrotron radiation, while the blue, red and green curves were recorded at later subsequent times specified respectively by the abscissas of the blue, red and green open squares in Fig. 1(c).
As seen in Fig.1(a), the peak position of the Ti- peak shifts to higher binding energies upon UV irradiation, demonstrating the band bending (bb) at the surface. We fit the Ti- peak by one or two Voigt functions plus a Shirley background to determine the contribution of Ti4+ and Ti3+ states to the line shape. This yields a shift of Ti4+ peak of meV for the surface, and meV for the surface, which corresponds to the minimal band bending at the surfaces averaged over the photoemission probing depth at the used photon energy. The actual band bending might be larger, as oxygen vacancies might be already induced at the surface by the cleaving process or by the short beam exposure before the first measurement.
The red and green curves in Figs. 1(a) and 1(b), show that many more oxygen vacancies can be induced at the TiO2 surface than at the surface, in agreement with previous studies Thomas2007 . The band bending (peak position of the Ti4+ peak) and concentration of oxygen vacancies (ratio between the Ti3+ and total Ti- peak area) for the blue, green, and red curves as well as for intermediate measurements are plotted in figure 1(c) for the specific case of the anatase surface. This shows that the band bending saturates at rather low concentration of vacancies at the surface. In fact, recent theoretical studies on the electronic structure of SrTiO3 Jeschke2014 ; Hao2014 suggest that, for a high concentration of oxygen vacancies, excess electrons do not fill up the conduction band any longer, but form only localized states, and thus do not contribute to the rigid band shift. Additionally, as we will see later, the 2DEG disappears if a high concentration of oxygen vacancies is created.
Similarly, as shown in figures 1(b) and (c) (lower panel), the intensity and binding energy of the in-gap state evolve significantly upon UV irradiation, both for the and surfaces. Possible explanations for the different binding energies are that the oxygen vacancies are located at different lattice sites and/or forming clusters Jeschke2014 , or the existence of different types of defects Valentin2009 ; Sanchez-Sanchez2013 .
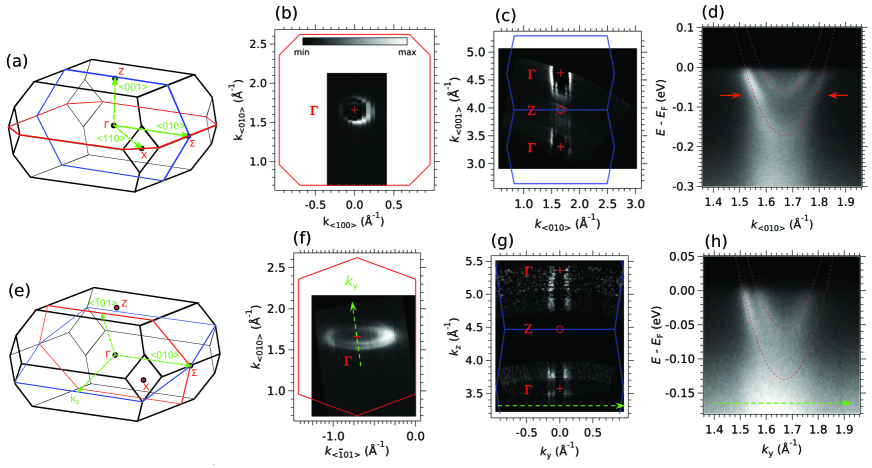
Thereafter, we focus on the electronic structure of the 2DEG at the Fermi level, obtained once a stable band-bending has been attained after weak exposure to UV irradiation (typically min) – see Fig. 1(c). Figure 2(a) shows the bulk Brillouin zone of anatase, its high symmetry directions, and the planes of measurements at its cleaved surface. The Fermi surface at the plane, shown in figure 2(b), consists of two circles of orbital character, confirmed by light polarization dependent measurements presented in the Supplemental Material, similar to the case of SrTiO3 Santander-Syro2011 ; Meevasana2011 ; Plumb2013 . The quasi-2D character of these two electronic states is strictly demonstrated by the Fermi surface map in the plane, perpendicular to the surface plane, shown in figure 2(c). This Fermi surface shows that the bands are essentially non dispersing along over a bulk Brillouin zone, thereby confirming the confined character of the electrons close to the surface. Figure 2(d) presents the energy-momentum map close to the bulk point along the cut parallel to the direction shown in panel (a). Two dispersive light bands are visible. Their bottoms are at meV for the upper band, and meV for the lower band. The Fermi momenta of Å-1 and Å-1 and the experimental band dispersions are given by the peak positions of the momentum distribution curves (MDCs) at and below . A parabolic fit to the band dispersion yields an effective mass of approximately , which agrees well with theoretical Huy2011 ; Kamisaka2009 and experimental Hirose2009 results on bulk Nb-doped anatase. Assuming two spin orientations per band, this gives an electron concentration of cm-2, or about electrons per , where is the short lattice constant of the tetragonal lattice and the cross section of the unit cell in the plane. Note that a kink in the dispersion at a binding energy of about meV is visible (red arrows). In the case of bulk states of anatase, such a kink has been attributed to electron-phonon coupling and studied in detail by Moser et al. Moser2013 .
Next, we present the ARPES measurements on the surface of anatase. The bulk Brillouin zone is shown again for clarity in Fig. 2(e), together with relevant directions for the surface and the planes of the measured Fermi surfaces. Figure 2(f) shows the Fermi surface on the plane. It consists of two ellipses of identical shape, corresponding again to orbitals, similar to the derived ellipses observed for the 2DEG at the SrTiO3 surface Wang2014 ; Roedel2014 . The Fermi surface map in the plane, perpendicular to the cleaved surface, is shown in figure 2(g). The bands are essentially not dispersing along , indicating their 2D character. Note that, in contrast to the surface, the intensity of the 2DEG states in the plane at the surface drops quickly far from bulk points, due to final-state effects in the photoemission cross-section (see the discussion in the Supplemental Material of Roedel2014 ). Figure 2(h) shows the energy-momentum map close to the bulk point along the direction. As in the surface, two light bands, upper and lower, are also observed in this case. Their bottoms of are located at meV and meV, respectively. The Fermi momenta taken from the Fermi surface in Fig. 2(f) are Å Å-1 in the direction and Å Å-1 in the . The parabolic dispersion based on the experimental Fermi momenta and band bottom energies yields an effective mass of along the direction, very close to the one measured at the surface along the same direction. Assuming again 2 spins per band, this gives an electron concentration of cm-2, three times larger than the one at the surface, which is probably related to the higher concentration of oxygen vacancies at the surface Thomas2007 .
The presence of two non-degenerate bands of identical orbital character directly implies that the probed electronic structure is not simply the one expected for bulk anatase. For SrTiO3, the existence of different subbands has been related to the confinement of the electronic states in a quantum well at the surface Santander-Syro2011 ; Meevasana2011 . More recently, spin-resolved ARPES experiments related the two -bands in SrTiO3 to different spin polarizations of the ground-state subband Santander-Syro2014 . Whether or not a magnetic order is also present at the oxygen-deficient surface of TiO2 anatase cannot be deduced from the ARPES data presented in this paper. Note that magnetic order in thin films of TiO2 due to oxygen vacancies was previously observed and discussed HoaHong2006 ; Rumaiz2007 ; DaeYoon2008 ; Golmar2008 ; Coey2010 ; Coey2010a , and is thus a potential reason for the observed splitting of the -bands. Further experimental work is necessary to clarify the possible magnetism at the oxygen-deficient surface of TiO2 anatase.
In contrast to the 2DEGs at the surface of SrTiO3 and KTaO3, our ARPES data in TiO2 anatase do not show any heavy ( or ) subbands –which we confirmed by complementary measurements as a function of photon polarization and energy, shown in the Supplemental Material. The degeneracy of the three orbitals is lifted in bulk anatase Asahi2000 due to its tetragonal crystal structure and the inequivalent Ti-O bonding in the plane compared to the direction. Consequently, the electron gases confined at the surfaces of TiO2 anatase are only composed of electrons of -orbital character. As shown in the Supplemental Material, the spatial extent of the 2DEGs in anatase is similar to the ones at the surfaces of SrTiO3 and KTaO3, namely about nm.
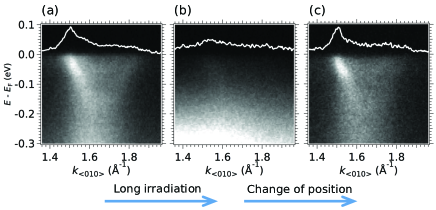
We finally show that exposure to a large UV irradiation dose leads to the local destruction of the 2DEG. Figure 3(a) displays the energy-momentum map around measured in a freshly-cleaved anatase surface after only a few minutes of UV irradiation. The 2DEG is clearly visible. However, as shown in Fig. 3(b), the spectral weight of the dispersing features essentially disappears after 1-2 hours of exposure to UV light, leaving almost no intensity at the Fermi level. As seen in figure 3(c), the 2DEG is fully recovered after moving the UV spot to a neighboring region in the sample, not irradiated before, and illuminating for a few minutes. As shown in the Supplemental Material, a high concentration of oxygen vacancies induced by the UV irradiation also destroys the crystallinity at the surface, which might in turn lead to the localization of the itinerant electrons forming the 2DEG. As the size of the beam spot is only , the strong reduction of the surface is local.
In conclusion, we demonstrated the existence of 2DEGs at the and surface of TiO2 anatase. The two subbands composing the 2DEGs form concentric circular Fermi surfaces at the termination and ellipsoidal Fermi surfaces at the termination. Such orientational tuning of the Fermi sea symmetries is wholly analogous to the one found at different surfaces of SrTiO3 Roedel2014 . Furthermore, we found that light irradiation locally dopes the anatase surfaces, while the behavior of the excess electrons, i.e. delocalized or localized, depends on the concentration of oxygen vacancies at the surface, eventually resulting in the local destruction of the 2DEG after a high UV irradiation dose. This effect, never observed for 2DEGs at other oxide surfaces, shows that UV light can be used to tailor locally the surface order/disorder in anatase, and thus engineer nano-patches of metallic 2DEG alongside patches of disordered insulating material.
We thank Bruno Domenichini for discussions. Work at the CSNSM is supported by public grants from the French National Research Agency (ANR) (project LACUNES No ANR-13-BS04-0006-01) and the “Laboratoire d’Excellence Physique Atomes Lumière Matière” (LabEx PALM project ELECTROX) overseen by the ANR as part of the “Investissements d’Avenir” program (reference: ANR-10-LABX-0039). T. C. R. acknowledges funding from the RTRA–Triangle de la Physique (project PEGASOS). A.F.S.-S. and M.G. acknowledge support from the Institut Universitaire de France.
References
- (1) U. Diebold, Surf. Sci. Rep. 48, 53 (2003).
- (2) Z. Zhang and J.T. Yates, Chem. Rev. 112, 5520 (2012).
- (3) M.A. Henderson, Surf. Sci. Rep. 66, 185 (2011).
- (4) A. Fujishima, X. Zhang, and D. Tryk, Surf. Sci. Rep. 63, 515 (2008).
- (5) A. Hagfeldt, G. Boschloo, L. Sun, L. Kloo and H. Pettersson, Chem. Rev. 110, 6595 (2010).
- (6) M. Grätzel, Acc. Chem. Res. 42, 1788 (2009).
- (7) Y. Furubayashi, T. Hitosugi, Y. Yamamoto, K. Inaba, G. Kinoda, Y. Hirose, T. Shimada and T. Hasegawa, Appl. Phys. Lett. 86, 252101 (2005).
- (8) Y. Matsumoto, Science 291, 854 (2001).
- (9) T. Fukumura, Y. Yamada, H. Toyosaki, T. Hasegawa, H. Koinuma, and M. Kawasaki, Appl. Surf. Sci. 223, 62 (2004).
- (10) J. Mannhart and D.G. Schlom, Science 327, 1607 (2010).
- (11) P. Zubko, S. Gariglio, M. Gabay, P. Ghosez and J.-M. Triscone, Annu. Rev. Condens. Matter Phys. 2, 141 (2011).
- (12) H. Hilgenkamp, MRS Bull. 38, 1026 (2013).
- (13) A.D. Caviglia, S. Gariglio, N. Reyren, D. Jaccard, T. Schneider, M. Gabay, S. Thiel, G. Hammerl, J. Mannhart and J.-M. Triscone, Nature (London) 456, 624 (2008).
- (14) A. Brinkman, M. Huijben, M. van Zalk, J. Huijben, U. Zeitler, J.C. Maan, W.G. van der Wiel, G. Rijnders, D.H.A. Blank and H. Hilgenkamp, Nat. Mater. 6, 493 (2007).
- (15) D.A. Dikin, M. Mehta, C.W. Bark, C.M. Folkman, C.B. Eom and V. Chandrasekhar, Phys. Rev. Lett. 107, 056802 (2011).
- (16) A.F. Santander-Syro, O. Copie, T. Kondo, F. Fortuna, S. Pailhès, R. Weht, X.G. Qiu, F. Bertran, A. Nicolaou, A. Taleb-Ibrahimi, P. Le Fèvre, G. Herranz, M. Bibes, N. Reyren, Y. Apertet, P. Lecoeur, A. Barthélémy and M.J. Rozenberg, Nature (London) 469, 189 (2011).
- (17) W. Meevasana, W.; P.C.D. King, R.H. He, S.-K. Mo, M. Hashimoto, A. Tamai, P. Songsiriritthigul, F. Baumberger and Z.-X. Shen, Nat. Mater. 10, 114. (2011)
- (18) N.C. Plumb, M. Salluzzo, E. Razzoli, M. Mansson, M. Falub, J. Krempasky, C.E. Matt, J. Chang, M. Schulte, J. Braun, H. Ebert, J. Minár, B. Delley, K.-J. Zhou, T. Schmitt, J. Mesot, M. Shi, L. Patthey and M. Radović, Phys. Rev. Lett. 113, 086801 (2013).
- (19) Z. Wang, Z. Zhong, X. Hao, S. Gerhold, B. Stoger, M. Schmid, J. Sanchez-Barriga, A. Varykhalov, C. Franchini, K. Held and U. Diebold, Proc. Natl. Acad. Sci. U.S.A. 111, 3933 (2014).
- (20) T.C. Rödel, C. Bareille, F. Fortuna, C. Baumier, F. Bertran, P. Le Fèvre, M. Gabay, O. Hijano Cubelos, M.J. Rozenberg, T. Maroutian, P. Lecoeur and A.F. Santander-Syro, Phys. Rev. Applied 1, 051002 (2014).
- (21) S. McKeown Walker, A. de la Torre, F. Y. Bruno, A. Tamai, T. K. Kim, M. Hoesch, M. Shi, M. S. Bahramy, P. D. C. King, and F. Baumberger, Phys. Rev. Lett. 113, 177601 (2014).
- (22) P.C.D. King, R.H. He, T. Eknapakul, P. Buaphet, S.-K. Mo, Y. Kaneko, S. Harashima, Y. Hikita, M.S. Bahramy, C. Bell, Z. Hussain, Y. Tokura, Z.-X. Shen, H.Y. Hwang, F. Baumberger and W. Meevasana, Phys. Rev. Lett. 108, 117602 (2012).
- (23) A.F. Santander-Syro, C. Bareille, F. Fortuna, O. Copie, M. Gabay, F. Bertran, A. Taleb-Ibrahimi, P. Le Fèvre, G. Herranz, N. Reyren, M. Bibes, A. Barthélémy, P. Lecoeur, J. Guevara and M.J. Rozenberg Phys. Rev. B 86, 121107(R) (2012).
- (24) C. Bareille, F. Fortuna, T.C. Rödel, F. Bertran, M. Gabay, O. Hijano Cubelos, A. Taleb-Ibrahimi, P. Le Fèvre, M. Bibes, A. Barthélémy, T. Maroutian, P. Lecoeur, M.J. Rozenberg and A.F. Santander-Syro, Sci. Rep. 4, 3586 (2014).
- (25) A.F. Santander-Syro, F. Fortuna, C. Bareille, T.C. Rödel, G. Landolt, N.C. Plumb, J.H. Dil and M. Radović, Nat. Mater. 13, 1085 (2014).
- (26) M.L. Knotek and P.J. Feibelman, Phys. Rev. Lett. 40, 964 (1978).
- (27) A.N. Shultz, W. Jang, W.M.III Hetherington, D.R. Baer, L.-Q. Wang and M.H. Engelhard Surf. Sci. 339, 114 (1995).
- (28) S.-I. Tanaka, K. Mase and S.I. Nagaoka Surf. Sci. 572, 43 (2004).
- (29) S. Moser, L. Moreschini, J. Jaćimović, O.S. Barišić, H. Berger, A. Magrez, Y.J. Chang, K.S. Kim, A. Bostwick, E. Rotenberg, L. Forró and M. Grioni, Phys. Rev. Lett. 110, 196403 (2013).
- (30) M. Setvin, C. Franchini, X. Hao, M. Schmid, A. Janotti, M. Kaltak, C. G. Van de Walle, G. Kresse, and U. Diebold, Phys. Rev. Lett. 113, 086402 (2014).
- (31) A. Thomas, W. Flavell, A. Kumarasinghe, A. Mallick, D. Tsoutsou, G. Smith, R. Stockbauer, S. Patel, M. Grätzel, and R. Hengerer, Phys. Rev. B 67, 035110 (2003).
- (32) A. Thomas, W. Flavell, A. Mallick, A. Kumarasinghe, D. Tsoutsou, N. Khan, C. Chatwin, S. Rayner, G. Smith, R. Stockbauer, S. Warren, T. Johal, S. Patel, D. Holland, A. Taleb, and F. Wiame, Phys. Rev. B 75, 035105 (2007).
- (33) H. O. Jeschke, J. Shen, and R. Valenti, New J. Phys. 17, 023034 (2015).
- (34) X. Hao, Z. Wang, M. Schmid, U. Diebold, and C. Franchini, Phys. Rev. B 91, 085204 (2015).
- (35) C. Di Valentin, G. Pacchioni and A. Selloni, J. Phys. Chem. C 113, 20543 (2009).
- (36) C. Sánchez-Sánchez, M.G. Garnier, P. Aebi, M. Blanco-Rey, P.L. de Andres, J.A. Martín-Gago and M.F. López, Surf. Sci. 608, 92 (2013).
- (37) M. Emori, M. Sugita, K. Ozawa and H. Sakama, Phys. Rev. B 85, 035129 (2012).
- (38) H.A. Huy, B. Aradi, T. Frauenheim and P. Deák, Phys. Rev. B 83, 155201 (2011).
- (39) H. Kamisaka, T. Hitosugi, T. Suenaga, T. Hasegawa and K. Yamashita, J. Chem. Phys. 131, 034702 (2009).
- (40) Y. Hirose, N. Yamada, S. Nakao, T. Hitosugi, T. Shimada and T. Hasegawa, Phys. Rev. B 79, 165108 (2009).
- (41) N. Hoa Hong, J. Sakai, N. Poirot and V. Brizé, Phys. Rev. B 73, 132404 (2006).
- (42) A.K. Rumaiz, B. Ali, A. Ceylan, M. Boggs, T. Beebe and S. Ismat Shah, Solid State Commun. 144, 334 (2007).
- (43) S. Dae Yoon, Y. Chen, A. Yang, T.L. Goodrich, X. Zuo, K. Ziemer, C. Vittoria and V.G. Harris, J. Magn. Magn. Mater. 309, 171 (2007).
- (44) F. Golmar, A.M. Mudarra Navarro, C.E. Rodriguez Torres, F.H. Sanchez, F.D. Saccone, P.C. dos Santos Claro, G.A. Benitez and P.L. Schilardi, App. Phys. Lett. 92, 262503 (2008).
- (45) J.M.D. Coey, P. Stamenov, R.D. Gunning, M. Venkatesan, and K. Paul, New J. Phys. 12, 053025 (2010).
- (46) J.M.D. Coey, J.M. Mlack, M. Venkatesan and P. Stamenov, IEEE Trans. Magn. 46, 2501 (2010).
- (47) R. Asahi, Y. Taga, W. Mannstadt, and A.-J. Freeman, Phys. Rev. B 61, 7459 (2000).
- (48) Y.J. Chang, A. Bostwick, Y.S. Kim, K.Horn, E. Rotenberg Phys. Rev. B 81, 235109 (2010).
- (49) R. Yukawa, S. Yamamoto, K. Ozawa, M. D’Angelo, M. Ogawa, M.G. Silly, F. Sirotti and I. Matsuda, Phys. Rev. B 87, 115314 (2013).
I SUPPLEMENTAL MATERIAL
I.1 Methods for sample preparation and measurements
The non-doped, polished crystals of TiO2, of typical sizes mm3, were supplied by SurfaceNet GmbH. The anatase crystals were natural grown and of orange color, with less than 5 ppm of Mn impurities. The orientation of the large surface of the crystals was either (natural cleaving plane) or for anatase, and ) for rutile. Clean and crystalline surfaces were obtained by cleaving the crystals in-situ, using the standard top-post procedure Santander-Syro2011 , at temperatures between 7 K and 25 K and pressure lower than Torr. To provide electrical grounding to the exposed surface, the crystals were glued with a conducting silver epoxy to the sample holder and, after gluing the top-post, wholly covered with graphite paint. The same protocol has been successfully used in previous ARPES studies of other oxides, such as SrTiO3 and KTaO3, that are transparent and highly insulating in the bulk Santander-Syro2011 ; Santander-Syro2012 . The sharp photoemission lines and dispersing bands in the ARPES measurements demonstrate a crystalline surface. For the different cleaved surfaces, the periodicity of the measured electronic structure, discussed later (figure 7), corresponds to that of an unreconstructed surface, and confirms the surface orientation.
The ARPES measurements were conducted at the Synchrotron Radiation Center (SRC, University of Wisconsin, Madison, USA) and the CASSIOPEE beamline of Synchrotron SOLEIL (Saint-Aubin, France) We used linearly polarized photons in the energy range eV and hemispherical electron analyzers with vertical slits. The total angle and energy resolutions were and 25 meV at SRC, and and 15 meV at Soleil. The mean diameter of the incident photon beam was smaller than 50 m at SOLEIL, and about 200 m at SRC. The photon flux at SOLEIL was photonssbw, and about 3 times smaller at SRC. Thus, the density of photons irradiating the sample was approximately times larger at SOLEIL than at SRC. The results were reproduced for at least three different samples for each surface orientation.
I.2 Rutile vs. anatase
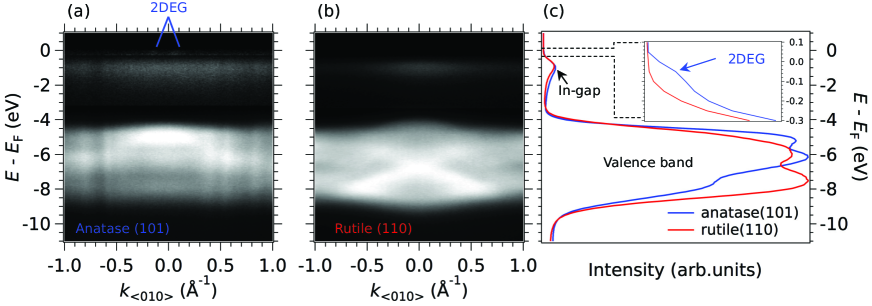
The different behavior of excess electrons induced by oxygen vacancies in rutile and anatase was already discussed in the main text. In contrast to anatase, the excess electrons in rutile do not fill up the conduction band (forming the 2DEG), but are localized at lattice Ti sites Setvin2014 . Accordingly, we did not detect any dispersing features at the Fermi level at the surface of rutile , neither for cleaved nor for in situ prepared surfaces under various measurement conditions (photon energy, emission angle, light polarization) at K. To illustrate the difference between the two systems, figure 4(a,b) shows the valence band, the in-gap state corresponding to the localized electrons, and in the case of anatase the 2DEG measured at normal emission at eV. The angle-integrated data in figure 4(c) demonstrates that the concentration of oxygen vacancies is similar in the two cases, as the in-gap states have similar intensities. The failure to observe dispersing features at the Fermi level of rutile shows that oxygen vacancies at the surface are not sufficient to create a 2DEG, and that structural factors play a crucial role regarding the localization/delocalization of excess electrons.
I.3 Surface vs. bulk-like electronic structure of anatase
Moser et al. Moser2013 characterized the polaronic conduction for different charge carrier densities (controlled by the oxygen partial pressure sample chamber) at the anatase TiO2(001) surface using ARPES. In the present work, we only show data after reaching the saturation value of the charge carrier density. Intermediate values of the charge carrier density can be observed but are not stable long enough to measure with a sufficient signal-to-noise ratio without controlling the oxygen partial pressure in the measurement chamber. Contrary to our results, Moser et al. observed only one dispersing subband of 3D character (i.e., dispersing along the direction perpendicular to the surface) at low charge carrier densities. Note that for a low concentration of oxygen vacancies and charge carriers, the potential well at the surface is rather shallow and the electrons are thus barely confined. But, even for charge carrier densities comparable to our results ( to ) Moser et al. observed only one dispersing band. Such discrepancy in the number of bands and dimensionality occurred already in the case of the electronic structure at the surface of SrTiO3: Chang et al. Chang2010 , using the same ARPES setup as Moser et al., measured only one dispersing band of character and attributed it to the bulk, whereas two bands and 2D behavior were observed in other works Santander-Syro2011 ; Meevasana2011 ; Plumb2013 . Both studies observing only one band were conducted at the same synchrotron endstation at the Advanced Light Source. Thus, the discrepancy in the number of bands might be related to the specifics of the ARPES endstation. Possible reasons are a lower photon flux or different photoemission selection rules due to different measurement geometries. For instance, for SrTiO3, we checked (not shown) that using horizontal slits instead of vertical slits for the electron analyzer yields only one of the two subbands.
I.4 Spatial extent of the 2DEG at the surface of anatase
An estimate of the spatial extent of the 2DEGs in anatase using the triangular potential well model used previously Santander-Syro2011 can be obtained, subject to one caveat. If the subband splitting is due to the quantum confinement, the width of the potential well follows directly from this splitting and the effective mass of the subbands along the confinement direction Santander-Syro2011 . For anatase, Kamisaka2009 , yielding a confinement length of nm for the 2DEG at the anatase surface. If, on the other hand, the subband splitting is due to magnetism Santander-Syro2014 , one can assume that the next quantum-well states of character lie just above , which gives an upper bound of nm for the width of the potential well at the surface. One sees that, in any case, the confinement length of the 2DEGs at the surface of anatase is similar to the ones at the surfaces of SrTiO3 and KTaO3, of about nm.
I.5 Influence of UV synchrotron irradiation
We present now supplementary data regarding the influence of the UV synchrotron irradiation on the stoichiometry and electronic structure at the surfaces of anatase.
We conducted our measurements at two different synchrotrons: SRC ( generation) and Soleil ( generation). The normal measurement conditions (photon flux density at the surface of the sample, vacuum pressure, temperature) at SRC enable to reduce the surface, create the 2DEG, and study a stable 2DEG for days. In contrast, the much higher photon flux density at Soleil creates so many oxygen vacancies that the induced disorder at the surface lead to the disappearance of the 2DEG within about one hour at K at the anatase surface. As this effect was never observed for the 2DEG at the surface of SrTiO3 and KTaO3, we conclude that the anatase surfaces are much more sensible to the UV irradiation.
The effects of the synchrotron UV light on the surface are shown in figure 5. An approximate upper limit for the effects is shown in Fig. 5(a), where we present the angle-integrated spectra measured at eV on a fractured anatase sample for binding energies between eV and eV. The red curve corresponds to a weakly reduced surface, similar to the data in figure 1 in the main text, and the blue curve to the electronic structure of the surface after exposing the sample to high intensity zero-order irradiation of the synchrotron. As can be seen from figure 5, there are several changes in the electronic structure induced by the severe exposure to UV light. First, the shoulder of the Ti- peak, corresponding to Ti3+ states, transforms to become the the main Ti- peak at even lower binding energies, indicating that the majority of Ti atoms close to the surface have a low valency due to the creation of many oxygen vacancies. Second, the shape of the valence band becomes featureless and its dispersion disappears after a high UV dose, demonstrating the large disorder induced at the surface. Third, a high concentration of oxygen vacancies is obvious from the increased intensity of the in-gap peak and the decreased intensity of the peaks related to oxygen (O- and valence band). These measurements clearly demonstrate that the surface structure can be altered drastically, to the point of completely destroying the crystalline order, due to light irradiation.
Figures 5(b, c) show the angle-resolved measurements corresponding to the spectra in figure 5(a), zooming over the valence-band region. The clear dispersion of the valence band in the weakly reduced surface, Fig. 5(b), is a direct consequence of the good surface crystallinity (Bloch theorem). After intense UV irradiation, Fig. 5(c), the surface crystallinity is destroyed, and the valence-band becomes non-dispersive and featureless.
Even without the zero-order irradiation, the reduction of the surface can lead to the disappearance of the 2DEG. The angle-integrated spectra in figure 5(b) were measured at eV and show the tail of the in-gap peak and the intensity at the Fermi level for binding energies between eV and eV. After several hours of irradiation (blue curve), the intensity of the in gap state increases and the intensity at the Fermi level corresponding to the 2DEG decreases. The state of the weakly irradiated surface (red curve) can be retrieved by slightly changing the position of the UV light spot on the sample surface (black curve). As the size of the beam spot is only , the strong reduction of the surface is local. This results suggests that UV light can be used to tailor locally the surface order/disorder in anatase, and thus write mesoscopic or nanoscopic patches of metallic 2DEG intercalated with patches of disordered insulating material.
The energy momentum maps corresponding to the angle-integrated spectra of figure 5(b) were already shown and discussed in figure 3 of the main text. We display them again, for completeness, in figures 5(c,d,e). The 2DEG is clearly visible in figure 5(c), whereas there is almost no intensity at the Fermi level in figure 5(d) at the strongly reduced surface, and the 2DEG is recovered in figure 5(e), after moving the UV spot to a neighboring region in the sample.
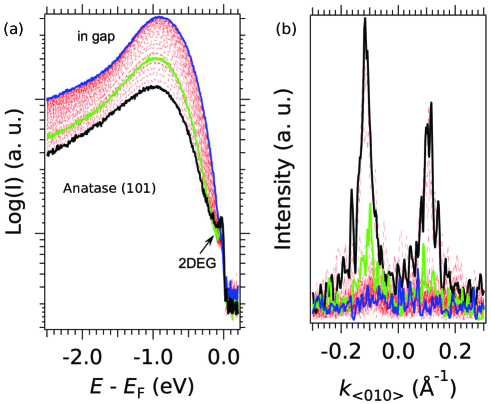
Another interesting fact is that the anatase surface degrades more rapidly than the surface. The data corresponding to this degradation are shown in figure 6. The angle-integrated spectra (red curves) in Fig. 6(a) were measured at equal time intervals (of approximately 2.5 minutes) at a photon energy eV, and show the increase of the intensity of the in-gap peak and decrease in the intensity at the Fermi level for binding energies between eV and eV. Three of the curves highlighted in black, green and blue correspond to the start, a midpoint and the end of these measurements. The intensity of the 2DEG is evident in the momentum distribution curves at the Fermi level in figure 6(b). At the beginning (black curve) two peaks, corresponding to the dispersing bands shown in figure 2(h) of the main text, are visible. Their intensity decays rapidly after several minutes, is barely visible (green curve) and disappears completely (blue curve). Note that the Fermi momenta in the MDCs does not increase –compare black and green curve in Fig. 6(b), although more oxygen vacancies are created as evidenced by the increase in intensity of the in-gap state in Fig. 6(a). As the electron density in the conduction band is proportional to the Fermi momenta , the excess electrons due to oxygen vacancies seem to populate the in-gap state (localized electrons) and not any longer the conduction band (delocalized electrons). This observation is in agreement with the observed saturation of the band bending in the main text.
A high concentration of oxygen vacancies induced by the synchrotron irradiation creates a high degree of disorder at the surface. If the degree of disorder at the surface is sufficiently high, no dispersing bands exist as there is no longer the periodicity of the lattice, and the 2DEG disappears, as effectively seen in Fig. 6(b).
I.6 Raw data and periodicity of the electronic structure
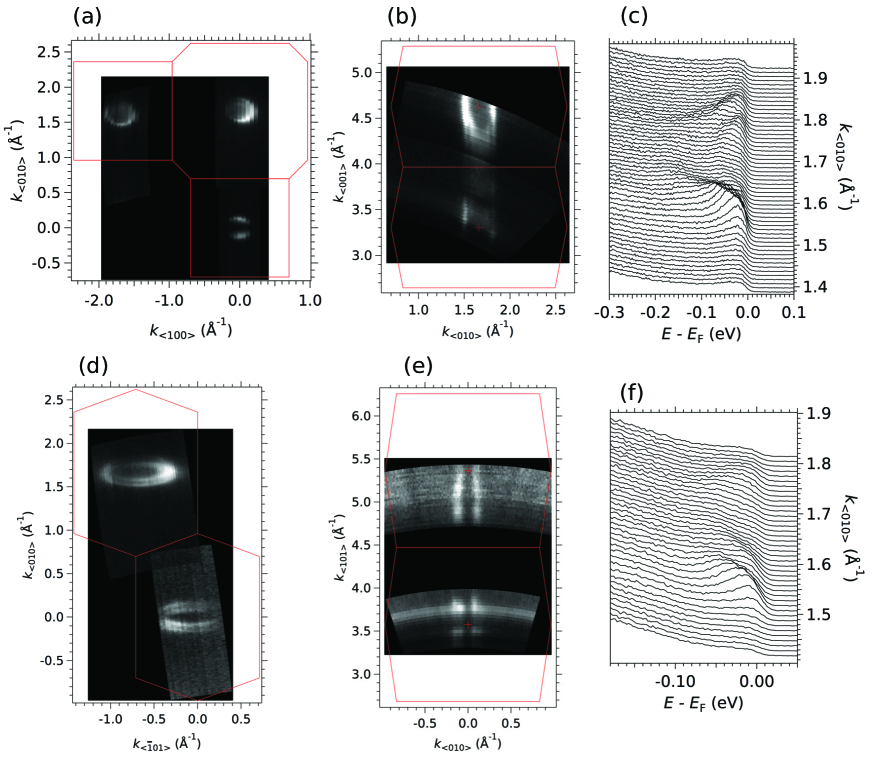
Figure 7 shows the raw Fermi surface maps and energy distribution curves (EDCs) of the data presented in Fig. 2 of the main text. Comparing the raw maps of Figs. 7(a, b, d, f) with the second-derivative maps of Figs. 2(b, c, f, g) in the main text, it is evident that the second derivative in the Fermi surface maps only enhances the peak-to-background ratio, and does not create artifacts in the intensity distribution.
Additionally, the Fermi surface maps in figures 7(a, d), which span a portion of in-plane momentum space larger than in Fig. 2 of the main text, show that the periodicity of the electronic structure at the cleaved and surfaces, respectively, corresponds to the one expected at unreconstructed surfaces.
Note that the Fermi surface map of Figure 7(b), and the corresponding dispersions at eV ( Å-1) shown in Fig. 3 of the main text, were not obtained at normal emission, but in the second Brillouin zone. Thus, the mere geometry of measurements imposes already extrinsic intensity asymmetries between the the left and right branches of the 2DEG electron bands.
I.7 Polarization dependence
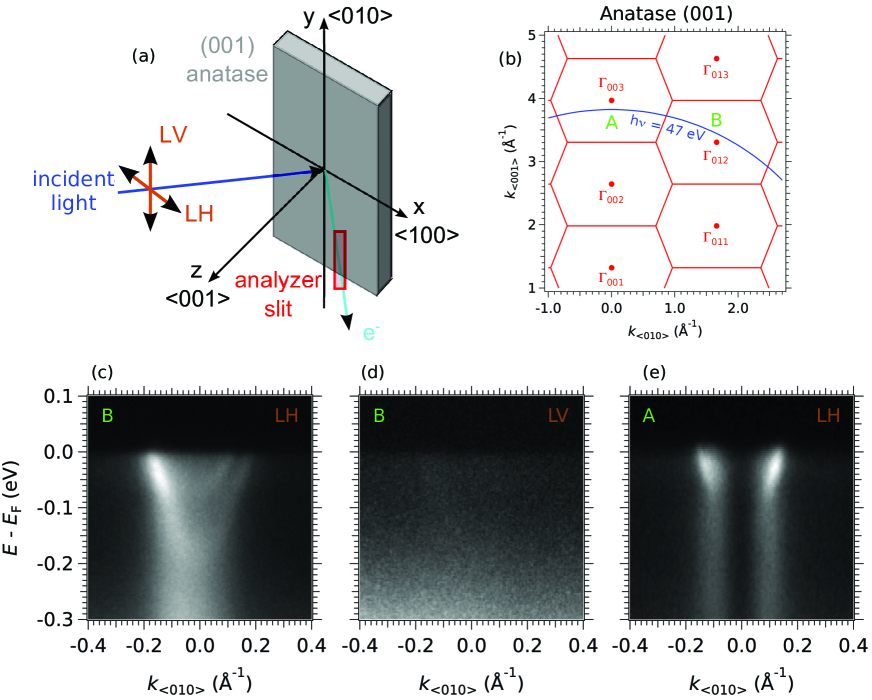
The polarization dependence of the orbitals (,,) forming the 2DEG at the surface of SrTiO3 was discussed in previous works Santander-Syro2011 ; Yukawa2013 and can be directly applied to the surface of anatase. To understand the photoemission selection rules, the geometry of the experimental setup is essential and shown in Fig. 8(a). We used light polarized horizontally (LH, in the plane) and vertically (LV, along the -direction). The slits of the analyzer are aligned vertically along the -direction and the sample was rotated around the axis. In this geometry, the measurement plane containing the electrons ejected from the surface and entering the detector through the vertical slits, coincides with the plane.
The measurements were conducted at a photon energy of eV both at normal emission and tilted by around the -axis. The corresponding positions in reciprocal space of bulk anatase, labelled A and B, are shown in figure 8(b).
To measure a non-zero intensity, the final state needs to be even with respect to the measurement plane. As LV polarisation is even with respect to this plane, only states with an orbital character even to the plane, hence states, can be detected using LV. The LH polarisation has even as well as odd components with respect to the plane, and states of all orbitals have non-zero matrix elements using this polarisation.
The ARPES spectra in figures 8(c, d) show the measured intensities at the point B in reciprocal space for LH and LV polarizations, respectively. The almost zero intensity in LV polarisation demonstrates that the orbital character is not . To exclude one more orbital character we turn to the measured intensities at normal emission (point A) in Fig. 8(e). To have a non-zero matrix element at the point in normal emission, the final state has to be even with respect to both the and planes. Hence, as the LH polarization is even with respect to the plane, only states with an orbital character even to the plane () can be detected. The measured intensity at and close to normal emission in figure 8(e), i.e. around , is zero and thus, the bands are not of character.
Consequently, the orbital character of the bands is , in agreement with the circular Fermi surfaces in figure 2(b) of the main text and the non-degeneracy of the orbitals in the bulk of anatase. We verified the matrix elements at a different photon energy to affirm that the matrix elements are due to orbital character and not photon energy.