An Electron-Tracking Compton Telescope
for a Survey of the Deep Universe by MeV gamma-rays
Abstract
Photon imaging for MeV gammas has serious difficulties due to huge backgrounds and unclearness in images, which are originated from incompleteness in determining the physical parameters of Compton scattering in detection, e.g., lack of the directional information of the recoil electrons. The recent major mission/instrument in the MeV band, Compton Gamma Ray Observatory/COMPTEL, which was Compton Camera (CC), detected mere persistent sources. It is in stark contrast with 2000 sources in the GeV band. Here we report the performance of an Electron-Tracking Compton Camera (ETCC), and prove that it has a good potential to break through this stagnation in MeV gamma-ray astronomy. The ETCC provides all the parameters of Compton-scattering by measuring 3D recoil electron tracks; then the Scatter Plane Deviation (SPD) lost in CCs is recovered. The energy loss rate (dE/dx), which CCs cannot measure, is also obtained, and is found to be indeed helpful to reduce the background under conditions similar to space. Accordingly the significance in gamma detection is improved severalfold. On the other hand, SPD is essential to determine the point-spread function (PSF) quantitatively. The SPD resolution is improved close to the theoretical limit for multiple scattering of recoil electrons. With such a well-determined PSF, we demonstrate for the first time that it is possible to provide reliable sensitivity in Compton imaging without utilizing an optimization algorithm. As such, this study highlights the fundamental weak-points of CCs. In contrast we demonstrate the possibility of ETCC reaching the sensitivity below erg cm-2 s-1 at 1 MeV.
Subject headings:
gamma rays: general – nuclear reactions, nucleosynthesis, abundances – supernovae: general – instrumentation: detectors – techniques: imaging spectroscopy1. Introduction
MeV gamma-ray astronomy provides the unique opportunity to study supernovae (SNe), as fresh radio isotopes in SNe emit MeV gamma-rays (Matz et al.,, 1988; Chevalier,, 1992; Iyudin et al.,, 1994; Maeda et al.,, 2012; Churazov et al.,, 2014). Studies of active galactic nuclei and galaxies reveal the evolution of the early universe (Zhang & Beacom,, 2004; Inoue et al.,, 2013). Also, gamma-ray bursts are a promising probe to catch the first star (Mészáros & Rees,, 2010; Nakauchi ei al.,, 2012). Especially, SNe are the most fascinating objects and are vigorously studied in all the fields of astronomy. Nevertheless, there still remain the many fundamental mysteries, such as, the origin of SNe type-Ia and nucleosynthesis. Although the thermonuclear explosion of a Single degenerate White Dwarf (SWD) has been believed to be the origin of SNe Ia and accordingly has been used as a distance standard in cosmology, a merger of two WDs (DWD) has been frequently pointed out the more plausible origin (Hillebrandt & Niemeyer,, 2000). Recently, the importance of the observations in MeV gammas to conclusively determine the origin was remarked (Summa et al.,, 2013), considering that MeV gammas are the unique probe that are directly emitted from the exploding or merging regions. They pointed out that a delayed peaking time (80 days, compared to 50 days for SWDs) appears in DWDs due to its higher total mass, in contrast to the predicted model-independent peak time of 20 days from optical observations. Most of those sources are expected to be faint, because the number of the detected gammas is proportional to the cubic of the distance to the source. Each detection will contain a substantial amount of uncertainties, such as, fluctuations of 56Ni production(20%) and viewing angles (Maeda,, 2014). We then estimate that detection of 100 SNe, each of which should have 5 significance in 10 days of observation, is required to obtain the statistically robust confirmation of these features. Given the optical results of 15 and 50/year SNe Ia and collapsars (SNe Ib, c, and II), respectively, within 60 Mpc (Maoz & Mannucci,, 2012; Maeda,, 2014), an MeV instrument with a sensitivity of 10-12 erg cm-2 s-1 for 106 s is needed to catch gammas of these SNe with the above-mentioned significance. Thus, to push such a new field in MeV-gamma astronomy, an instrument with a high sensitivity of 1 mCrab ( erg cm-2 s-1 at 1 MeV in 106 s) is desired.
Historically, COMPTEL operated with only 1/3 of the sensitivity expected from the calibration test before launch, and it may give a concern in estimating the true sensitivity in orbit. The primary two causes of this discrepancy in COMPTEL are now understood as huge backgrounds in space and unclearness in the Compton images (Schönfelder et al.,, 2000; Schönfelder,, 2004).
After the close of the COMPTEL observations, it was pointed out that the additional parameters, including time of flight, kinematical tests, and Scatter Plane Deviation (SPD) from the direction of the recoil electrons, would be necessary to reduce the background for the next-generation Compton cameras (CCs) (Schönfelder,, 2004). It is well known that in COMPTEL the time of flight between the forward and backward detectors dramatically reduced the background and was a primary factor for the success of COMPTEL. Ideally, the point spread function (PSF) of CCs must be evaluated, based on the two parameters of Angular Resolution Measure (ARM) and SPD, as shown in Fig. 1. However, SPD is lost in CCs, due to lack of direction information of the recoil electrons, thus the PSF shape is inevitably assumed to be rather spread (see Section 6). The recovery of the SPD by measuring recoil-electron tracking is then expected to both (1) improve the measured PSF by up to several degrees and (2) reduce a substantial amount of contamination of the background leaked to the source region from the outside. In addition, the additional parameters of in recoil-electron tracking are independent of the reconstruction of Compton events, and therefore, use of them would suppress the background dramatically without losing Compton events.
In contrast, CCs with no additional parameter may lose a significant amount of Compton events in intense backgrounds, because the application of cuts on physical parameters, such as, energy deposits or hit positions, produces a massive uncertainty for the sensitivity. Nevertheless, the recent trend in developing advanced CCs concentrates on pursuing a larger effective area and a better energy resolution to improve the ARM resolution. In fact, Aprile et al., (2004) reported no detection of Crab in a balloon experiment with the liquid Xe CCs that has the largest effective area of 20 cm2 (Aprile et al.,, 2004). The NCT balloon experiment with the Ge-based CC and BGO shield detected Crab with 4 (Bandstra et al.,, 2011), although the reported number of signals from the Crab region was 1/6 of simulation over a large background. Recent satellite proposals in MeV astronomy, in which the proposed sensitivities are larger than several mCrab, mention little on both of these problems (Boggs,, 2006; Greiner et al.,, 2009; Nakazawa et al.,, 2012; von Ballmoos et al.,, 2012). As such , it seems to be difficult for even advanced CCs to reach the desirable sensitivity in space.
| TPC Size | Gas Parameters | Drift Velocity | Diffusion (m/) | Anode-cathode | PSAs | |
|---|---|---|---|---|---|---|
| (cm3) | Mixture, Pressure, Drift Field | (cm s-1) | Transverse/Longitudinal | Coincidence | ||
| SMILE-I type prototype | 10108 | Ar 90%/C2H6 10%, | 4.0 | 470/230 | online | GSO |
| 1 atm, 400 V cm-1 | 10 ns gate | 1 R.L. | ||||
| SMILE-I Flight Model | 101015 | Xe 54%/Ar 40%/C2H6 6%, | 2.4 | 500/290 | online | GSO |
| 1 atm, 380 V cm-1 | 10 ns gate | 1 R.L. | ||||
| SMILE-II small prototype | 7.57.515 | Ar 90%/C2H6 10%, | 3.6 | 470/300 | offline | GSO |
| 1 atm, 170 V cm-1 | adequate gate | 1 R.L. | ||||
| SMILE-II Flight Model | 303030 | Ar 95%/CF4 3%/iso-C4H10 2%, | 6.5 | 300/300 | offline | GSO |
| 1 atm, 160 V cm-1 | adequate gate | 1 R.L. | ||||
| SMILE-II (PSAs improved) | 303030 | Ar 95%/CF4 3%/iso-C4H10 2%, | 6.5 | 300/300 | offline | GSO |
| 1 atm, 160 V cm-1 | adequate gate | 3 R.L. | ||||
| SMILE-III | 303030 | CF4 100%, | 5 | 100/100 | offline | GSO |
| 1 atm, 160 V cm-1 | adequate gate | 3 R.L. | ||||
| Satellite-ETCC (1 module) | 505050 | CF4 100%, | 5 | 100/100 | offline | LaBr3 |
| 1 atm, 160 V cm-1 | adequate gate | 10 R.L. |
To achieve the desired high sensitivity, combination of the sharp PSF and the reduction of the background with the SPD and additional parameters from recoil-electron tracking is a promising approach, given a MeV instrument with the effective area of several tens of cm2 will reach a sensitivity of 1 mCrab if perfect background rejection is applied. Only a few studies on CCs with recoil electron tracking have been reported so far (Kanbach et al.,, 2006; Vetter et al.,, 2011). Among them , SMILE-I (“Sub-MeV gamma ray Imaging Loaded-on-balloon Experiment”: first Electron-Tracking Compton Camera; ETCC) showed the possibility to remove most of the background without an active shield by recoil electron tracking in a gaseous time projection chamber (TPC) (Takada et al., 2011a, ).
Here we present the performance of an improved 30 cm-cubic ETCC for our second balloon experiment (SMILE-II). We have successfully made robust reduction of background and obtained clear images by 3D electron tracking. In Section 2, the concept and structure of the ETCC are concisely explained. Then its fundamental performance is presented in Section 3. The durability of the ETCC with excellent ability of reducing background under intense radiation condition is mentioned in Section 4. In Section 5, an improvement of imaging, thanks to the use of SPD, is described in detail, and the definition of the PSF of the ETCC to reach the ultimate sensitivity of the CC is thoroughly discussed in Section 6. Finally, we summarize the characteristics of the ETCC briefly and consider the prospects for the future MeV gamma-ray astronomy with the use of advanced ETCC.
2. Electron-Tracking Compton Camera
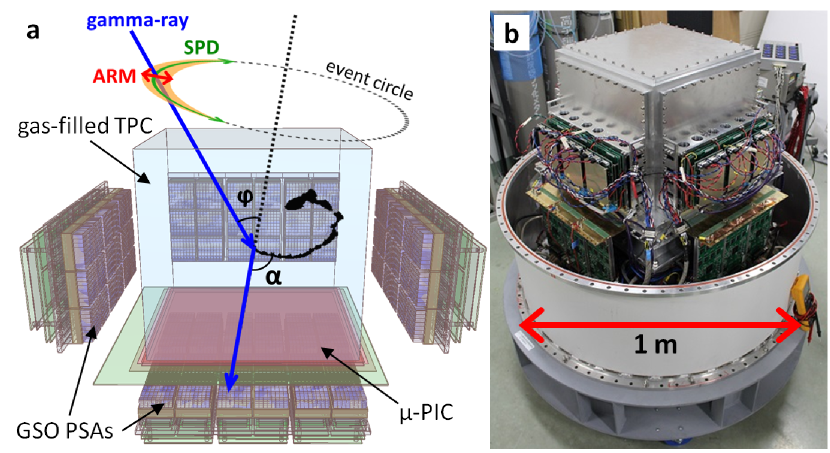
An ETCC consists of a TPC based on a micro pattern gas detector (MPGD) with 400 m pitch pixels for 3D tracking of recoil electrons and Gd2SiO5:Ce (GSO) pixel scintillator arrays (PSAs) to measure scattered gamma rays (Tanimori et al.,, 2004). With an ideal effective area of 100 cm2 at 1 MeV for a 50 cm-cubic 3 atm CF4 gas, such a TPC would be a good device for a CC with electron-tracking. CF4 gas is an ideal gas for ETCC, with significant benefits, including a large cross section for Compton scattering, small photo-absorption cross section, and small diffusion constant (see Section 6 for detail). Several time-projection chambers have already been operated with pure CF4 in accelerators and underground experiments (Thun,, 1988; Isobe et al.,, 2003; Miuchi et al.,, 2010). However, we need more study to use the CF4-dominant gas in the MPGD-based TPC, due to the requirement of a higher-voltage electric field on the MPGD. In particular, good reliability for the stable operation of the TPC is crucial in the balloon experiments, and hence we at present use Ar-based gases with some additional quencher gases to study the effectiveness of electron tracking. Table 1 summarizes the detailed components of the Ar-based gases used in our experiments.
3D tracking of the recoil electron provides the incident gamma-ray direction as an arc by adding SPD to ARM (the additional angle of in Fig. 1a), and the energy-loss rate () of the track, all of which are effective tools to reduce backgrounds by directional cut, kinematical tests and particle identification, respectively. Note we have already examined the concept of ETCC (Orito et al.,, 2004; Tanimori et al.,, 2004; Takada et al.,, 2005), including an ARM resolution of 4∘ (FWHM) at 662 keV with LaBr3 PSAs for medical imaging (Kabuki et al.,, 2010; Kurosawa et al.,, 2010).
The readout method of the TPC is a key technology of this balloon experiment, as described in Tanimori et al., (2004) and Takada et al., 2011a . Only one or a few tracks, including background for Compton events, is found to appear in the TPC. Given that, conventional orthogonal strip electrodes, instead of pixel electrodes, as used in typical TPCs, could be used to reconstruct the 3D tracks by slicing along the direction of the electron drift using fast timing, and by combing the anode and cathode hits that have the same times (Tanimori et al.,, 2004). Then, we could reduce the number of readout electrodes of the TPC by an order of two for this 30 cm-cubic ETCC, which is an allowable level using recent ASIC and FPGA, while satisfying the severe constraint of balloon experiments for power consumption, space and cost. However, such a drastic reduction of the number of signals would also introduce a risk of increasing the ambiguity of electron tracking, as mentioned later.
For MeV astronomy, SMILE-I with a 10 cm-cubic ETCC was performed in 2006. We selected 400 downward gamma-rays from 2.3105 triggered events, using the kinematical test and (Takada et al., 2011a, ), where a kinematical test was made with comparison of the measured angle to the calculated one, as mentioned in Section 2 of Takada et al., 2011a . Although both the resolution for and the detection efficiency were inefficient, due to a low tracking efficiency of 10%, in which at least 5 hit points on each track were required, the combination of the cut and kinematical test was found to be useful for the reduction of neutrons and cosmic rays. This inefficiency was not due to the low gain of the MPGD but to a bug in the algorithms set in the FPGA used in the readout electronics (see the next section for detail). The obtained diffuse atmospheric and cosmic fluxes were consistent with past observations. In addition, it is noted that its cubic structure provides a large field of view (FOV) of 2 str.
3. Basic Performance of the SMILE-II ETCC
We have been attempting to establish a high sensitivity for the ETCC, using a 30 cm-cubic ETCC (Fig. 1b) with a balloon experiment for the detection of the Crab (SMILE-II) (Takada et al., 2011b, ). To detect Crab with a reliable 5 significance in an exposure of several hours, an effective area of 0.5 cm2 at 300 keV and an ARM resolution of 10∘ (FWHM) at 662 keV are required (Tanimori et al.,, 2012; Sawano et al.,, 2014).
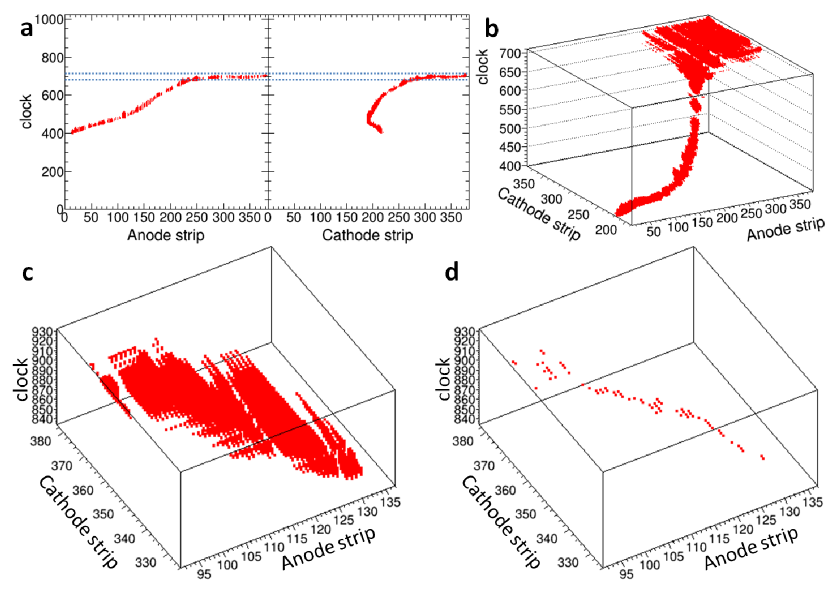
The improvement of the reconstruction of tracks in the TPC was an essential factor for SMILE-II. For SMILE-I, only addresses of the anode and cathode strips hitting simultaneously within a 10 ns gate were encoded. However, a 10 ns gate is too short to get all hit strips, due to the delay in the encoding circuit. This was the reason for the small effective area of SMILE-I. To recover all hit points in SMILE-II, all addresses of the hit strips on anode and cathode with their hit timings are recorded without requiring the coincidence of 10 ns, and an adequate gate is applied in the analysis (Tanimori et al.,, 2012). In addition, a pulse height of each strip was recorded as a timing width over the threshold (TOT). Fig. 1a shows a typical reconstructed track of a recoil electron for the TPC of SMILE-II, using an improved reconstruction method, where the vertical width of the hit point represents the TOT as a pulse width of each pixel. To measure the precise energy deposit in the TPC, a sum of 64 strips of both cathodes and anodes are fed to Flash ADC (25 MHz), and its wave form was recorded in 10 s. Also, two neighboring strips of both anodes and cathodes were combined to increase the pulse height. Then the track reconstruction efficiency was dramatically improved from 10% to 100%, which provides a much better resolution for , as demonstrated in Fig. 2a (Mizumura et al.,, 2014), compared to that of SMILE-I (Fig. 7 in Takada et al., 2011a ). The detail of the performance of this TPC is described in Matsuoka et al., (2015).
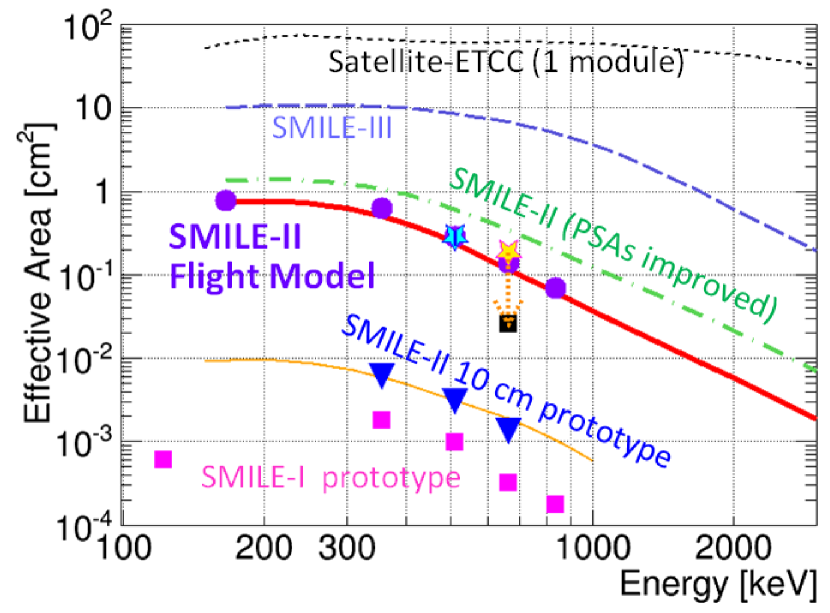
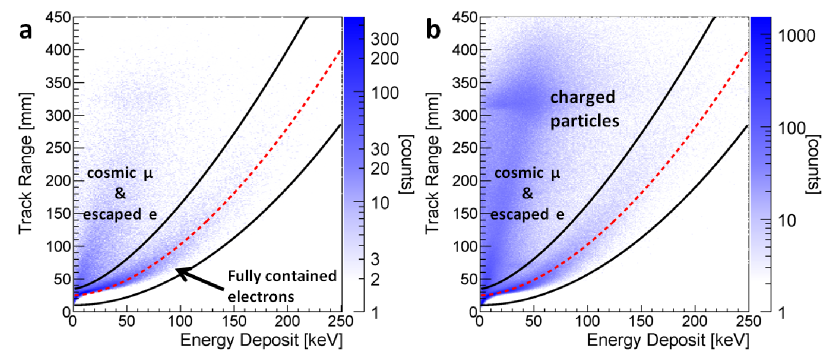
Figure 2a shows the track range and its energy deposit for 662 keV gammas from 137Cs source set at a distance of 1 m from the ETCC, in which is a gradient of the distribution. The measured in this figure clearly distinguishes the Compton electrons fully contained in the TPC from the backgrounds, and resultantly enables us to remove most of the backgrounds without loss of Compton events by applying cuts. The red-dashed line in this figure is the empirical formula of , which is approximately proportional to E1.72 (Sauli,, 1977), for recoil electrons fully contained in the TPC. The region within E1.72±0.22 contains 95% of Compton events inside ( cut), as supported by the simulation result. In this article, all simulations were done using GEANT4 (Agostinelli et al.,, 2003). The simulation also shows the distribution of higher energy particles, such as, electrons escaping from the TPC and minimum ionizing particles (cosmic muons) on the upper boundary, as actually seen in Fig. 2a. In addition, the scattering point of the track is required to be within 1 mm inside the drift region of the TPC in order to remove events originated from gammas that scattered from the wall of the drift cage of the TPC (fiducial cut), with which 10% of the events passing the cut were removed. Thus, by applying only two simple cuts, almost all of the fully contained Compton events are obtained, after several kinds of backgrounds are filtered out. For the obtained fully contained Compton events, effective areas were measured at several energy points, using RI sources of 139Ce, 133Ba, 22Na, 137Cs and 54Mn, along with the simulation results for several types of ETCCs, where the effective area was obtained from the number of detected gammas within twice the FWHM of the energy resolution centered at the gamma energy in the background-subtracted energy spectrum. The simulation results were obtained mainly from the production of two probabilities: that of Compton scattering and its recoil electron contained fully in the TPC, and that of the full absorption of scattered gammas in the PSAs, where the absorption of the materials of the TPC and the supporting frames are taken into account.
Figure 3 shows good consistency between the measured efficiencies for the ETCCs listed in Tab. 1 (shown as points) and their simulation results (shown as lines). Here the 10 cm-cubic SMILE-II ETCC prototype (blue inverted-triangle points and yellow line), 30 cm-cubic SMILE-II flight model ETCC (purple circles and red line), improved flight model with 3 radiation length (R.L.) GSO PSAs covering the bottom half of the TPC (green dotted-dashed line), and SMILE-III ETCC (blue dashed line; described in the later section) are given. In addition, a 50 cm-cubic ETCC with CF4 gas at 3 atm and 10 R.L. PSAs (4% at 662 keV: FWHM) is plotted (black dotted line), in which the PSAs are set within the pressure vessel to catch high-energy electrons escaping the gas volume of the TPC. A large FOV of 2 str similar to SMILE-I was confirmed for the 30 cm-cubic ETCC (Matsuoka et al.,, 2015). Thus, we are able to estimate precisely the effective area for the extensions of the volume, gas type and pressures of the TPC, or the R.L., and the better energy resolution of PSAs. These simple extensions ensure an effective area of 11 cm2 at 300 keV for a following balloon experiment with a long duration flight (SMILE-III) and that of 60 cm2 with 2∘ (ARM, FWHM) at 1 MeV for a 50 cm-cubic ETCC with CF4 gas at 3 atm and 10 R.L. PSAs, e.g., LaBr3. Furthermore, a satellite-ETCC consisting of four 50 cm-cubic ETCCs for a middle-class satellite would reach 240 cm2 (460 cm2) with an ARM resolution of 2∘ at 1 MeV.
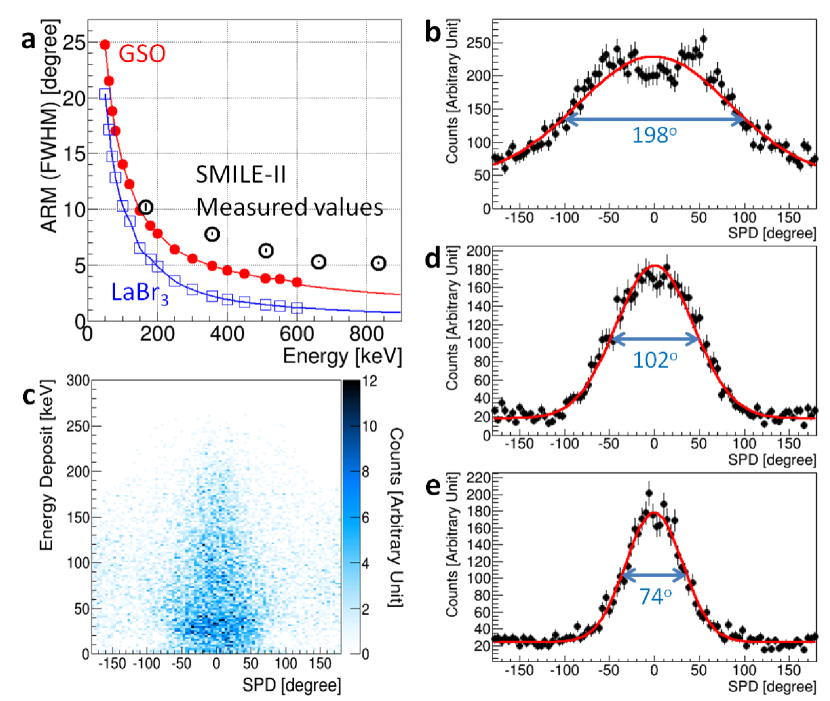
The ARM resolutions were obtained at the same energy points (Fig. 4a) with those calculated, based on the detector energy resolution. The measured ARMs were close to the theoretical limit of the resolution expected for the detector energy resolutions. Fig. 4 also gives the ARM resolutions for future ETCCs with scintillators with better energy resolution. The discrepancies between the measured and calculated ARM resolutions are considered to arise from the 8 mm uncertainty in the track for the scattering point of the gamma, due to the worsened 3D reconstruction of the recoil electron, as mentioned below.
Finally, an SPD can be determined for all the events, and we obtained a resolution of SPD of 200∘ (FWHM) (Fig. 4b), which is about two times worse than the expected SPD resolution, due to multiple scattering in Ar gas. The SPD is determined with a linear fitting of the entire track. Even a SPD with such a poor resolution is useful to improve the image quality (see Section 5 for detail). The deterioration of the SPD resolution is mainly due to the well-known ambiguity from multi-hits on the orthogonal 2D strip readout in the TPC. Usually, -hits on anode and cathode strips in the same timing generate hit points (Figs. 5a and b), and thus a part of the track running horizontally to the -PIC is obtained as a square instead of a line. In this analysis, a timing resolution of near 10 ns from the clock of the FPGA (100 MHz) was used. To address this issue, improvement of the ETCC is being carried out (Sections 5 and 6).
4. Performance under Intense Radiation Background
In order to investigate quantitatively the performance of the ETCC under intense radiation conditions similar to those found in space, we performed a test using a 140 MeV proton beam incident on a water target to produce a diffuse background of fast neutrons and MeV gamma-rays. The 30 cm-cubic ETCC was placed at a distance of 1.3 m from the target, and direct gammas from the water target were shielded with lead blocks, allowing us to uniformly irradiate the ETCC (Matsuoka et al.,, 2015). The neutron-gamma ratio and overall intensity can be adjusted by altering the beam intensity and size of the water target. Details of the radiation condition created by a proton beam on a water target and its simulation will be discussed elsewhere. For the present measurement, the ratio of neutrons to gamma was estimated to be 1:1 with both the simulation and the observed spectra of a neutron monitor located near the water target. This is similar to the composition of the radiation field observed with SMILE-I at the balloon altitude at the middle latitude of the northern hemisphere (Takada et al., 2011a, ).
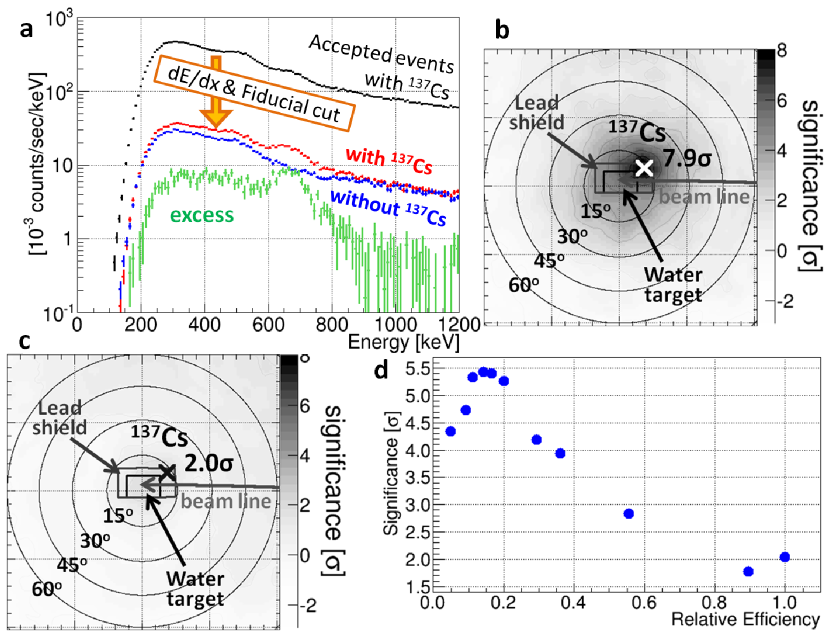
During the 5 day test, the ETCC was operated stably at the counting rates up to 1 kHz, or more than 5 times higher than that expected under balloon conditions (Matsuoka et al.,, 2015). Figure 2b shows the distribution of the measured (similar to Fig. 2a), where the recoil protons due to scattering of fast neutrons are located at the far right of the plot. Here, the Compton electrons are clearly separated from the intense backgrounds, allowing us to reduce the background contribution by one order of magnitude (see the energy spectra in Fig. 6a), using and fiducial cuts. In this way, we successfully obtained a clear image of a 137Cs source (662 keV gammas) set at a distance of 1 m from the ETCC (Fig. 6b). The image of the source appears at the expected position with a significance of 7.9 (SPD resolution of 200∘), after gammas with energies in the range 66266 keV are selected, where the significance was estimated by comparing the spectrum of the 137Cs source with the ring-shaped background region between 60∘ and 90∘ from the center of the FOV (i.e. the center of the target). It is also noted that the detection efficiency was consistent with that measured in the laboratory using the same cuts, as in Fig. 3.
For comparison, we performed the image reconstruction using a conventional Compton imaging technique, including no information about the electron track (Fig. 6c). In this case, only a small enhancement of 2.0 was obtained for the source signal. The significance could be increased to 5.4 by applying a tight cut on the electron energy measured in the TPC (Fig. 6d). However, such a tight cut would also remove about 85% of Compton events, as compared to our analysis using the detailed information of the electron tracks, which corresponds to a decrease in the efficiency to 15% of the nominal value (as indicated with the black square in Fig. 3).
This clearly demonstrates the effectiveness of the ETCC and the additional detailed tracking information for gamma-ray imaging, as compared to traditional CC. The requirement of one fully contained electron in the TPC removes the major background sources of electron escape and reabsorption events. In addition, the cut effectively rejects all “neutrons and cosmic rays.” Thus, we are able to select pure Compton-scattering events without loss of efficiency by applying these two filters, i.e., the fully contained recoil electrons and the cut (Fig. 2). Such a robust event selection also gives the added benefit of enabling us to simulate the fluxes and images of gammas from both celestial points and extended objects with high reliability.
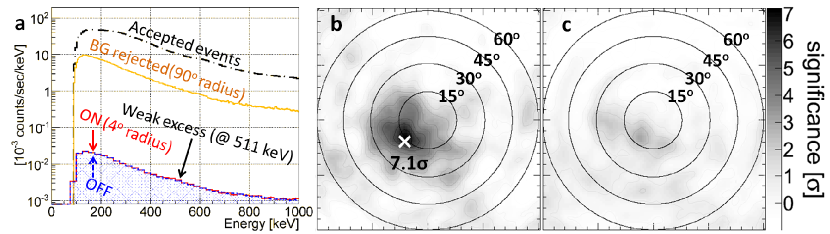
In a separate experiment, a measurement was carried out, using a 27 kBq equivalent 22Na source (511 keV) set at a distance of 5.5 m from the ETCC, in order to study the performance under poor signal-to-noise ratio (S/N) conditions similar to those present in astronomical observations. This setup was expected to provide a S/N of about a half of that expected from the observation of Crab under balloon conditions (expected S/N of 0.005). By applying the two cuts explained in Section 3, we obtained a clear image with a significance of 7.1 in 100 hr observation for an SPD resolution of 200∘ and gamma energies of 51151 keV (Fig. 7b). Fig. 7a gives the associated energy spectra. The error of the measured fluxes was 20%, as estimated from the difference between the measurement result and that expected from the effective area in Fig. 3. On the other hand, no significant enhancement () was observed in the absence of electron-tracking information, even after a tight energy-cut is applied (Fig. 7c). This result of Fig. 7b supports a significant detection of Crab with at least 5 in the energy range of 200-600 keV in 4 hr of observation, even with a poor SPD resolution of 200∘, where we take into account by respective factors of 4 and 3 increases in the effective area and in the flux of Crab in the energy range of 200–400 keV.
5. Imaging with use of SPD
Unclean images are another serious problem in the CC. However it has been dramatically improved by determining the SPD for all the events.
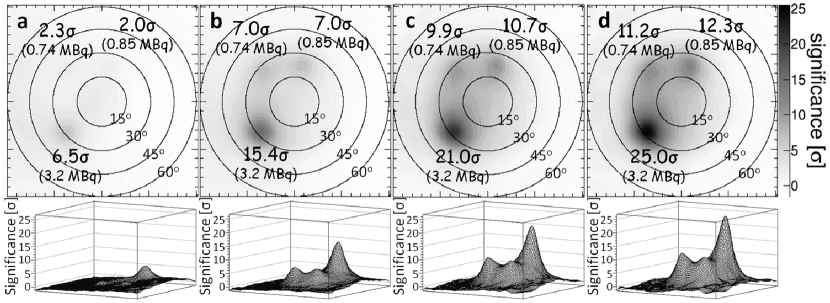
In CCs, images are obtained by accumulating Compton annuli on the celestial sphere, where a fair amount of background event annuli overlap the target region and produce serious artifacts. Figures 8a and 8b show the significance maps of three 137Cs sources with different intensities, put at a distance of 2 m, with respective annuli and SPD arcs being overlaid. The significances are improved by a factor of 3, even with the worst possible SPD resolution of 200∘. To obtain these images, the probability functions of one gamma were defined as an annulus with the area normalized to 1 for a CC (Schönfelder et al.,, 1993) and as a Gaussian normalized with the SPD resolution for the ETCC.
The SPD resolution was determined by the uncertainty of the reconstruction method rather than the multiple scattering of a recoil electron (Section 2). We have recently successfully improved the time resolution of the coincidence between anodes and cathodes to 1 ns from 10 ns by correcting the time walk of each hit pixel using the TOT. As a result, the reduction of the number of multi hits in a track provides a very clear image of the track (Figs. 5c and 5d). Such a clear track enables us to measure the SPD at a distance of 1 cm from the scattering point, which reduces the effect of multiple scattering in the gas. Figure 4c shows a correlation between the improved SPD and the electron energy. The spread of the SPD obviously shrinks, as the electron energy increases (80 keV) (Figs. 4d and 4e). The SPD resolutions are nearly consistent with the multiple scattering angles in Ar gas. Next, we reanalyzed the case presented in Fig. 8b with a SPD resolution of 100∘ and two SPD resolutions optimized for low energy electrons (80 keV) and high energy ones (80 keV), and plotted the results in Figures 8c and 8d, respectively. We found a massive increase in the signal by 10. In Fig. 8d, the most reliable SPD resolution that maximizes the imaging significance was estimated for each energy range (10-80 keV and 80 keV), although we should note that the significances are moderately dependent on the SPD resolutions. These value are better than the SPD resolutions in Figs. 4d and 4e (see the caption of Fig. 4).
6. Discussion
Our ETCC provides a robust recipe for both removing the huge backgrounds and producing clear images, and as a result, gives nearly 10 times better overall sensitivity than that of conventional CC. The next important step would be the improvement of the SPD resolution up to the multiple scattering-angle in order to exploit the potential of electron tracking.
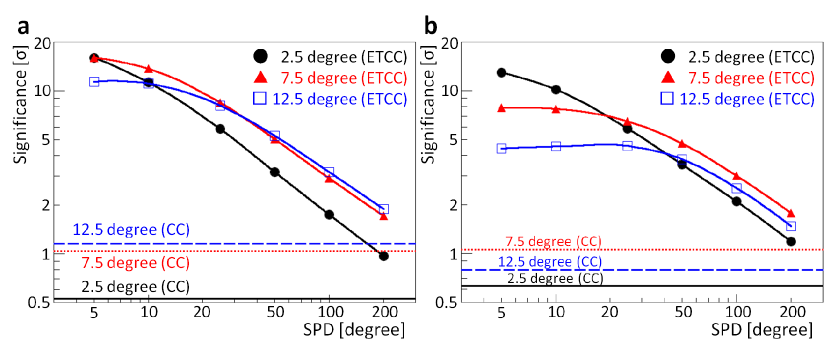
It is well known that the annulus of conventional CC leads to multiple intersections and a wide spread of the PSF. A better SPD resolution is naively expected to increase the significance by a factor roughly proportional to 180∘/(SPD resolution). Our simulation results appear to confirm it Figures 9a and 9b, where a S/N of (or total events) is assumed. In the simulation, the variation of the significance as a function of the SPD resolution was calculated for three accumulated regions on the FOV and two ARM resolutions, while constraining the Compton scattering angle (Fig. 1a) to smaller than 60∘.
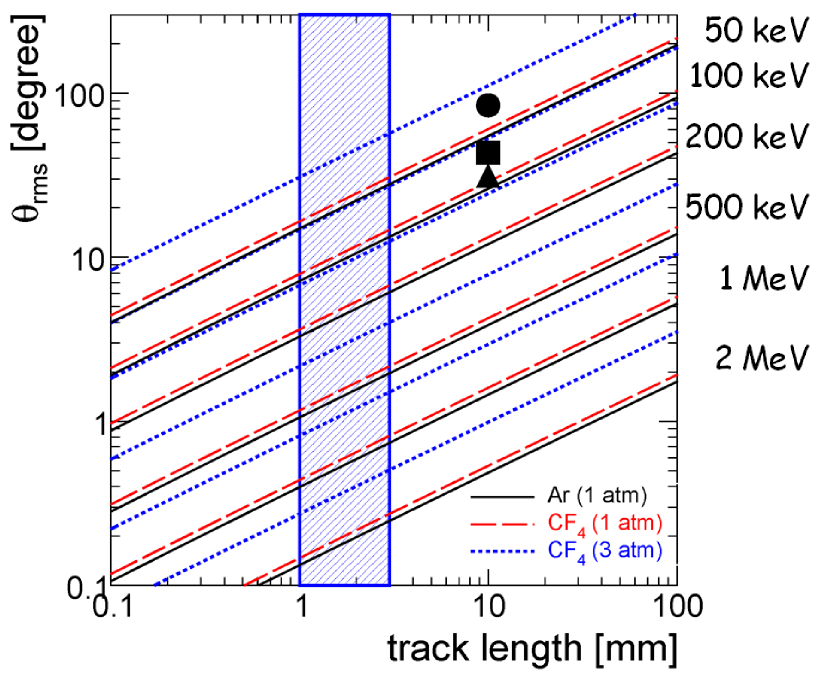
Figure 10 shows the calculated dependence of the multiple scattering angle of the recoil electron along the length of the track used for the angle measurement for Ar and CF4 gases at the normal pressure and CF4 at 3 atm, where the calculation was performed with GEANT4, in which we employed an empirical expression for the multiple scattering based on experimental data (Attwood et al.,, 2006). We expect to improve the SPD resolution to the hatched region in this figure (see the discussion later in this section). Thus, the SPD resolutions for gammas above 500 keV (with recoil-electron energy of 200 keV) and above 1 MeV will be reduced to within 20∘ and 10∘, respectively.
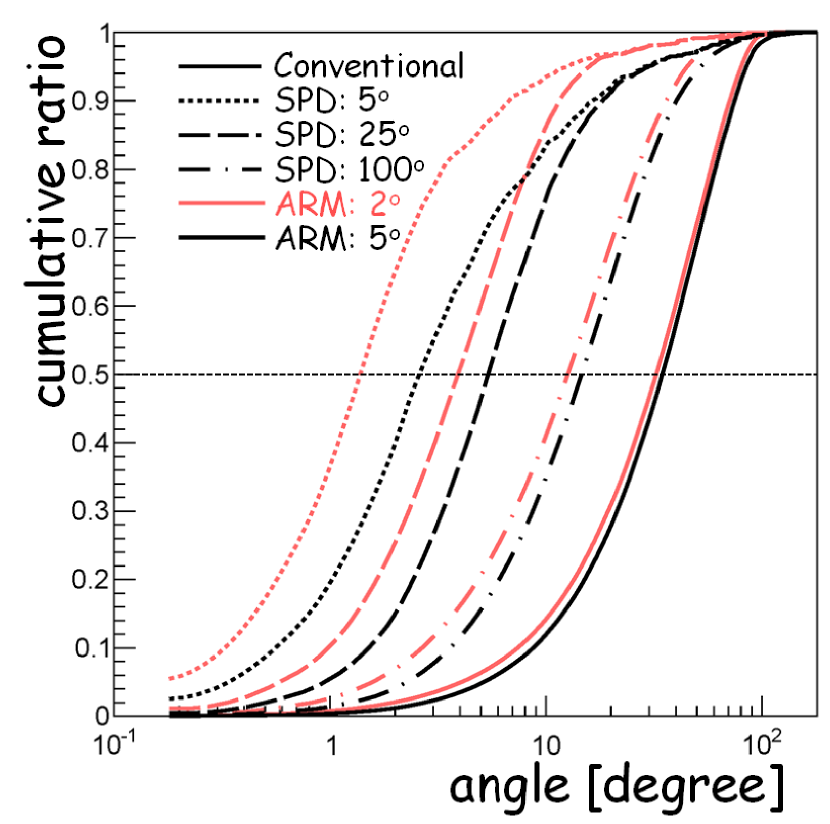
The cumulative ratio of the PSF for gammas emitted from a point source is plotted as a function of its angular radius for three SPD resolutions (100∘, 25∘, and 5∘) in Fig. 11, along with the annulus of a conventional CC, where two ARM resolutions of 2∘ and 5∘ (FWHM) are assumed. Hereafter, PSF () is defined to contain a half of the gammas emitted from the point source within the angular radius . First, from Fig. 11, we note that the PSF is predominantly dependent on the worse one between the SPD and ARM resolutions, where an SPD resolution of 20∘ gives a similar dispersion as an ARM resolution of 5∘ when projected on the celestial sphere. The improvement in the significance due to better ARM resolutions is only seen for the case with the SPD resolution of better than 30∘ (Fig. 11). Thus, the improvement of the ARM resolution from to is effective in improving the PSF only if the SPD resolution is also improved below 30∘. The PSF for conventional CCs, on the other hand, appears to be determined by the Compton scattering angle of Fig. 1a, judging from the fact that the cumulative ratio of the PSF reaches 1 at 120∘, or the largest diameter of the scattering . Thus, only an improved SPD resolution can counteract the spread of signals due to the annulus in a CC, and can recover a point-like PSF similar to telescopes in other energy bands.
The wide spread of the PSF for poor SPD resolutions and conventional CCs is due to the normalization of the probability on the arc and annulus (Section 5), which is necessary to keep the background level statistically similar for any SPD resolution, including an annulus. Maximum Likelihood Expectation Maximization (ML-EM) has been used in CCs to compensate for the spread and sharpen the PSF of gamma-ray sources from the background (Schönfelder et al.,, 1993; Wilderman et al.,, 1998; Bandstra et al.,, 2011). When the statistics of the signals are ideal, ML-EM can extract the maximum signal as determined by the effective area and PSF (ARM resolution). However, even with ML-EM, it is difficult to reproduce statistically poor signals from a huge background with the uncertainty at the similar level as the signal. We also note that an inherent risk of introducing artifacts for such background-dominated data should not be underestimated, particularly in MeV gamma-ray astronomy. Thus, conventional CCs have looked to detect signals for bright celestial objects only, for which the ML-EM works optimally. However, moderate-intensity objects, whose flux was judged to be sufficient to allow detection, based on the sensitivity estimated from the effective area and PSF, actually turned out to be difficult to detect due to the breakdown of the ML-EM method. On the other hand, ML-EM would function well for an ETCC, thanks to its sharp PSF and low background. More fundamentally, the sensitivity would be determined solely by the effective area and the PSF, and supplemental tools, such as ML-EM, only serve to improve the significance by several factors by applying some constraints.
Considering all those, how would a better SPD resolution be attained, using the present technology of the ETCC? In the present detector technology, a gaseous TPC with a micro-pattern detector provides very accurate 3D tracking for electrons in the energy range from keV to MeV. Even a high-resolution CCD with a 10 m pixel pitch and 2D tracking has been reported to provide an SPD resolution of only 200∘ FWHM for 100 keV for 2D tracking (Vetter et al.,, 2011). We have just begun the detailed study of the 3D reconstruction of recoil electrons in the gas of the ETCC, and expect to be able to improve the uncertainty of the Compton-scattering point from the current 8 mm down to a few millimeters. This will improve both the SPD and ARM resolutions to about a half of the present value and to the calculated value in Fig. 5, respectively.
The selection of the gas for the TPC is the most important factor for the performance of the ETCC. In general, a scatterer of CCs should provide a large cross-section of Compton scattering, while also having a small cross-section for photo absorption to minimize the background. In addition, a small diffusion constant and small multiple scattering for the recoil electron are very important for the ETCC. All of the requirements above can be met with CF4 gas in the ETCC. Then, we are planning to use a 3 atm CF4 gas in the next version of the ETCC. CF4 gas has a large Compton-scattering cross-section due to the large number of electrons per molecule (44), while simultaneously suppressing the photo-absorption cross-section, which is proportional to in the Born approximation (with the atomic number = 9 for F). Its diffusion constant is smaller than that of Ar gas. Hence, it is possible to develop a larger TPC with a drift length greater than 50 cm, where a positional error at the MPGD due to the fluctuation of the centroid of the diffusive drift-electron cloud over a 50-cm drift length is estimated to be 150 m in a 3 atm CF4 gas.
Furthermore, with the use of CF4, the SPD resolution, which is the most important parameter for the ETCC, is expected to be improved in the following reason. For pressurized gas, the multiple scattering angle is proportional to the product of (pressure) and (track range). Whereas the multiple scattering angle per length of CF4 is similar to that of Ar gas (Fig. 10), is 3 times larger, and the diffusion constant is smaller, than those of Ar gas. Then, combined with a smaller track sampling of 400 m (reduced from the present 800 m), it would significantly improve the fitting resolution of the track. With this expected improvement, it would be possible to reduce the track range needed to measure the SPD from 1 cm down to a few mm, which would exceed the increase of the multiple scattering due to the increase in gas pressure to 3 atm. Thus, an ETCC with pressured CF4 gas would give a slightly better PSF than that of Ar gas at the normal pressure. This fact, combined with the properties described above, makes CF4 gas extremely well suited to provide the optimum performance for our ETCC.
Next, although the introduction of and SPD successfully resolved the two problems of huge backgrounds and unclear images , we should also consider the backgrounds that cannot be removed in theory with and/or SPD, i.e., the simultaneous emission of X- and gamma-rays or two gamma-rays from radioisotopes generated by cosmic rays, and accidental coincidences between the TPC and PSAs. Due to the large cross-section for photo absorption of X-rays, false Compton events arise from a photo-electric absorption of one gamma-ray (or X-ray) in the TPC and a random coincidence of a second gamma-ray in the PSA. Indeed, those false events were reported to be one of the dominant backgrounds in COMPTEL (Weidenspointner et al.,, 2001). However, the small photo-electric absorption cross-section of CF4 (1/5 of that of Ar with the same number density of atoms) makes it considerably less sensitive to X-rays compared to Ar and Si. Absorption probabilities for X-rays at an energy of a few tens of keV in a 50 cm-cubic 3 atm CF4 and 8 atm Ar are transparent (10% at 30 keV) and opaque (80%), respectively, where the respective pressures are chosen so that they have the same Compton-scattering probability. Such insensitivity to X-rays of CF4 also reduces the false Compton events, because most of the single hits in the TPC are due to X-rays. Furthermore, the ETCC provides another tool to remove such backgrounds via a kinematical test using the angle of Fig. 1a, which was introduced as a new parameter for the ETCC in SMILE-I (Section 2). The poor angular resolution for the direction of the recoil electron would result in the rejection of a number of good Compton events. For that reason, we have not used the kinematic test for SMILE-II. However, because such events do not satisfy Compton kinematics, the angle should be randomly distributed between and . Further improvement of the directional resolution of the recoil electron will reduce the uncertainty of to 20∘ (from the current 40∘ at FWHM), which will allow us to suppress such background by nearly one order of magnitude.
A final remark is that we have developed the ETCC, using well-established technologies (i.e., gas counters and scintillators), and even a 4-module satellite ETCC would need only 104 read-out channels for TPC and PSAs with low power electronics and no specific cooling system. In addition, due to the strong background rejection capability, no active shield would be required. Then, the component with the largest contribution to the weight would be the scintillators (more than half the total weight), which is intrinsically needed to absorb and detect gamma rays. Thus, the ETCC would be the lightest CC, and would provide the lowest background-radiation level in space.
7. Conclusion
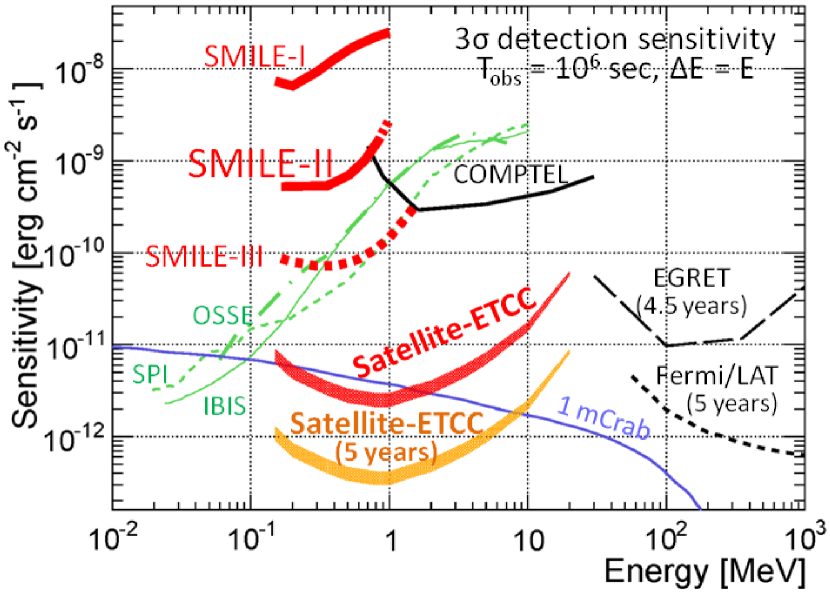
We have revealed that the SPD dramatically recovers the gammas detected in the effective area within several degrees of the target position, whereas they exude sparsely over the FOV in conventional CC. With this, 10 times better sensitivity than CC per unit effective area will be certainly expected (Fig. 9). Also, the radical reduction of almost all the instrumental background is found to be attainable by the use of the measured of the recoil electron, a kinematical test of the angle and the optimization of the scattering material such as CF4. Our ETCC has changed delicate CCs to a very tough and reliable gamma imaging device under intense radiation conditions, notably the space. Thus, by resolving two serious problems of the MeV gamma-ray astronomical observations, we have reached the intrinsic sensitivity determined by its effective area, PSF, and the background of cosmic diffuse gammas, as follows. Figure 12 shows the expected sensitivities of the SMILE balloon experiments, along with a satellite-ETCC consisting of four 50 cm-cubic ETCCs, which, with its large FoV, provides the sensitivity of 210-12 erg cm-2 s-1 at 1 MeV for 106 s observation, and 310-13 erg cm-2 s-1 for continuum gammas with a sensitivity of 10-7 gamma cm-2 s-1 for line gamma-rays in 5 years operation (100 times better than those of COMPTEL in 9 years), where a duty factor of 0.5 in the operation is assumed. Note that the green and black lines are from the previous results (Atwood et al.,, 2009; Takahashi et al.,, 2013). The background observed in SMILE-I was used for the SMILE-II and SMILE-III simulations. For the background for the Satellite-ETCC, we used the value twice as the extragalactic diffuse gamma flux in 0.1–5 MeV reported with SMM (Watanabe et al.,, 1999) and COMPTEL (Weidenspointner et al.,, 2000), assuming the instrumental background to be at the same level as the extragalactic diffuse gamma. The PSF ( = 1.2∘) with the ARM and SPD resolutions of 2∘ and 5∘ was used for the Satellite-ETCC, and the PSF (4∘) with the ARM and SPD resolutions of 5∘ and 25∘ was used for the SMILE-II and III. One half of the detected gamma-rays from a point source were used in the calculations of the sensitivity. The application of ML-EM to the ETCCs may improve the sensitivities by several factors. However, it is not essential because we successfully provide, for the first time, quantitatively reliable sensitivities for CCs without the use of an optimization algorithm like the ML-EM method. Thus, satellite-ETCC would access the deepest universe in high energy astronomy.
Furthermore, with its excellent sensitivity it would detect 15 SNe Ia/year at distances up to 60 Mpc with required statistical accuracy (Section 1). For the distances up to 100 Mpc, 500 and nearly a thousand SNe/5 years (5 in 150 days) would be expected with and without optical coincidence, respectively, with no observational bias, thanks to the large FOV and high transparency of MeV gammas. Note that this sample should include some collapsars, in which production of 56Ni is considered to be less than that in SN Ia.
Also, the well-defined reconstruction of Compton events with low background endows the ETCC with an excellent polarimetry (simulated modulation factors of 0.6 and 0.5 at 200 and 500 keV, respectively). The Satellite-ETCC would measure 10% polarization (3) for 20 mCrab. Thus, such observations would open a new era of astronomy with distinctive detections of thousands of MeV objects.
References
- Agostinelli et al., (2003) Agostinelli, S., Allison, J., Amako, K., et al., 2003, NIMPA, 506, 250
- Aprile et al., (2004) Aprile, E., Curioni, A., Giboni, K. L., et al. 2004, NewAR, 48, 257
- Attwood et al., (2006) Attwood, D., Bell, P., Bull, S., et al., 2006, NIMPB, 251, 41
- Atwood et al., (2009) Atwood, W. B., Abdo, A. A., Ackermann, M., et al. 2009, ApJ, 697, 1071
- Bandstra et al., (2011) Bandstra, M. S., Bellm, E. C., Boggs, S. E., et al. 2011, ApJ, 738, 8
- Biagi, (1999) Biagi, S. F. 1999, NIMPA, 421, 234
- Boggs, (2006) Boggs, S. E. 2006, NewAR, 50, 604
- Chevalier, (1992) Chevalier, R. A. 1992, Nature, 355, 691
- Churazov et al., (2014) Churazov, E., Sunyaev, R., Isern, J., et al. 2014, Nature, 512, 406
- Greiner et al., (2009) Greiner, J., Iyudin, A., Kanbach, G., et al. 2009, ExA, 23, 91
- Hillebrandt & Niemeyer, (2000) Hillebrandt, W. & Niemeyer, J. C. 2000, ARA&A, 38, 191
- Inoue et al., (2013) Inoue, Y., Murase, K., Madejski, G. M., Uchiyama, Y. 2013, ApJ, 776, 33
- Isobe et al., (2003) Isobe, T. Hamagaki, H., Ozawa, K., et al. 2003, Nucl. Sci. Symp. Conf. Rec. 2003 IEEE, 5, 3652
- Iyudin et al., (1994) Iyudin, A. F., Diehl, R., Bloemen, H., et al. 1994, A&A, 284, L1
- Kabuki et al., (2010) Kabuki, S., Kimura, H., Amano, H., et al. 2010, NIMPA, 623, 606
- Kanbach et al., (2006) Kanbach, G., Andritschke, R., Zoglauer, A., et al. 2006, NIMPA, 541, 310
- Kurosawa et al., (2010) Kurosawa, S., Kubo, H., Hattori, K., et al. 2010, NIMPA, 623, 249
- Maeda et al., (2012) Maeda, K., Terada, Y., Kasen, D., et al. 2012, ApJ, 760, 54
- Maeda, (2014) Maeda, K 2014 Private communication
- Maoz & Mannucci, (2012) Maoz, D. & Mannucci, F. 2012, PASA, 29, 447
- Matsuoka et al., (2015) Matsuoka, Y., Tanimori, T., Kubo, H., et al. 2015, JInst, 10, C01053
- Matz et al., (1988) Matz, S. M., Share, G. H., Leising, M. D., Chupp, E. L., Vestrand, W. T. 1988, Nature, 331, 416
- Mészáros & Rees, (2010) Mészáros, P., & Rees, M. J. 2010, ApJ, 715, 967
- Miuchi et al., (2010) Miuchi, K., Nishimura, H., Hattori, K., et al. 2010, PhLB, 686, 11
- Mizumura et al., (2014) Mizumura, Y., Tanimori, T., Kubo, H., et al. 2014, JInst, 9, C05045
- Nakauchi ei al., (2012) Nakauchi, D., Suwa, Y., Sakamoto, T., Kashiyama, K., Nakamura, T. 2012, ApJ, 759, 128
- Nakazawa et al., (2012) Nakazawa, K., Takahashi, T., Ichinohe, Y., et al. 2012, Proc. SPIE, 8443, 84430E
- Orito et al., (2004) Orito, R., Kubo, H., Miuchi, K., et al. 2004, NIMPA, 525, 107
- Sauli, (1977) Sauli, F. 1977, CERN-77-09
- Sawano et al., (2014) Sawano, T., et al. 2014, JPSCP, 1, 013099
- Schönfelder et al., (1993) Schönfelder, V., et al. 1993, ApJS, 86, 657
- Schönfelder et al., (2000) Schönfelder, V., Bennett, K., Blom, J. J., et al. 2000, A&AS, 143, 145
- Schönfelder, (2004) Schönfelder, V. 2004, NewAR, 48, 193
- Summa et al., (2013) Summa, A., Ulyanov, A., Kromer, M., et al. 2013, A&A, 554, A67
- Takada et al., (2005) Takada, A., Hattori, K., Kubo, H., et al. 2005, NIMPA, 546, 258
- (36) Takada, A., Kubo, H., Nishimura, H., et al. 2011, ApJ, 733, 13
- (37) Takada, A., Tanimori, T., Kubo, H., et al. 2011, Proc. of 20th Symp. on European Rocket and Balloon Programmes and Related Research, ed. Ouwehand, L. (ESA Communications, ESTEC, Noordwijk, The Netherlands), SP-700, 567
- Takahashi et al., (2013) Takahashi, T., Uchiyama, Y., & Stawarz, L. 2013, APh, 43, 142
- Tanimori et al., (2004) Tanimori, T., Kubo, H., Miuchi, K., et al. 2004, NewAR, 48, 263
- Tanimori et al., (2012) Tanimori, T., Ikeno, M., Kubo, H., et al. 2012, Proc. SPID, 8443, 84430D
- Thun, (1988) Thun, R. 1988, NIMPA, 273, 157
- Vetter et al., (2011) Vetter, K., Chivers, D., Plimley, B., et al. 2011, NIMPA, 652, 599
- von Ballmoos et al., (2012) von Ballmoos, P., Alvarez, J. Barrière, N., et al. 2012, ExA, 34, 583
- Watanabe et al., (1999) Watanabe, K., Hartmann, D. H., Leising, M. D., & The, L. S. 1999, ApJ, 516, 285
- Weidenspointner et al., (2000) Weidenspointner, G., et al. 2000, AIP Conf. Proc., 510, 467
- Weidenspointner et al., (2001) Weidenspointner, G., et al. 2001, A&A, 368, 347
- Wilderman et al., (1998) Wilderman, S. J., Clinthorne, N. H., Fessler, J. A., & Rogers, W. L. 1998, IEEE Nucl. Sci. Symp. Conf. Rec., 3, 1716
- Zhang & Beacom, (2004) Zhang, P. & Beacom, J. F. 2004, ApJ, 614, 37