BEPPOSAX and RXTE SPECTRAL STUDY OF THE LOW-MASS X-RAY BINARY 4U 1705-44. SPECTRAL HARDENING DURING the BANANA BRANCH
Abstract
We analyze the X-ray spectra of the atoll 4U 1705-44 when the source undergoes the islandbanana state transition. We use the Rossi X-ray Timing Explorer (RXTE) and BeppoSAX observations for this analysis. We demonstrate that the broad-band energy spectral distributions for all evolutinary states can be fitted by a model, consisting two Comptonized components. One arises from the seed photons coming from a neutron star (NS) atmosphere at a temperature 1.5 keV (herein Comptb1) and a second resulting from the seed photons of 1.11.3 keV coming from the disk (herein Comptb2). We found that we needed to add a low-temperature blackbody and an iron-line (Gaussian) component to the model in order to obtain highquality fits. The data analysis using this model indicates that the power-law photon index of our model is always about 2, independently of the spectral state. Another parameter, demonstrates a two-phase behavior depending on the spectral state. is quasi-constant at when the electron temperature keV and is less than 2, in the range of , when keV. This phase is similar to that was previously found in the Z-source Sco X-1. We interpret the decreasing index phase using a model in which a super-Eddington radiation pressure from the neutron star causes an expansion of the Compton cloud similar to that found previously in Sco X-1 during the Flaring branch.
1 Introduction
Low mass X-ray binaries (LMXBs), which contain a neutron star (NS), have been observationally classified as atoll-type and Z-type XBs (Hasinger & van der Klis, 1989). The distinct observational characteristics of these two groups are not fully understood. This classification was initially based on the patterns which could be traced out using the Color Color Diagram (CCD). The CCD of Z-sources shows three branches [horizontal, normal and flaring ones (HB, NB and FB respectively) or so called a Z-pattern, while the CCD of atolls displays two branches. These two branches of atolls are known in the literature as the island and the banana states. However later it has been also found that these two classes exhibit quite different spectral and timing properties.
The main difference between these two groups is probably related to their different luminosity ranges. Most atolls vary in the range from 0.01 to 0.5 of the Eddington limit , while Z-sources irradiate close to . Their luminosity is in the (0.5 - 1) range. In this context, Lin et al. (2009) and Homan et al. (2010) made an interesting suggestion for the Z-track sources using RXTE observations of the transient neutron source NS XTE J1701-462. The source behaves as a Z-source when its luminosity was close to , and when the source fades, it shows all properties of an atoll. However, the observations of XTE J1701-462 for the last seven years no longer demonstrate this type of behavior.
Another example of the hybrid atoll and Z-source properties is revealed in a unique source 4U 1705-44. It shows the spectral soft-hard state evolutions on the time scales of a month with well-determined recurrence. Also Langmeier et al. (1987); Sztajno et al. (1985) and Di Salvo et al., 2015) found type I X-ray bursts and Ford et al. (1998) discovered kilohertz quasi-periodic oscillations. While 4U 1705-44 is identified as an atoll, it also has properties of a Z-source (Barret & Olive, 2002, hereafter BO02). The power density spectra (PDS) of 4U 1705-44 resemble those of Z-sources when it is on its diagonal branch (similar to the branches of Z-sources). In this case its PDS resembles those found on the top branch of the Z-track (see the RXTE data analysis in BO02).
Usually a sum of a soft blackbody component, presumably forming in the accretion disk (AD), and a hard X-ray component originating in a corona [a transition layer (TL), located between the NS and the AD] well describes X-ray spectra of NS LMXBs . In addition, a broad iron line (most likely the Fe K emission) is often revealed. BO02 analyzed the RXTE PCA data of 4U 1705-44 focusing on the spectral-timing behavior. They used this model and included a 6.4 keV iron line component to show that the spectral transitions of 4U 1705-44 were followed by changes of the plasma temperature of the Comptonizing cloud. However, the BO02 model did not separate the contribution of the Comptonized disk photons from that of the NS photons in the resulting spectrum. Paizis et al. (2006) and Fiocchi et al. (2007) presented the average INTEGRAL IBIS spectrum of 4U 1705-44 which indicated the existence of a high-energy tail in the spectrum.
Recently Seifina et al (2013), hereafter STF13, applied a so-called two component Comptonization model to the spectral data of GX 340+0 and Titarchuk et al. (2014, hereafter TSS14), analyzed the data of Sco X-1 using the same model. Note that GX 340+0 and Sco X-1 are Z-sources. This self-consistent model allows one to separate Comptonized emission caused by upscatering of the NS surface photons in a Compton cloud from that caused by the seed photons of the accretion disk. STF13 demonstrated that the Comptonized emission of the NS photons dominates during all spectral states for GX 340+0 and Sco X-1, while that related to the Comptonized disk photons formed the hard energy tail of X-ray spectrum. Previously, Farinelli et al. (2009) successfully implemented the same kind of model in an analysis of the BeppoSAX observations of Z-source Cyg X-2 to describe the spectral evolution of the source from the HB to the NB.
The broad-band ( keV) spectrum of 4U 1705-44 was analyzed by Egron et al. (2013), who used the combined data of BeppoSAX, XMM-Newton, and RXTE. The authors fitted the spectrum by a combination of a BB plus a thermal Comptonized model (compTT or nthcomp, in the XSPEC package), modified by the photoelectric absorption (phabs) at low energies. Their fit was modified by the addition of a by a broad Gaussian line and also by inclusion of the reflection components pexriv or reflionx. Their results are in agreement with those reported by Piraino et al. (2007) and Di Salvo et al. (2009) for the soft state of 4U 1705-44. In particular, these authors found that in the soft state, varies from cm-2 to cm-2 and the index changes from 2.2 to 2.6, the BB temperature is about 0.5 keV, the plasma and seed photon temperatures of the Comptonized component are 3.5 keV and 1.2 keV, respectively. The centroid energies of four line components are at 2.6 keV, keV, keV and keV, respectively. Egron et al. (2013) used a similar model to fit the hard state spectra of 4U 1705-44. They found that in the hard state is about cm-2, the index changes from 1.8 to 2.0, the BB temperature ranges from 0.24 keV to 0.58 keV, and the electron and seed photon temperatures of the Comptonized component are about keV and 0.7 keV, respectively. The inclination of the system, estimated using the diskline or the reflection component, is in the interval of [see Egron et al. (2013); D’Ai et al. (2010); Di Salvo et al. (2009) and Di Salvo et al. (2015)]. Note that XMM-Newton data analysis done by Egron et al. (2013) provides a value around cm-2 for both of the hard and soft states. They also find that the value derived from the non-simultaneous RXTE data is different, cm-2.
Recently, Church et al. (2014) present the relation between atoll and Z-sources in the frame of a unified model for LMXBs. Based on the RXTE and SAX data analysis for a number of Z and atoll sources (4U 1705-44 among them) they used the so-called ADC (the Comptonizing accretion disk corona) model to show how the ISs and BSs in atolls relate the states seen in Z sources. Particularly, they demonstrated a common feature of Z and atoll behavior of the electron temperature being high in the hard states and then it sharply dropping at the “critical” luminosity of about erg s-1. But is low (at about ) when the luminosity increases during the soft states.
Church et al. (2014) also claim that the IS of atoll sources is characterized by a high based on the ADC model but the IS is absent in Z-sources because their luminosities are greater than a “critical” value. Also in Z-sources there is the flaring Branch (FB) which is associated with unstable nuclear burning on the NS at high mass accretion rate . This unstable burning regime is not pronounced at low and thus this branch is not observed in atoll sources (except in the GX atolls). However, Church et al. (2014) are not able to explain the presence of a high energy tail seen up to 200 keV in Z-sources (D’Ai et al. 2007) and in the soft state of atoll-sources. In particular, Di Salvo et al. (2000) discovered a state-dependent hard energy tail in Z-source GX 17+2. For example, the prominent tail in Sco X-1 was first revealed by D’Amico et al. (2001) with HEXTE/RXTE and Di Salvo et al. (2006) using . The first hard tail in -type source was discovered by Piraino et al. (2007). Thus, it is necessary to take into account these high-energy tails in analyzing the spectra of atoll and Z sources.
TSS14 studied the spectral-timing property relations observed in Sco X-1 using the RXTE observations. They found that the Sco X-1 energy spectra [for (3200) keV range] during all Z-state transitions could be adequately reproduced by a double-Comptonization model. This model allows us to separate two contributions to the resulting spectrum. One spectral component is presumably associated with the Comptonization of the NS seed photons and another one is related to the Comptonization of the seed photons from the disk. Using this model, TSS14 reveal a unique stability of and which values are around 2 during the Z-states except of the FB. TSS14 explain the detected stability of these photon indices using the model in which the disk photon flux is negligibly small with respect to the energy release in the TL. However, over the FB TSS14 detect the decreasing index phase, which they interpret using a model in which the accreted matter deposits its gravitational energy only in some external part of the TL. In this case the TL innermost part is cooler than the outer part (mostly owing to illumination by the NS soft photons), and thus the resulting radiative luminosity achieves the Eddington one there. As a result, the accretion flow is stopped by .
In this paper we analyze the BeppoSAX observations of 4U 1705-44 that took place during August and October of 2000 [see Fiocchi et al. (2007), Piraino et al. (2007) , Egron et al. (2013)]. We also analyze the RXTE observations that were made during 1997 – 2000 [see Barret & Olive (2002), Muno et al. (2002) and Egron et al. (2013)] In §2 we present the details of our data selection procedure and show an observation list that we selected for our analysis. In §3 we give the spectral analysis details. We interpret the spectral properties and their evolution observed during the different spectral states in §4. Our results are discussed and our conclusions are presented in §5.
2 Data Selection
In 2000 August and October observed 4U 1705-44 (see details in Table 1). A combination of the data from three BeppoSAX instruments gives us the source energy spectra. Namely, we used Narrow Field Instruments (NFIs): the Low Energy Concentrator Spectrometer (LECS; Parmar et al. (1997)) for the 0.3 4 keV range, the Medium Energy Concentrator Spectrometer (MECS; Boella et al. (1997)) for the 1.810 keV range, the High Pressure Proportional Gas Scintillation Counter (Manzo et al. 1997) for the 850 keV range, and the Phoswich Detection System (Frontera et al., 1997) for the 15150 keV range.
For data reprocessing we applied the SAXDAS data analysis package and we carried out the spectral analysis in the energy band related to each of these instruments. A relative NFI normalization was considered as a free parameter for the model fitting. However, we fixed the MECS normalization at 1. Following this procedure, we wanted to control that all of these normalizations were located in standard instrument ranges 111http://heasarc.nasa.gov/docs/sax/abc/saxabc/saxabc.html.
We also rebinned the spectra to obtain significant data points. In particular, the LECS spectra were rebinned with a binning factor which is not constant over energy (see §3.1.6 of Cookbook for the BeppoSAX NFI spectral analysis). For this rebinning we applied template files in GRPPHA of XSPEC 222http://heasarc.gsfc.nasa.gov/FTP/sax/cal/responses/grouping. Moreover, the Phoswich Detection System spectra were rebinned with a binning factor of 2 when we grouped two bins together (resulting width of the bin is 1 keV). We applied a systematic error of 1% to spectra. We list all BeppoSAX observations used in the presented analysis in Table 1.
We have also used the RXTE data which were obtained from 1997 April to 2000 February. In total, these data include 86 observations sampling the different spectral states. For data processing we utilized standard tasks of the LHEASOFT/FTOOLS 5.3 software package. We applied Proportional Counter Array (PCA) Standard 2 mode data, accumilated in the 323 keV energy range, using the most recent release of PCA response calibration (ftool pcarmf v11.7) for a spectral analysis. We also applied a standard dead time correction procedure to the data. To construct broadband spectra, the data from HEXTE detectors were used. A background derived from off-source observations was subtracted from the source signal.
We have included only data in the 19200 keV range. Thus, we accounted for the HEXTE response uncertainties and determination of the background. The data are available through the GSFC public archive (http://heasarc.gsfc.nasa.gov). A list of observations that covers the source spectral evolution is present in Table 2.
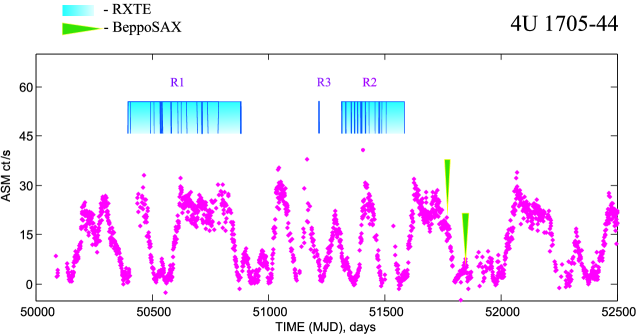
In Figure 1 we plot the overall light curve of the All Sky Monitor (ASM; Levine et al. 1996) on board RXTE in order to assess the intensity of the source on long timescales. The ASM data (from 1995 October 10 to 2002 August 14 2002) indicate long-term variability on the scale of 1 month from 5 ASM counts (corresponding to the hard state) to 35 ASM counts s-1 (the soft state). Note that during the hard state a type-I X-ray burst occured, but none occurred in the soft state (see D’Ai et al., 2010). In fact, we have excluded the type I bursts from the analysis. Generally, the source showed the hard-to-soft transitions characterized by the different timescales of the X-ray flux variability. As seen from Fig. 1, we have chosen the time intervals with long (with high flux “plateau”, set) and with relatively shorter timescale periods of variability ( and ). Thus, we have made a RXTE analysis of the 4U 1705-44 data for 3 yr of observations and divided them to three intervals indicated by blue rectangles in Figure 1 (). The RXTE energy spectra were modeled using XSPEC astrophysical fitting software. We applied a systematic uncertainty of 0.5% to all analyzed RXTE spectra.
3 Results
3.1 CCDs diagrams of 4U 1705-44
To investigate the properties of 4U 1705-44 during different spectral states, we use hard colors (HCs) and soft colors (SCs) and we demonstrate different configurations of CCDs (CCDs, HC versus SC). In Figure 2 we combined CCDs (left panel) and hardness-intensity diagrams (HIDs; right panel). The axises of CCDs show the flux ratios, [20-40 keV/9-20 keV] and [4-9 keV/2-4 keV], while HIDs demonstrate flux ratios, [20-40 keV/9-20 keV] versus PCA count rate (2-40 keV). In the top right corner we indicate IDs of used observational sets. One can see that our data sets cover different parts of HID and CCD from ISs to BSs. Therefore, we select observations performed at different flux levels in the hard and soft states and proceed to use these data for a detailed spectral analysis of the properties of 4U 1705-44 during its islandbanana state evolution.
Note that the shape of the track described above, particularly in the HID, can be affected by secular shifts, the so-called parallel tracks (see, e.g. Di Salvo et al. 2003). Therefore, the data of different sets were marked by different colors (see Figure 2). While data sets investigated by us are associated with different epochs it is clear from this figure that our selected data do not show a noticeable effect of secular shifts. In particular, the HIDs exhibit plain and smooth tracks. Furthermore, we test this effect using flux units instead of counts, in which case the corresponding tracks (hardness-flux diagrams, see Sect. 3.2.4 and Fig. 3) also form a plain and smooth track.
3.2 Spectral Analysis
3.2.1 Choice of a Spectral Model
Many authors have used various models for fitting the 4U 1705-44 spectra. The hard component observed at high luminosity (the high/soft state) can be presented by a power-law that can be interpreted as Comptonization of electrons that have a nonthermal velocity distribution. Specifically, Egron et al. (2013) fit , , and RXTE spectra related to the soft and hard states using a model which includes a Comptonization component, a soft BB component and a smeared reflection component. In particular, the latter component is used to fit the data associated with the hard state. A hard power-law component should also be added in the soft state to account for the statedependent hard tail (see Piraino et al. 2007) . Our approach is to employ a single model that is capable of representing both the hard and soft spectral states of the system with a minimal number of free parameters, with the goal of probing the underlying physical process driving the system.
To probe our modeling approach, we proceeded initially using a model that is a sum of
a Comptonization component, soft BB, and power-law, modified by an interstellar absorption. We also add a
Gaussian line component to take into account a broad iron line associated with the Fe K emission.
But this model [ provides satisfactory fits only for the soft state data [e.g., 40034-01-02-06 and 40034-01-02-09 spectra, =1.16 and 1.34 [77 degree of freedom (d.o.f.),
respectively, see Table 3]; in other words, the model gives a good data description only in 50% of cases. Moreover, the model requires a very large photon index (much greater than 3) for the softstate spectra
(e.g., for 40034-01-02-09 spectrum =3.970.05, see Table 3) and it gives unacceptable
fits for the hard-state data [e.g., for 21292002 spectrum of data =3.28 (193 d.o.f.)]
and for 40034-01-07-02G spectrum of RXTE data [=1.78 (79 d.o.f.)].
Thus, we conclude that the best representation of the data requires
a spectral model that can account for both the soft and the hard components, where each component can be represented by a Comptonization model.
We use a sum of two Comptonization components, in which the first and second components are related to the soft and hard components
of the spectrum respectively.
As a result,
the best fits of the hard- and soft-state spectra have been produced by implementation of the so-called
double Comptonization model (using Comptb333Comptb XSPEC model, see XSPEC v. 12.8.0
in http://heasarc.gsfc.nasa.gov/docs/xanadu/xspec/models/index.html as an example of the Comptonizing model).
This model consists of two Comptonized components (both due to the presence of the TL that
upscatters seed photons of keV coming from the neutron star (first component ), and seed photons
of temperature keV coming from the disk (second component ), a soft BB and the iron-line (Gaussian)
component (see Table 3 for comparative analysis of and
RXTE data). Thus, we apply the double-Comptonization model for fitting all extracted spectra.
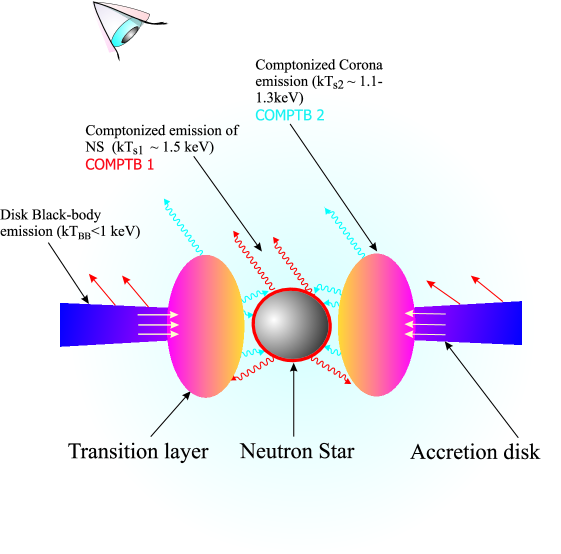
This model supports a scenario in which a Keplerian disk is detached from the Neutron star (NS) by the TL [see Titarchuk et al. (1998)]. In Figure 4 this spectral model is schematically illustrated. We assume that accretion into a NS occurs when the plasma goes through an AD [standard Shakura-Sunyaev disk, see Shakura & Sunyaev (1973)] and the TL. In this scenario the soft NS and disk photons are Comptonized by corona (TL) electrons. As a result, the emergent spectrum is produced in the TL, where soft photons of the temperature from the NS surface and thermal disk seed photons of the temperature are Comptonized off the relatively hot plasma (electrons) of the TL. The TL forms two Comptonized components Comptb1 and Comptb2, respectively. Note that the Earth observer can see directly some fraction of the NS and disk seed photons. That motivates us to add a BB component with temperature to the resulting spectrum. In Figure 4 we show the soft (seed) and hard (upscattered) photons, as red and blue photon trajectories respectively.
It is worth noting that in the framework of the Comptb the emergent spectrum is a convolution of the BB spectrum of the photon temperature and a normalization with the upscattering Green function. The normalization , identical to the XSPEC bbody model:
| (1) |
where is the soft photon (BB) luminosty and is the distance to the source.
To fit the data, we apply our spectral model , where the fit model parameters are the hydrogen equivalent absorption column ; the energy indices , ( and ); the seed photon temperatures , ; parameters and related to the upscattering photon fractions , , specifically where is the relative weight of the upscattering component; the plasma (electron) temperatures and , the BB normalizations and of the Comptb1 and Comptb2 respectively. Finally, to fit the data in the 68 keV range, we add a Gaussian component that is characterized by the parameters (a centroid line energy), (the line width) and (the line normalization).
In any case of a fraction approaches unity and thus we always fix values of at 2.
3.2.2 BeppoSAX data analysis
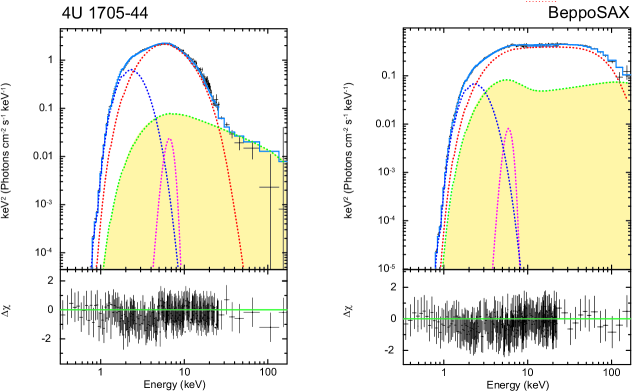
Using BeppoSAX data we demonstrate two spectral diagrams for banana and island branch events along with the atoll track presented in Fig. 5. We show the best-fit spectral diagrams of 4U 1705-44 using BeppoSAX observations 212921001 (left panel) and 21292002 (right panel). We indicate the data by crosses and the best-fit spectral model (see details above) by a light-blue line. Red, green, dark-blue and crimson lines are for Comptb1, Comptb2, Blackbody and Gaussian components, respectively. We present vs photon energy in keV in the bottom panel. For the banana (left panel) =1.990.02, =2.470.01 keV, =2.000.01, =46.00.7 keV, keV and =6.500.03 keV (reduced =1.12 for 132 dof), while for the island (right panel) =2.000.01, =18.90.1 keV, =2.010.01, =51.00.9 keV, keV and =6.510.07 keV (reduced =1.08 for 133 dof., see details in Table 3). The BB temperature , independently of the state, is around 0.6 keV (2 upper limit). The fit quality of the BeppoSAX spectra is significantly improved by inclusion of this component. We aso find that in the soft state (ObsId=21292001) is a larger, namely cm-2 versus that in the hard state () for which cm-2.
Using our model we find that the photon indices of the BeppoSAX spectra are 2.020.02 and 2.010.01 correspondingly (see Table 3). We also find that the seed temperatures and vary in the ranges 1.41.5 keV and 1.11.3 keV, respectively.
3.2.3 RXTE data analysis
The RXTE spectra below 3 keV are not well calibrated; however one can use the BB component parameters using the BeppoSAX broad energy band (0.1-200 keV). Thus, in order to fit the RXTE data we have fixed the BB temperature of the (inner disk) component at 0.6 keV found from our analysis of the BeppoSAX data . Furthermore, because of the limited PCA low-energy coverage, we let be free and constrained to lie in the range cm-2 as early reported by different authors (see e. g. Di Salvo et al. 2005, 2009; D’Ai et al. 20012; Egron et al. 2013). In Table 4 we present the best-fit spectral parameters using the two-Comptb model applied to the RXTE observations.
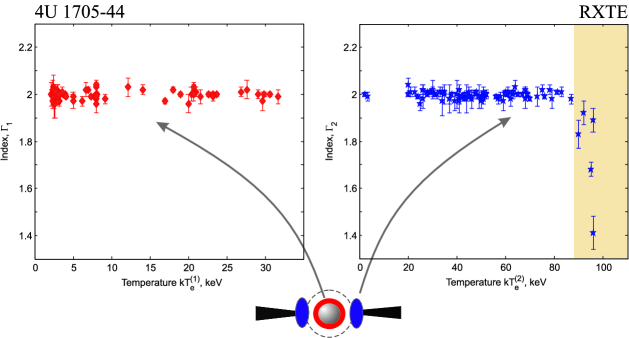
We obtain that varies from 0.01 to 6.1 in units of ( is the seed photon blackbody luminosity in units erg s-1 while is distance in units of 10 kpc). The index is almost constant () for all observations (see Fig. 6). We reveal a two-phase behavoir for the photon index : the phase of the quasi-constant photon index () when varies between 3 keV and 85 keV, and the phase of the reduced photon index () for the high electron temperature keV (see Fig. 6, right diagram). Note that the component width does not significantly change and numerous tests show that it lies in the range of 0.50.8 keV. D’Ai et al. (2010), Di Salvo et al. (2001), Fiocchi et al. (2007) and Egron et al. (2013) carried out a detailed analysis of the XMM- spectra of 4U 1705-44 and they concluded that the iron line is quite broad during all spectral states. Therefore, we chose to fix at a value 0.7 keV for all our fits. The electron temperatures and change in wide ranges from 3 to 20 keV and from 3 to 100 keV respectively (see Figure 6).
3.2.4 HardnessFlux Diagrams of 4U 1705-44
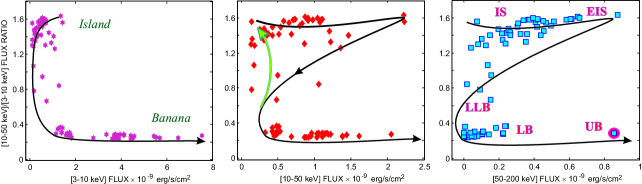
The hardnessflux behavior depends on the energy bands. Figure 3 demonstrates the different shapes of the atoll tracks of 4U 1705-44 depending on the energy band (in flux units). In all these diagrams we use the same observations but divided into different energy bands. Specifically, we plot the flux ratio [10-50 keV/3-10 keV] versus flux in [3-10 keV] (left), [10-50 keV] (center) and [50-200 keV] (right) ranges measured in units of erg s-1cm-2. To make these diagrams, we apply our double Comptb spectral model.
We found that the source exhibited two color states, namely, in the IS and the BS. Here, the black arrow (left panel) indicates the direction of state changing from the island to the banana, whereas green arrow (center panel) marks the direction of state changing from the banana to the island. Note that this hysteresis effect has already been pointed out by BO02 for ID=20074 and 40051 sets. Previously, Gierlìnski & Done (2002) also revealed a Z-shape of CCD track for 4U 1705-44.
While the atoll-track for 4U 1705-44 resembles a “C”-track, the source really moves in a more complicated manner resembling a Z-track. In fact, 4U 1705-44 is characterized by an extreme IS , particularly well seen as an upper alongated horizontal branch in the central panel. However this branch is not seen on the left panel (for a softer flux case). Thus, the source behaves as a Z-source in terms of hardness-flux track.
Note that the hard emission events are accompanied by a decrease of radio emission as observed in a number of Z-sources [Hjellming et al. (1990)]. However, 4U 1705-44 is not seen at radio wavelengths so far (see Fender & Hendry 2000). Furthermore, in agreement with previous timing analysis, 4U 1705-44 demonstrates the typical timing properties of atoll sources. But we should point out the unusual CCD/HID track of this standard atoll source, which is reminiscent of a Z-shape in its hardness-flux diagram. This effect is essentially caused by its elongated extreme IS which is rarely observed from atoll sources.
3.3 Overall pattern of X-ray properties
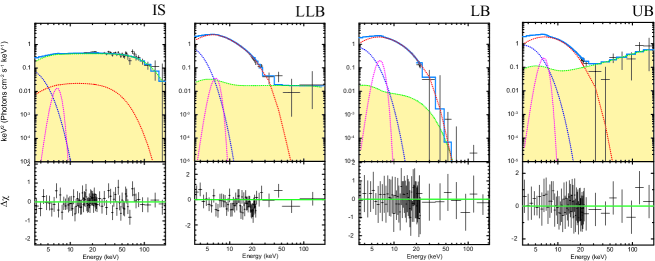
We have found that 4U 1705-44 was in four different spectral states, each of which is represented by spectral diagrams are shown in Figure 7. Data (shown by black crosses) are taken from RXTE observations 40034-01-09-00 (IS), 40034-01-01-00 (lower left banana, LLB), 40034-01-02-09 ( lower banana, LB), and 40034-01-02-06 (upper banana, UB). We show the spectral model components by dashed red, green, blue and purple lines for Comptb1, Comptb2, BB and Gaussian, respectively. To demonstrate an evolution of Comptb2 between the IS, LLB, LB and UB branches, we use yellow shaded areas. Here we show spectral changes in the energies greater than 30 keV that reflect the contribution of the Comptonized components (Comptb1 and Comptb2) for different atoll branches. In Figure 8 we also illustrate these spectral changes using the plot of the electron temperature versus the hard luminosity (for 10-50 keV energy range) along the total atoll cycle of 4U 1705-44.
The relative softening of the Comptb2 component shown in the LB panel in comparison with that presented in the IS, LLB and UB panels is seen in Fig. 7. On the other hand, the UB panel shows the hardening of the spectrum at high energies, the photon index in this case. The hard emission at 50150 keV (high-energy tail) becomes stronger along the UB, in comparison of that for the IS and LLB (when ). In our data set we have found five observations (20161-01-02-00, 20161-01-02-01, 40034-01-02-06, 40034-01-05-07, 40051-03-03-00) in which the high energy tail is strong and extended to 200 keV (similar to that presented in the right panel of Fig. 7). In all these cases the photon index of the Comptonized component corresponds to reduced values . In Fig. 6 we combine these points with for keV with the nearly constant plateau of for keV.
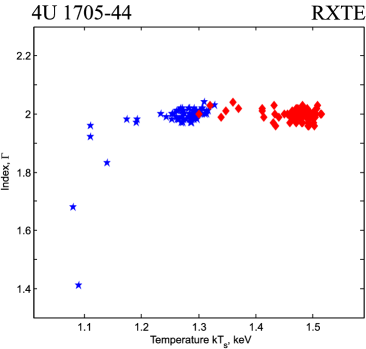
To understand what are the possible reasons that can cause the abovementioned hardening of the 4U 1705-44 spectrum at UB, we plot the photon indices and vs. the seed photon temperatures and (see Fig. 9). Red and blue points correspond to Comptb1 and Comptb2, respectively and thus one can clearly distinguish the Comptonization of soft photons of the NS surface and that related to disk photons in the TL. As is seen from this plot, is less than 2 when the monotonically drops from 1.3 keV to 1.1 keV. This is the first indication that the index drops when the area of the TL increases.
On the other hand, in Figure 6 we show the photon indices and versus of the Comptb1 (red points) and Comptb2 (blue ponts) components (see also Table 4). The decreasing index phase of the Comptonization component is strongly related to the high electron temperature ( keV). That index remains constant when the electron temperature varies within the range 385 keV.
Our Comptonization model demonstrates a high quality for all data sets. The value of , where is a number of degree of freedom, is about 1.0. Only for less than 2% of the spectra does reach 1.4. But never exceeds a a rejection limit of 1.5 which corresponds to a 90% confidence level.
3.3.1 Light curve and related spectral characteristics
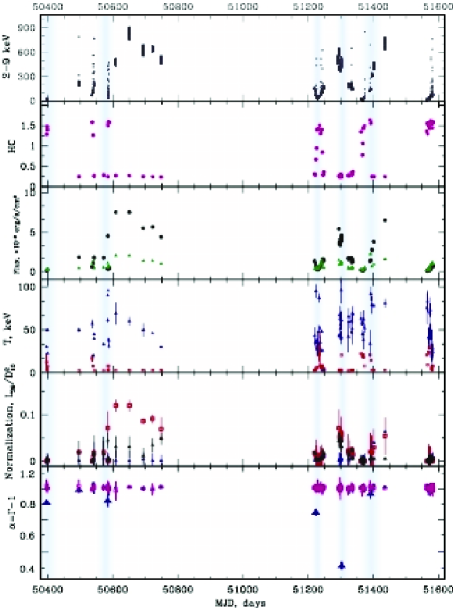
A complex behavior in a wide range of timescales, from seconds to years, is seen in the X-ray light curve of 4U 1705-44 (e.g., BO02). In this section we present the source variability from hours to days. In Figure 10 we show the source and model parameter evolution for the whole set of the observed spectra. Here, from the top to the bottom, we present the evolution of the count rate (in counts s-1) in the 29 keV range using the 16 s time resolution; of the hardness ratio HC [1050 keV]/[310 keV]; the model flux in the 310 keV and 1050 keV energy ranges (black and green points, respectively); (red) and (blue), the normalizations (red) and (blue) and for (red points) and (blue points) for sets corresponding to the time period from MJD 50,380 to MJD 51,650.
The light-curve intervals, corresponding to values of are shown by blue vertical strips. For these phases the electron temperatures is extremely high, while the ratio [1050 keV]/[310 keV] coefficient (HC) is arbitrary. It should be also noted that a hardness ratio is very sensitive to the choice of energy bands, as shown above (see Fig. 3).
All transitions of 4U 1705-44 (see third panel from the top) are related to a significant increase of the 310 keV flux and thus to a decrease of the HC coefficient. Furthermore, one can also see from Figure 10 how the electron temperature (blue points) drops from 95 keV to 5 keV during the hard-to-soft transitions (island-banana cycle). reaches its maximum at the UB branch (e.g. at MJD 51,301). In Fig. 7 we present the corresponding X-ray spectrum for this branch. Note that (red points) varies from 3 to 20 keV, indicating that the Comptonization component related to the innermost region of the transition layer, next to the NS surface, is much cooler than the TL outer part related to .
The normalizations (red points) and (blue points) are only weakly correlated with a coefficient HC (hardness ratio color) and count rate in the 2-9 keV band. In fact, for all spectral states the NS emission always dominates (see Figure 10). is variable (see Table 4). Furthermore, (or ) correlates with an increase of during X-ray flares (see panels 2-4 from the bottom of Fig. 10).
The fractional contribution of the Comptonized component associated with the seed disk photons (related to ) is always much weaker than that contributed by the NS seed photons (related to ). In fact, ). As we show in the bottom panel of Figure 10, and () only slightly vary with time around 1, except of for five points where drops from this level.
The seed photon temperatures and increase from 1.3 to 1.5 keV (for the ) and from 1.1 to 1.3 keV (for the ), respectively, during banana (soft state) island (hard state) transition. In order to evaluate the changes of a size of the seed photon region during the state transtion, we use the parameters obtained by the Comptb models (see Tables 3 and 4).
Furthermore, to evaluate the radius of the illuminated TL region by the seed photons that are finally Comptonized, we assume that the seed photon emission is a BB and the total Comptonized flux is where is an enchancement Comptonization factor (which is for the case (), see Sunyaev & Titarchuk (1980)). But is obtained as
| (2) |
and so an apparent radius of the seed photon area is defined by
| (3) |
where is the distance in kpc, is in keV, , is the Comptonized radiation and and are in erg cm-2 s-1. By considering the obtained using the RXTE spectra we find that and erg cm-2 s-1 in the BS and IS, respectively. We use a distance of 7.4 kpc, to obtain 5.6 km in the BS and 1.6 km in the IS state, respectively. We should emphasize that the above estimates of are related to the effective area of the seed photons which is is in our case. This area is definitely less than the NS area as it should be.
As for the BB component, in the BS and IS, the BB temperature , is about 0.6 keV. In turn, the BB radius is derived via , where is the BB luminosity and is the StefanBoltzmann constant. Assuming a distance of 7.4 kpc [see Haberl & Titarchuk (1995)] the BB region has an apparent radius , which varies from 5.5 km (in the IS) to 120 km (in the BS). These values are in agreement with the emission coming from the AD (see Fig. 4). Thus, the radii and have reasonable values that are compatible with the adopted model (see Sect. 3.2.1).
4 Discussion
4.1 Comparative analysis of spectral properties of Z- and Atoll sources
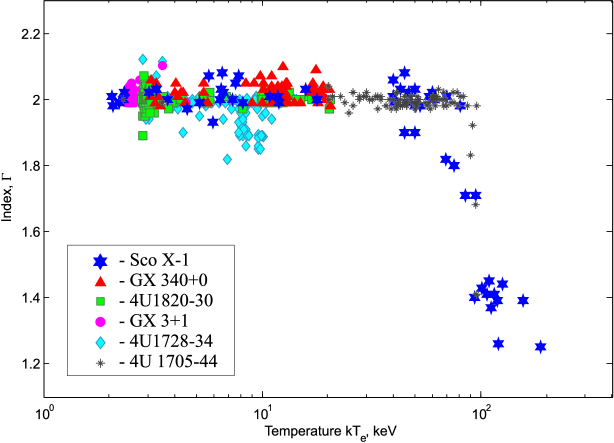
In this section we investigate how the X-ray spectral characteristics depend on variation relying on X-ray observations of 4U 1705-44 during its spectral evolution across the banana-island branches. In fact, we discover a new type of index behavior in 4U 1705-44 with respect to other known accreting NS sources. But variation of the index in 4U 1705-44 is quite similar to that observed in the prototypical Z-source Sco X-1. Thus, it is worth comparing 4U 1705-44 with other NS binaries and identifying differences and similarities of these sources (see Table 5). We make a comparison with six sources: Z-sources GX 340+0 (STF13), Sco X-1 (STS14), and atolls 4U 1705-44, 4U 1728-34 (ST11) , GX 3+1 (ST12) and 4U 1820-30 (TSF13), using the same double Comptb spectral model. We also confront the spectral evolution of 4U 1705-44 with that in XTE J1701-462 (NS source) since these two objects demonstrate spectral properties common to Z-sources and atolls depending on their X-ray luminosity.
4.1.1 Approximate Constancy of the Photon index versus the Electron Temperature
Z-sources GX 340+0 and Sco X-1, and , 4U 1728-34, 4U 1820-30, GX 3+1, show a quite similar behavior of versus at relatively low electron temperatures (3 keV 60 keV). The spectral index is almost constant at a value of approximately about 2. This index behavior can presumably indicate that, for these five sources, the accretted material releases its gravitational energy in the whole transition layer (TL) (see ST11, FT11, ST12, STF13, TSF13, and TSS14). According to the TSS14 model, this energy release is much higher in the TL than the cooling flow of the soft disk photons.
For Sco X-1 (TSS14) and 4U 1705-44 we find a wider range of than that in other atolls and Z-sources. Moreover, Sco X-1 gives us a possibility to identify the index sample when . It is worth noting that in this case the resulting luminosity is less than or equal to the critical one, whose value depends on the plasma (electron) temperature value. We find that substantially decreases when 85 keV (for 4U 1705-44 at UB) and 60 keV (for Sco X-1 at FB) (see Fig. 11). In 4U 1705-44 the photon index of the hard tail changes between 1.4 and 2 in upper banana state. A similar case behavior also takes place in Sco X-1 at FB (see TSS14), where the photon index varies between 1.3 and 2. when the electron temperature of the TL is high ( keV keV).
Note that only two sources, 4U 1705-44 and Sco X-1 demonstrate a decrease of at high The decreasing index phase of 4U 1705-44 begins at a higher electron temperature ( keV) than that in Sco X-1 ( keV). On the other hand, the upper limit of ranging is higher in Sco X-1 ( exceeds 100 keV) than that for 4U 1705-44 ( keV), which is possibly related to different X-ray luminosity levels (for atolls and Z-sources). However, 4U 1705-44 emits very close to a Z-source luminosity range as can be seen from Fig. 8.
We contrast our results for Z-sources and atolls with the spectral behavior of XTE J1701-462 (see Lin et al. 2009, hereafter LRH09). This source evolves from the atoll to Z-stage and finally reaches the Eddington luminosity. It is surprising that during the hard spectral state of XTE J1701-462 the photon index obtained by LHR09 is close to 2, while in the soft state the index increases up to 2.5. Note, that LRH09 investigate the spectrum in the 380 keV energy range only. It is possible that XTE J1701-462 is a unique NS object, which somehow differs from the standard atoll and Z-sources. In fact, LHR09 use various models to fit the data, and their models take into account the role of a weak Comptonization in the soft state and in the hard state.
5 CONCLUSIONS
We have investigated the spectral property correlations with mass accretion rate found in 4U 1705-44 using BeppoSAX and RXTE. We establish that the broadband energy spectra during all atolls can be described by the double Comptb additive model. These two Comptonized components are related to the different seed photon temperatures ( keV and keV). To improve the fit quality we also include an iron-line (Gaussian) component.
Spectral modeling 4U 1705-44 gives us a possibility to separate two distinct zones of the spectral formation along the atoll track. One is associated with the hard component while the other is related to the soft component. We find that the hard-to-soft spectral transition is driven by mass accretion rate . In fact, and (normalization parameters; see Eq. 1) of the Comptonized components are linerally related to mass accretion rate, . We establish an increase of (or ), which correlates with an increase of the electron temperature during X-ray flares (see second and third panels from the bottom of Fig. 10).
We establish the stability of both photon indices and around 2 during the ISs and BSs, which correspond to the range of the CC (TL) electron temperature of from 3 keV to 85 keV, while the decrease of is observed during the high electron temperature phase ( 85 keV). We explain the observed stability of within 2 using a model in which the energy deposition takes place in the TL and the energy release dominates the disk photon flux. This result is similar to what was previously found in the atolls 4U 1728-34, 4U 1820-30 and GX 3+1 and Z-source GX 340+0 through all spectral states and in Z-source Sco X-1 during HBNBbotFB. In addition to this index plauteau phase, of we also find the decreasing index detected over the UB (like that established in Sco X-1 at FB). We interpret this index decrease using the TSS14 model, where the energy release occurs only in some outer part of the TL. In fact, the radiation pressure halts the accretion flow in the innermost part of the TL, where the plasma temperature is effectively dictated by the NS surface photons. Thus, the electron (Klien-Nishina) cross-section increases with diminishing (see §4 of TSS14 for details).
During this decreasing index stage, the spectra of 4U 1705-44 and Sco X-1 exhibit an increase of of the Comptonization tail. Note that in BHs the index rises and then saturates when increases. These indices behave in a manner drastically different from that seen in the NS sources, Sco X-1 and 4U 1705.
We suggest that the robust nature of the parameter interdependencies resulting from the application of our model points to fundamental insights into the complex, and poorly understood, behavior or LMXBs.
Acknowledgments: We recognize a contribution of the referee who has thoroughly checked the paper context. N. Shaposhnikov also acknowledges the support of this research by the NASA under Grant NNX13AF39G.
References
- Barret & Olive (2002) Barret, D., Olive, J.-F. 2002, ApJ, 578, 391 (BO02)
- Boella et al. (1997) Boella G., Butler R. C., Perola G. C., et al., 1997, A&A, 122, 299
- Bradshaw et al. (1999) Bradshaw, C.F., Fomalont, E.B. & Geldzahler, B. J, 1999, ApJ, 512, L121
- Church et al. (2014) Church, M. J., Gibiec, A. & Bal̀uciǹska-Church, M. 2014 MNRAS, 438, 2784
- Christian & Swank (1997) Christian, D.J. & Swank, J. H. 1997, ApJS, 109, 177
- D’Ai et al. (2012) D’Ai, A. et al. 2012, A&A 543, A20
- D’Ai et al. (2010) D’Ai, A., Di Salvo, T., Ballantyne, D., et al. 2010, A&A, 516, id.A36
- D’Ai et al. (2007) D’Ai, A., Zycki, P., Di Salvo, T., Iaria, R., Lavagetto, G. & Robba, N. R. 2007, ApJ, 667, 411
- D’Amico et al. (2001) D’Amico, F., Heindl, W. A., Rothschild, R. E. et al. 2001, ApJ, 547, L147
- Di Salvo et al. (2015) Di Salvo, T., Iaria, R., A., Iaria, R. et al. 2015, MNRAS, 449, 2794
- Di Salvo et al. (2001) Di Salvo, T., D’Ai, A., Iaria, R. et al. 2009, MNRAS, 398, 2022
- Di Salvo et al. (2006) Di Salvo, T., Goldoni, P., Stella, L. et al. 2006, ApJ, 649, L91
- Di Salvo et al. (2005) Di Salvo, T., Iaria, R., Mendez, M., et al. 2005, ApJ, 623, L121
- Di Salvo et al. (2003) Di Salvo, T., Mendez, M. & van der Klis, M. 2003, A&A, 406, 177
- Di Salvo et al. (2001) Di Salvo, T., Mendez, M., van der Klis, M., Ford, E. & Robba, N.R. 2001 ApJ, 546, 1107
- Di Salvo et al. (2000) Di Salvo, T., Stella, L., Robba, N. R. et al. 2000, ApJ, 544, L119
- Egron et al. (2013) Egron, E., Di Salvo, T., Motta, et al. 2013, A&A, 550, 5
- Farinelli et al. (2009) Farinelli, R., Paizis, A., Landi, R., & Titarchuk, L. 2009, A&A, 498, 509
- Fender et al. (2000) Fender, R. P., & Hendry, M. A., 2000, MNRAS, 317, 1
- Fiocchi et al. (2007) Fiocchi, M., Bazzano, A. & Ubertini, P. et al. 2007, ApJ, 657, 448
- Ford et al. (2000) Ford, E.C. et al. 2000, ApJ, 537, 368
- Ford et al. (1998) Ford, E. C., van der Klis, M., & Kaaret, P. 1998, ApJ, 498, L41
- Frontera et al. (1997) Frontera, F., Costa, E., dal Fiume, D. et al. 1997, A&AS, 122, 357
- Gierlìnski & Done (2002) Gierlìnski, M. & Done, C. 2002, MNRAS, 331, L47
- Haberl & Titarchuk (1995) Haberl F. & Titarchuk L. 1995, A&A, 299, 414
- Hasinger et al. (1989) Hasinger, G., & van der Klis, M. 1989, A&A, 225, 79
- Hjellming et al. (1990) Hjellming, R. M., Stewart, R. T., White, G. L. 1990, ApJ, 365, 681
- Homan et al. (2010) Homan, J., van der Klis, M., Fridriksson, J. K., 2010, ApJ, 719, 201
- Jonker et al. (1998) Jonker, P. G., Wijnands, R., van der Klis, M. et al. 1998, ApJ, 499, L191
- Kuulkers & van der Klis (2000) Kuulkers, E & van der Klis, M. 2000, A&A, 356, L45
- Langmeier et al. (1987) Langmeier, A. A, Sztajno, M., Hasinger, G. et al. 1987, ApJ, 323, 902
- Levine et al. (1996) Levine, A. M., Bradt, H., Cui, W., et al. 1996, ApJ, 469, L33
- Lin et al. (2009) Lin, D., Remillard, R.A. & Homan, J. 2009, ApJ, 696, 1257 (LRH09)
- Lin et al. (2007) Lin, D., Homan, J., Remillard, R., & Wijnands, R. 2007, Astron. Tel., 1183
- Manzo et al. (1997) Manzo G., Giarrusso S., Santangelo A., et al. 1997, A&AS 122, 341
- Muno et al. (2002) Muno, M.P., Remillard, R. A. & Chakrabarty, D. 2002, ApJ, 568, L35
- Piraino et al. (2007) Piraino, S., Santangelo, A., Di Salvo, T., et al. 2007, A&A 471, L17
- Paizis et al. (2006) Paizis, A., Farinelli, R., Titarchuk, L. et al. 2006, A&A, 459, 187
- Parmar et al. (1997) Parmar, A., Martin, D. D. E., Bavdaz, M. et al. 1997, A&AS, 122, 309
- Sanna et al. (2010) Sanna, A., Mndez, M., Altamirano, D., Homan, J., et al. 2010, MNRAS, 408, 622
- Sztajno et al. (1985) Sztajno M., Langmeier, A., Frank, J. et al. 1985, IAU Circ No. 4111
- Seifina et al. (2014) Seifina, E., Titarchuk, L., & Shaposhnikov, N. 2013, ApJ, 789, 57 (STS14)
- Seifina et al. (2013) Seifina, E., Titarchuk, L., & Frontera, F. 2013, ApJ, 766, 63 (STF13)
- Seifina & Titarchuk (2012) Seifina, E. & Titarchuk, L. 2012, ApJ, 747, 99 (ST12)
- Seifina & Titarchuk (2011) Seifina, E. & Titarchuk, L. 2011, ApJ, 738, 128 (ST11)
- Shakura & Sunyaev (1973) Shakura, N.I., & Sunyaev, R.A. 1973, A&A, 24, 337
- Shaposhnikov & Titarchuk (2004) Shaposhnikov, N. & Titarchuk L. 2004, ApJ, 606, L57
- Smale et al. (1997) Smale, A. P., Zhang, W., & White, N. E. 1997, ApJL, 483, L119
- Strohmayer (1998) Strohmayer, T. 1998, AIP Conference Proceedings, Volume 431, pp. 397-400 in American Institute of Physics Conference Series, (astro-ph/9802022v1)
- Sunyaev & Titarchuk (1980) Sunyaev, R.A. & Titarchuk, L. 1980, A&A, 86, 121
- Titarchuk et al. (2014) Titarchuk, L., Seifina, E. & Shrader, Ch. 2014, ApJ, 798, 98 (TSS14)
- Titarchuk et al. (2013) Titarchuk, L., Seifina, E., & Frontera, F. 2013, ApJ, 767, 160 (TSF13)
- Titarchuk & Osherovich (1999) Titarchuk, L.G. & Osherovich, V.A. 1999, ApJ, 518, L95
- Titarchuk et al. (1998) Titarchuk, L., Lapidus, I.I. & Muslimov, A. 1998, ApJ, 419, 315
- van Paradijs (1978) van Paradijs, J. 1978, Nature, 274, 650
- van Straaten et al. (2000) van Straaten, S., Ford, E., van der Klis, M., Mndez, M. & Kaaret, Ph. 2000, ApJ, 540, 1049
- Zhang et al. (2006) Zhang, C.M. et al. 2006, MNRAS, 366, 1373
| Number of Set | Dates, MJD | RXTE Proposal ID | Dates UT |
|---|---|---|---|
| R1 | 50,539-50,542 | 20073 (1) | 1997 Apr. 14 1997 |
| 50,495-50,748 | 20074 (1), (2) | 1997 Feb. 16Oct. 27 | |
| 50,398-50,587 | 20161 (1) | 1996 Nov. 111997 May 19, 1997 | |
| R2 | 51,290-51,583 | 40034 (1), (3) | 1999 Apr. 222000 Feb. 2 |
| R3 | 51,219-51,247 | 40051 (1), (2) | 1999 Feb. 10 Mar. 10 |
| Source state | IS | IS | LB | LB | UB | |
|---|---|---|---|---|---|---|
| Satellite | RXTE | RXTE | RXTE | |||
| Model | Parameter | 21292002 | 40034-01-07-02G | 21292001 | 40034-01-02-09 | 40034-01-02-06 |
| wabs | NH ( cm-2) | 2.360.07 | 4.60.1 | 1.810.02 | 4.650.02 | 4.820.07 |
| bbody | kTBB (keV) | 0.500.03 | 0.50.1 | 0.620.03 | 0.610.03 | 0.590.01 |
| N | 3.80.3 | 7.80.3 | 2.70.4 | 100.70.9 | 14.90.2 | |
| Comptb | 1.000.01 | 1.060.04 | 0.990.03 | 1.020.04 | 1.050.06 | |
| kTs (keV) | 1.310.08 | 1.300.02 | 1.360.06 | 1.280.09 | 1.300.07 | |
| 0.920.06 | 0.950.02 | -0.030.01 | -0.240.09 | -0.220.02 | ||
| kTe (keV) | 20.660.08 | 21.510.09 | 2.780.08 | 2.860.09 | 2.780.03 | |
| N | 1.080.03 | 0.130.02 | 5.560.02 | 6.620.01 | 7.160.07 | |
| Power law | 1.880.05 | 1.50.4 | 2.540.05 | 3.970.05 | 1.900.07 | |
| N | 2.950.02 | 2.130.01 | 1.260.02 | 1.420.01 | 1.160.07 | |
| Gaussian | Eline (keV) | 6.450.08 | 6.480.09 | 6.800.07 | 6.810.05 | 6.900.07 |
| (keV) | 0.350.04 | 0.400.06 | 0.390.07 | 0.410.03 | 0.410.05 | |
| N | 1.080.03 | 1.130.02 | 0.760.02 | 0.720.01 | 0.660.07 | |
| (dof) | 3.28 (193) | 1.78 (79) | 2.3 (200) | 1.34 (77) | 1.16 (77) | |
| wabs | NH ( cm-2) | 2.160.04 | 2.30.1 | 2.430.03 | 4.30.1 | 4.40.1 |
| bbody | kTBB (keV) | 0.540.07 | 0.600.04 | 0.560.03 | 0.600.05 | 0.600.04 |
| N | 0.430.01 | 0.150.03 | 4.490.05 | 3.120.02 | 3.160.05 | |
| Comptb1 | 1.000.04 | 0.980.02 | 0.990.07 | 1.010.02 | 1.000.03 | |
| kTs1 (keV) | 1.420.03 | 1.50.1 | 1.750.02 | 1.500.03 | 1.500.04 | |
| 0.930.06 | 2.0††† | -0.040.01 | -4.020.07 | 0.40.2 | ||
| kT (keV) | 18.90.02 | 9.220.09 | 2.470.04 | 2.710.09 | 20.40.3 | |
| N | 1.080.02 | 0.040.02 | 5.280.06 | 5.540.08 | 4.580.04 | |
| Comptb2 | 1.010.03 | 1.010.02 | 1.000.03 | 1.010.01 | 0.410.07 | |
| kTs2 (keV) | 1.320.1 | 1.270.03 | 1.290.05 | 1.260.02 | 1.090.03 | |
| -0.030.01 | 0.50.2 | -1.04 0.02 | -0.220.02 | -0.250.03 | ||
| kT (keV) | 511 | 835 | 2.040.08 | 645 | 967 | |
| N | 0.200.07 | 0.110.08 | 0.240.05 | 10.120.06 | 0.480.01 | |
| Gaussian | Eline (keV) | 6.510.08 | 6.400.05 | 6.950.04 | 6.570.03 | 6.670.03 |
| (keV) | 0.600.04 | 0.560.07 | 0.790.08 | 0.640.07 | 0.690.07 | |
| N | 1.070.09 | 1.090.08 | 0.680.09 | 0.950.02 | 1.150.04 | |
| (dof) | 1.02 (296) | 0.76 (86) | 1.07 (295) | 1.02 (86) | 1.05 (86) |
† Errors are given at the 90% confidence level. †† The normalization parameters of blackbody and Comptb components are in units of , where is the soft photon luminosity in units of 1037 erg s-1, is the distance to the source in units of 10 kpc, the Gaussian component is in units of in line, component is in units of keV-1 cm-2 s-1 at 1 keV; ††† when parameter , it is fixed to a value 2.0 for the model Comptb (see comments in the text).
| Observational | MJD, | N | Eline, | |||||||||||
|---|---|---|---|---|---|---|---|---|---|---|---|---|---|---|
| ID | (day) | (keV) | (keV) | (keV) | (keV) | (dof) | ||||||||
| 20073-04-01-00 | 50539.56 | 0.99(1) | 7.72(8) | 2.00†† | 0.91(6) | 0.49(7) | 1.31(3) | 1.04(3) | 20(1) | 1.7(1) | 0.59(4) | 6.97(4) | 0.28(8) | 1.45(87) |
| 20073-04-01-01 | 50571.69 | 1.00(2) | 2.48(9) | 2.00†† | 1.92(3) | 1.5(1) | 1.26(2) | 1.01(2) | 33(2) | 1.77(4) | 0.58(3) | 6.96(2) | 0.24(9) | 0.91(87) |
| 20073-04-01-02 | 50542.32 | 1.03(1) | 2.5(1) | 2.00†† | 1.51(2) | 1.5(1) | 1.23(4) | 1.00(6) | 40(1) | -0.66(2) | 0.42(4) | 6.97(3) | 0.25(4) | 0.79(87) |
| 20073-04-01-03 | 50542.49 | 1.01(1) | 2.44(9) | 2.00†† | 1.86(1) | 1.6(2) | 1.28(2) | 0.99(1) | 45(3) | 0.43(5) | 7.4(1) | 6.94(4) | 0.29(1) | 0.83(87) |
| 20074-02-01-00 | 50495.75 | 1.02(4) | 2.38(7) | 2.00†† | 1.93(5) | 1.8(1) | 1.19(3) | 0.97(3) | 50(1) | 2.00†† | 0.01(1) | 6.95(7) | 0.31(2) | 0.87(86) |
| 20074-02-02-00 | 50536.55 | 0.97(1) | 16.9(2) | 2.00†† | 0.08(2) | 3(1) | 1.29(4) | 0.98(2) | 57(2) | 2.00†† | 0.09(2) | 6.95(4) | 5.1(9) | 0.75(88) |
| 20074-02-03-00 | 50608.80 | 0.96(6) | 2.52(4) | 0.28(3) | 11.9(2) | 3.0(1) | 1.25(2) | 1.00(1) | 69(5) | -0.63(2) | 8.4(7) | 6.97(3) | 8(1) | 0.92(88) |
| 20074-02-04-00 | 50650.48 | 1.01(1) | 2.51(4) | 0.24(2) | 11.9(4) | 3.05(2) | 1.26(6) | 1.01(1) | 60(2) | -0.64(3) | 7.9(1) | 6.95(4) | 8.2(3) | 0.91(88) |
| 20074-02-05-00 | 50693.16 | 0.99(1) | 2.54(3) | 0.14(5) | 8.6(3) | 1.11(9) | 1.29(2) | 0.99(2) | 51(3) | -0.61(4) | 0.39(1) | 6.74(5) | 6.4(2) | 0.81(88) |
| 20074-02-06-00 | 50721.58 | 0.98(4) | 2.53(5) | 0.11(6) | 9.1(2) | 3.44(8) | 1.17(3) | 0.98(4) | 46(4) | -0.13(2) | 0.13(3) | 6.65(3) | 7(1) | 0.66(88) |
| 20074-02-07-00 | 50748.19 | 1.01(1) | 2.59(6) | 0.07(4) | 6.9(5) | 4.90(7) | 1.31(4) | 1.01(2) | 30(1) | 2.00†† | 0.1(1) | 6.55(4) | 6.2(4) | 0.76(88) |
| 20161-01-01-002 | 50398.35 | 0.99(3) | 3.12(6) | -2.3(8) | 0.20(1) | 0.39(6) | 1.28(2) | 0.99(1) | 50(2) | 0.43(2) | 0.34(2) | 6.40(4) | 2.1(3) | 1.50(89) |
| 20161-01-01-01 | 50396.35 | 1.03(4) | 12.2(4) | -1.9(6) | 8(1) | 0.25(4) | 1.26(3) | 1.02(4) | 30(1) | 4.43(2) | 0.13(1) | 6.41(3) | 1.2(1) | 0.96(92) |
| 20161-01-01-03 | 50398.95 | 0.99(1) | 7.4(2) | -1.8(5) | 0.09(2) | 0.26(5) | 1.27(4) | 1.01(2) | 22.8(3) | 1.25(6) | 0.30(2) | 6.42(2) | 2.6(2) | 1.27(89) |
| 20161-01-02-00 | 50584.46 | 1.03(3) | 8.0(1) | 2.00†† | 0.20(1) | 0.301(5) | 1.12(2) | 0.83(6) | 90(2) | 0.66(6) | 0.86(1) | 6.40(5) | 1.9(1) | 1.17(86) |
| 20161-01-02-01 | 50585.46 | 1.00(1) | 8.1(2) | -1.9(8) | 0.10(3) | 0.41(2) | 1.27(3) | 0.98(5) | 95(8) | 0.29(1) | 0.59(3) | 6.41(9) | 2.8(3) | 1.26(90) |
| 20161-01-02-02 | 50586.47 | 1.00(4) | 8.2(2) | -1.8(6) | 0.12(3) | 0.41(2) | 1.28(4) | 0.97(4) | 39(2) | 1.29(1) | 0.58(1) | 6.41(2) | 3.6(2) | 1.26(90) |
| 20161-01-02-03 | 50587.35 | 0.97(2) | 3.2(1) | -2.1(7) | 0.08(1) | 0.37(1) | 1.31(3) | 1.00(1) | 31(2) | 2.00†† | 0.63(2) | 6.39(5) | 2.9(2) | 1.25(89) |
| 20161-01-02-04 | 50587.55 | 1.00(1) | 3.7(2) | -1.8(5) | 0.07(2) | 0.38(3) | 1.26(4) | 0.98(6) | 37(2) | 2.00†† | 0.67(5) | 6.43(3) | 1.5(1) | 0.84(89) |
| 40034-01-01-00 | 50584.46 | 0.99(2) | 2.9(3) | -0.26(3) | 7.12(7) | 4.49(9) | 1.29(2) | 1.01(2) | 61(4) | -0.16(1) | 0.10(2) | 6.45(7) | 1.7(2) | 0.85(87) |
| 40034-01-01-01 | 51294.33 | 1.00(2) | 2.50(6) | 0.45(1) | 7.10(8) | 4.43(7) | 1.19(3) | 0.98(1) | 43(1) | -0.15(1) | 0.10(1) | 6.76(5) | 0.11(1) | 1.15(86) |
| 40034-01-01-02 | 51295.59 | 0.97(1) | 3.10(1) | -0.17(1) | 5.19(1) | 4.49(9) | 1.27(4) | 1.00(1) | 67(2) | -2.0(1) | 0.20(5) | 6.52(5) | 0.35(1) | 1.23(85) |
| 40034-01-01-03 | 51297.53 | 1.00(5) | 2.14(2) | -0.18(2) | 5.40(2) | 4.44(5) | 1.25(2) | 1.00(2) | 63(2) | -1.95(3) | 0.10(1) | 6.61(5) | 0.54(3) | 1.12(85) |
| 40034-01-01-04 | 51297.47 | 1.02(6) | 2.43(1) | -0.28(1) | 5.13(2) | 4.47(4) | 1.28(1) | 1.02(1) | 68(4) | -0.16(2) | 0.60(1) | 6.40(4) | 0.25(2) | 1.18(86) |
| 40034-01-02-00 | 51298.15 | 1.01(1) | 3.04(3) | -0.25(3) | 4.54(2) | 4.48(5) | 1.26(3) | 0.99(2) | 51(3) | -0.14(1) | 0.65(3) | 6.59(5) | 0.14(1) | 1.19(86) |
| 40034-01-02-01 | 51298.69 | 0.96(6) | 2.69(1) | -0.27(1) | 5.86(2) | 4.46(6) | 1.29(3) | 1.01(1) | 63(2) | -0.18(2) | 0.63(1) | 6.60(3) | 0.58(1) | 1.02(86) |
| 40034-01-02-02 | 51298.76 | 1.00(1) | 3.04(1) | -0.27(1) | 5.27(3) | 4.43(5) | 1.25(2) | 0.98(2) | 51(3) | -0.13(1) | 0.67(1) | 6.44(5) | 0.19(1) | 1.15(86) |
| 40034-01-02-03 | 51298.83 | 0.99(3) | 2.72(2) | -0.26(3) | 5.90(3) | 4.45(3) | 1.32(4) | 1.03(3) | 64(5) | -0.16(2) | 0.62(1) | 6.71(3) | 0.53(3) | 0.95(86) |
| 40034-01-02-04 | 51298.89 | 1.02(2) | 2.97(1) | -0.29(2) | 5.41(3) | 4.44(5) | 1.29(1) | 0.99(1) | 56(7) | -0.15(2) | 0.61(3) | 6.48(5) | 0.29(2) | 1.11(86) |
| 40034-01-02-05 | 51301.53 | 1.00(1) | 2.18(4) | -0.28(1) | 5.73(1) | 4.45(2) | 1.28(3) | 0.98(2) | 41(3) | -0.16(2) | 0.65(1) | 6.55(8) | 0.34(2) | 1.23(86) |
| 40034-01-02-06 | 51301.69 | 1.00(3) | 20.4(3) | 0.4(2) | 4.58(4) | 3.16(5) | 1.09(3) | 0.41(7) | 96(7) | -0.25(3) | 0.48(1) | 6.67(3) | 1.15(4) | 1.05(86) |
| 40034-01-02-07 | 51301.69 | 1.00(1) | 2.48(5) | 0.23(6) | 6.13(1) | 3.04(6) | 1.29(2) | 1.00(1) | 61(3) | -0.15(2) | 0.42(3) | 6.56(5) | 1.19(5) | 1.00(86) |
| 40034-01-02-08 | 51301.75 | 1.01(2) | 2.52(3) | 0.17(5) | 5.95(7) | 3.05(5) | 1.28(3) | 1.02(2) | 43(1) | -0.18(1) | 0.41(1) | 6.66(7) | 1.14(3) | 1.06(86) |
| 40034-01-02-09 | 51301.83 | 1.01(2) | 2.71(9) | -4.02(7) | 5.54(8) | 3.12(2) | 1.26(2) | 1.01(1) | 64(5) | -0.22(2) | 0.12(6) | 6.57(3) | 0.95(2) | 1.02(86) |
| 40034-01-03-00 | 51324.06 | 0.97(3) | 2.38(3) | 0.17(7) | 2.24(7) | 1.44(6) | 1.28(4) | 0.99(1) | 42(7) | -0.26(2) | 0.31(3) | 6.66(5) | 0.40(1) | 1.00(86) |
| 40034-01-03-01 | 51324.20 | 1.00(1) | 2.41(7) | 0.22(9) | 2.03(6) | 1.45(3) | 1.29(1) | 1.00(1) | 65(4) | -0.22(1) | 0.34(1) | 6.40(5) | 0.44(2) | 0.95(86) |
| 40034-01-03-02 | 51325.17 | 0.99(2) | 2.34(5) | 0.43(8) | 1.88(5) | 1.46(5) | 1.27(3) | 0.97(4) | 59(3) | -0.21(2) | 0.32(1) | 6.40(7) | 0.42(1) | 0.97(86) |
| 40034-01-04-00 | 51362.67 | 1.00(1) | 22.6(3) | 2.00†† | 0.08(2) | 0.45(2) | 1.30(2) | 1.01(1) | 63(4) | 0.26(8) | 0.3041) | 6.45(3) | 2.8(6) | 1.14(86) |
| 40034-01-04-01 | 51366.14 | 0.96(4) | 20.0(9) | 2.00†† | 0.04(2) | 0.04(2) | 1.28(3) | 0.99(2) | 58(1) | -0.42(9) | 0.32(1) | 6.48(5) | 1.3(4) | 1.21(86) |
| 40034-01-04-02 | 51367.14 | 1.00(1) | 19.0(8) | 2.00†† | 0.01(1) | 0.01(1) | 1.29(5) | 1.01(2) | 45(2) | -0.43(9) | 0.34(3) | 6.40(5) | 1.1(2) | 1.22(86) |
| 40034-01-04-03 | 51369.20 | 1.01(2) | 21(1) | 2.00†† | 0.05(2) | 0.02(1) | 1.30(4) | 1.00(1) | 38(4) | -0.42(9) | 0.37(2) | 6.41(7) | 1.2(1) | 1.24(86) |
| 40034-01-04-04 | 51370.20 | 1.02(1) | 18.0(9) | 2.00†† | 0.02(1) | 0.01(1) | 1.27(3) | 0.98(3) | 62(4) | -0.4(1) | 0.38(5) | 6.49(3) | 1.2(1) | 1.23(86) |
| 40034-01-04-05 | 51373.46 | 0.98(2) | 8.0(5) | 2.00†† | 0.03(1) | 0.01(1) | 1.31(4) | 1.00(2) | 52(3) | -0.51(6) | 0.62(2) | 6.40(6) | 1.3(2) | 1.17(86) |
| 40034-01-05-00 | 51333.24 | 1.01(3) | 3.0(1) | -0.23(2) | 2.51(7) | 2.40(1) | 1.27(3) | 1.01(1) | 48(1) | -0.14(6) | 0.63(4) | 6.53(5) | 0.16(2) | 1.14(86) |
| 40034-01-05-01 | 51334.42 | 1.00(2) | 3.2(1) | -0.22(1) | 2.28(6) | 2.58(1) | 1.24(2) | 0.99(2) | 46(3) | -0.14(6) | 0.61(5) | 6.60(5) | 0.15(1) | 0.88(86) |
| 40034-01-05-02 | 51335.23 | 0.97(1) | 3.0(4) | -0.26(1) | 1.89(2) | 2.30(1) | 1.29(3) | 1.01(2) | 51(7) | -0.14(6) | 0.62(2) | 6.61(5) | 5.1(4) | 0.76(86) |
| 40034-01-05-03 | 51336.09 | 1.02(2) | 2.51(6) | -0.08(2) | 1.43(3) | 0.58(1) | 1.28(4) | 1.00(1) | 69(3) | -0.37(6) | 0.85(3) | 6.50(3) | 4.9(7) | 0.79(86) |
| 40034-01-05-04 | 51337.46 | 1.00(1) | 2.60(5) | -0.12(3) | 1.43(1) | 0.57(1) | 1.26(2) | 0.98(4) | 68.0 | -0.36(6) | 0.83(1) | 6.53(6) | 3.8(4) | 0.84(86) |
| 40034-01-05-05 | 51390.13 | 1.01(4) | 20.7(5) | 2.00†† | 2.00(8) | 0.35(4) | 1.27(3) | 0.97(6) | 34(6) | -2.1(9) | 0.45(3) | 6.40(5) | 4.7(4) | 1.07(86) |
| 40034-01-05-06 | 51333.05 | 0.99(1) | 2.67(6) | -0.17(3) | 1.44(1) | 0.58(1) | 1.25(4) | 1.00(1) | 60(4) | -0.36(6) | 0.65(1) | 6.51(4) | 2.1(3) | 0.89(86) |
| 40034-01-05-07 | 51392.27 | 1.02(2) | 14.1(9) | 2.00†† | 2.00(8) | 0.78(4) | 1.11(2) | 0.92(5) | 92(3) | -1.10(9) | 0.37(3) | 6.56(3) | 0.30(2) | 1.13(86) |
| 40034-01-06-00 | 51396.23 | 1.00(1) | 2.91(5) | 2.00†† | 1.90(7) | 0.58(1) | 1.27(2) | 0.98(4) | 79(4) | -2.00(6) | 3.17(1) | 6.67(5) | 4.3(4) | 1.08(86) |
| 40034-01-06-01 | 51436.15 | 0.99(1) | 2.59(2) | 2.00†† | 5.42(8) | 0.54(5) | 1.29(3) | 1.01(1) | 81(2) | -2.1(2) | 6.32(1) | 6.95(7) | 9.0(4) | 1.08(86) |
| 40034-01-06-09 | 51401.39 | 1.00(3) | 2.76(4) | 2.00†† | 2.95(8) | 0.56(3) | 1.30(1) | 1.02(2) | 78(5) | -2.2(3) | 3.99(8) | 6.68(6) | 5.2(4) | 1.18(86) |
| 40034-01-07-00 | 51564.13 | 1.03(1) | 20.7(7) | 2.00†† | 0.06(1) | 0.18(1) | 1.28(2) | 0.99(1) | 76(3) | 0.2(1) | 0.11(3) | 6.43(5) | 1.3(5) | 1.06(86) |
| 40034-01-07-01 | 51565.33 | 1.00(1) | 20.7(5) | 2.00†† | 0.08(1) | 0.16(1) | 1.29(2) | 1.02(2) | 75(7) | 0.2(1) | 7(1) | 6.41(3) | 1.1(3) | 1.07(86) |
| 40034-01-07-02G | 51566.26 | 0.98(2) | 9.22(9) | 2.00†† | 0.04(2) | 0.15(3) | 1.27(3) | 1.01(2) | 83(5) | 0.5(2) | 0.11(8) | 6.40(5) | 1.0(1) | 0.76(86) |
| 40034-01-07-03 | 51573.72 | 0.99(3) | 31.7(5) | 2.00†† | 0.04(1) | 0.28(6) | 1.26(4) | 0.98(1) | 70(7) | 0.71(7) | 0.26(9) | 6.40(5) | 1.2(2) | 1.09(86) |
| 40034-01-07-04 | 51569.32 | 1.00(1) | 23.7(8) | 2.00†† | 0.12(7) | 0.27(5) | 1.28(2) | 0.97(5) | 41(4) | 0.57(9) | 0.33(8) | 6.42(6) | 1.3(1) | 1.01(86) |
| 40034-01-07-05 | 51574.65 | 0.97(4) | 29.7(9) | 2.00†† | 0.16(6) | 0.32(3) | 1.27(3) | 0.99(4) | 73(3) | 0.69(7) | 0.44(9) | 6.40(3) | 1.4(2) | 1.07(86) |
| 40034-01-08-00 | 51572.65 | 1.00(2) | 29(1) | 2.00†† | 0.07(6) | 0.23(5) | 1.29(2) | 1.00(1) | 52(7) | 0.71(8) | 0.20(9) | 6.43(5) | 1.1(1) | 1.09(86) |
| 40034-01-08-01 | 51575.90 | 1.00(1) | 23.1(1) | 2.00†† | 0.23(5) | 0.43(6) | 1.27(4) | 0.99(5) | 49(3) | 0.90(5) | 0.63(9) | 6.41(5) | 1.8(5) | 0.79(86) |
| 40034-01-08-02 | 51577.03 | 0.99(2) | 23.2(9) | 2.00†† | 0.24(6) | 0.45(5) | 1.26(3) | 0.98(6) | 44(2) | 0.82(5) | 0.65(7) | 6.44(6) | 3.2(1) | 1.15(86) |
| 40034-01-09-00 | 51581.76 | 1.04(1) | 8.0(3) | 2.00†† | 0.11(1) | 0.46(1) | 1.11(2) | 0.96(3) | 25(4) | 1.06(7) | 1.01(2) | 6.40(3) | 6.1(3) | 0.88(86) |
| 40034-01-09-01 | 51580.84 | 1.00(1) | 3.0(3) | 2.00†† | 0.21(4) | 0.47(3) | 1.30(3) | 1.01(2) | 21(5) | 1.30(8) | 0.89(1) | 6.41(5) | 3.2(2) | 0.85(86) |
| 40034-01-09-02 | 51578.78 | 0.99(2) | 5.0(2) | 2.00†† | 0.52(2) | 0.46(4) | 1.29(4) | 1.00(1) | 20(3) | 1.14(9) | 0.76(1) | 6.42(6) | 3.1(1) | 1.04(86) |
| 40034-01-09-03 | 51583.10 | 1.00(3) | 8.0(4) | 2.00†† | 0.10(1) | 0.52(3) | 1.27(1) | 0.99(1) | 24(2) | 1.29(8) | 0.99(3) | 6.40(2) | 6.3(3) | 1.16(86) |
| 40034-01-09-04 | 51580.04 | 1.02(1) | 7.0(3) | 2.00†† | 0.20(3) | 0.43(3) | 1.29(1) | 1.00(2) | 32(7) | 1.09(9) | 0.84(7) | 6.41(3) | 4.7(2) | 0.94(86) |
| 40034-01-09-05 | 51581.68 | 0.99(3) | 3.0(4) | 2.00†† | 0.10(1) | 0.37(4) | 1.31(2) | 1.01(1) | 29(3) | 0.65(8) | 1.27(2) | 6.40(2) | 0.13(1) | 1.18(86) |
| 40034-01-09-07 | 51581.69 | 1.00(1) | 4.0(2) | 2.00†† | 0.45(1) | 0.46(3) | 1.30(1) | 1.02(2) | 26(4) | 1.21(9) | 0.96(1) | 6.41(2) | 5.4(2) | 1.18(86) |
| 40034-01-09-08 | 51583.17 | 0.96(4) | 8.0(3) | 2.00†† | 0.54(2) | 0.45(3) | 1.29(3) | 1.01(1) | 28(2) | 1.16(8) | 1.02(1) | 6.43(6) | 4.3(3) | 1.06(86) |
| 40051-03-01-00 | 51219.60 | 1.00(1) | 2.7(1) | 0.11(1) | 1.82(1) | 1.92(1) | 1.30(2) | 1.00(1) | 43(4) | -0.16(8) | 0.19(2) | 6.64(2) | 0.11(1) | 0.99(86) |
| 40051-03-02-00 | 51221.60 | 1.01(2) | 2.7(2) | 2.00†† | 1.56(2) | 1.54(1) | 1.29(4) | 1.01(1) | 35(2) | -0.13(8) | 0.18(2) | 6.51(6) | 0.11(1) | 1.12(86) |
| 40051-03-03-00 | 51223.53 | 0.99(1) | 4.11(9) | 0.41(8) | 0.65(8) | 0.67(2) | 1.08(2) | 0.68(3) | 95(3) | -0.14(8) | 0.46(9) | 6.40(3) | 0.18(1) | 1.17(86) |
| 40051-03-04-00 | 51225.46 | 0.97(2) | 6.2(1) | 1.27(9) | 0.40(6) | 0.38(2) | 1.29(2) | 0.98(2) | 37(1) | -0.17(8) | 0.46(6) | 6.41(2) | 0.12(1) | 1.03(86) |
| 40051-03-05-00 | 51227.34 | 1.00(1) | 29.9(4) | 2.00†† | 0.30(4) | 0.34(2) | 1.28(1) | 1.00(1) | 28(3) | -0.16(8) | 0.19(5) | 6.40(6) | 4.8(2) | 1.04(86) |
| 40051-03-06-00 | 51229.59 | 1.02(4) | 27.6(2) | 2.00†† | 0.27(1) | 0.29(1) | 1.30(4) | 1.01(1) | 34(5) | -0.12(8) | 0.15(4) | 6.45(2) | 2.3(3) | 0.95(86) |
| 40051-03-07-00 | 51231.46 | 1.00(1) | 30(2) | 2.00†† | 0.36(3) | 0.33(1) | 1.29(3) | 1.00(2) | 48(3) | -0.16(8) | 0.24(3) | 6.40(2) | 5.6(4) | 0.93(86) |
| 40051-03-08-00 | 51233.27 | 0.99(3) | 21(3) | 2.00†† | 0.36(2) | 0.37(2) | 1.27(2) | 0.98(2) | 87(2) | -0.09(4) | 0.31(3) | 6.47(3) | 6.1(3) | 1.06(86) |
| 40051-03-09-00 | 51235.52 | 1.01(2) | 26(2) | 2.00†† | 0.53(3) | 0.41(5) | 1.28(4) | 1.00(1) | 52(1) | 2.00†† | 0.35(5) | 6.40(2) | 6.2(3) | 1.11(86) |
| 40051-03-10-00 | 51237.52 | 1.00(1) | 8.0(3) | 2.00†† | 0.60(5) | 0.50(2) | 1.29(2) | 1.00(4) | 35(3) | 0.21(3) | 0.46(4) | 6.42(6) | 9.5(4) | 0.89(86) |
| 40051-03-11-00 | 51239.40 | 1.02(3) | 6.70(4) | 2.00†† | 0.71(4) | 0.53(3) | 1.27(3) | 1.02(2) | 26(1) | 0.34(3) | 0.78(6) | 6.48(2) | 0.16(1) | 0.97(86) |
| 40051-03-12-00 | 51241.86 | 0.99(1) | 8.1(2) | 2.00†† | 0.58(6) | 0.58(2) | 1.29(1) | 1.01(1) | 48(2) | 0.54(6) | 1.07(4) | 6.40(3) | 0.22(1) | 1.02(86) |
| 40051-03-13-00 | 51243.93 | 0.97(3) | 5.0(3) | -0.67(3) | 0.78(4) | 0.83(2) | 1.28(2) | 0.98(4) | 26(1) | 0.96(4) | 1.13(3) | 6.59(2) | 0.32(3) | 1.07(86) |
| 40051-03-14-00 | 51245.93 | 1.00(1) | 3.10(7) | 0.90(8) | 1.13(2) | 2.03(4) | 1.30(1) | 1.00(1) | 2.32(7) | -0.20(3) | 1.20(7) | 6.61(2) | 0.27(2) | 1.11(86) |
| 40051-03-15-00 | 51247.85 | 1.01(2) | 3.60(9) | 0.43(6) | 1.17(3) | 1.63(2) | 1.29(3) | 0.99(2) | 3.49(8) | -0.45(5) | 0.93(6) | 6.58(5) | 0.25(1) | 1.06(86) |
† The spectral model is ; color temperature of the bbody component is fixed at 0.6 keV (see comments in the text); †† parameter is fixed at 2.0 (see comments in the text), ††† Normalization parameters of blackbody and Comptb components are in units of , where is the source luminosity in units of 1037 erg/s, is the distance to the source in units of 10 kpc and Gaussian component is in units of in line. †††† varies from 1.3 keV to 1.5 keV for the island to banana state transition while it is concentrated about 1.5 keV (see Fig. 9) for most of the spectra spectra, of Gaussian component is fixed to a value 0.7 keV (see comments in the text), was free to vary within the range of (2 – 4) cm-2 (see comments in the text).
| Source | Alternative | Class6 | Distance, | Presence of | , | |||
|---|---|---|---|---|---|---|---|---|
| Name | Name | (kpc) | kHz QPO | (keV) | (keV) | |||
| Sco X-1 | V818 Sco | Z, Sp, B | 2.8 (7) | +(8) | 3-180 | 0.3-3.4 | 0.4-1.8 | 0.08-1 |
| 4U 1642-45 | GX 340+0 | Z, Sp, B | 10.5 (9) | +(12) | 3-21 | 0.08-0.2 | 1.1-1.5 | 0.01-0.5 |
| 4U 1744-26 | GX 3+1 | Atoll, Sp, B | 4.5(10) | none(13) | 2.3-4.5 | 0.04-0.15 | 1.16-1.7 | 0.2-0.9 |
| 4U 1728-34 | GX 354-0 | Atoll, Su, D | 4.2-6.4(11) | +(14) | 2.5-15 | 0.02-0.09 | 1.3 | 0.5-1 |
| 4U 1820-30 | … | Atoll, Su, B | 5.8-8 (15) | +(16) | 2.9-21 | 0.02-0.14 | 1.1-1.7 | 0.2-1 |
| XTE J1701-462 | … | Atoll+Z, Su, D | 8.8(17) | +(18) | … | … | 1-2.7 | … |
| 4U 1705-44 | … | Atoll, Sp, B | 7.4 (19) | +(20) | 2.7-100 | 0.01-0.08 | 1.1-1.5 | 0.2-1 |
References: (1) STF13; (2) ST12; (3) ST11; (4) TSF13; (5) LRH109; (6) Classification of the system in the various schemes (see text): Sp = supercritical, Su = subcritical, B = bulge, D = disk; (7) Bradshaw et al. (1999); (8) Zhang et al. (2006); (9) Fender & Henry (2000), Ford et al. (1998), Christian & Swank (1997); (10) Kuulkers & van der Klis (2000), Ford et al. (2000); (11) van Paradijs (1978); (12) Jonker et al. (1998); (13) Strohmayer (1998); (14) Titarchuk & Osherovich (1999); (15) Shaposhnikov & Titarchuk (2004); (16) Smale et al. (1997); (17) Lin et al. (2007), Lin et al. (2009); (18) Sanna et al. (2010); (19) Haberl & Titarchuk (1995); (20) BO02